Shuming Zhang, Yu Peng, Chunxi Huang, Tan Hao (2025). Effect of Transparency and Message Framing on Drivers’ Subjective Perceptions and Behaviors During Takeover Requests: An Information Design-Based Perspective. In: Advances in Human Factors of Transportation. AHFE Open Access, vol. 186, pp. 410–420. https://doi.org/10.54941/ahfe1006530
Publisher statistics will load when you open Metrics.
AHFE OPEN ACCESS OPEN ACCESS CONFERENCE PROCEEDINGS PAPER
Effect of Transparency and Message Framing on Drivers’ Subjective Perceptions and Behaviors During Takeover Requests: An Information Design-Based Perspective
With the advancement of advanced driver assistance systems (ADAS) technology, understanding drivers’ responses to takeover requests is crucial for ensuring safety and operational efficiency when driving with ADAS. However, existing research mainly focused on providing information through different modalities (e.g., visual or audial), while the combined effects of transparency and message framing on drivers' perception and behaviors when faced with takeover requests have not been thoroughly explored from an information design-based perspective. This study aimed to investigate the combined effects of transparency (i.e., transparent vs. not transparent) and message framing (i.e., gain vs. loss) on drivers’ perceptions of designed information and behaviors (takeover time, emotional reaction, and message attitude) during takeover requests. Thus, the experiment employed a 2×2 within-subject design, with 31 participants (i.e., 23 females and 8 males) completing a driving simulator study featuring four distinct message prompts. The results indicated that: (1) The transparency significantly impacts drivers’ takeover performance, with longer takeover time observed when the information is not transparent; (2) The message framing significantly influences drivers’ emotional reactions, in which loss-framed messages evoke stronger emotional reactions compared to gain-framed messages; (3) Both the transparency and message framing significantly influence drivers’ attitudes towards the designed messages. More specifically, transparent messages generally result in more positive attitudes, while gain-framed messages consistently lead to higher message attitudes compared to loss-framed messages. The findings of this study underscore the critical role of transparency and message framing in enhancing the safety of drivers when driving with ADAS, which could be used to guide the design of human-machine interaction interfaces, foster drivers’ acceptance of ADAS, and further calibrate drivers’ mental models of and trust in ADAS.
Effect of Transparency and Message Framing on Drivers’ Subjective Perceptions 411
systems has become a critical issue for improving driving safety and operational efficiency. Particularly in scenarios involving Takeover Requests (TORs), the way the system conveys information to the driver plays a pivotal role in influencing their decision-making and behavioral performance (Gold et al., 2016). A TOR refers to the crucial moment when the ADAS cannot handle the complex driving task and prompts the driver to resume control of the vehicle. During this process, the transparency of system messages and the framing of information are key factors that impact the driver’s response efficiency and quality.
Transparency generally refers to the system’s ability to provide the driver with clear information, explaining the reasons behind the TOR. Transparent information helps reduce uncertainty during the takeover process, enhances the driver’s trust in the system and situational awareness, and lowers cognitive and emotional load, thereby optimizing response times and takeover performance (Kunze et al., 2019; Zang and Jeon, 2022; Liu and Zhang, 2024). Conversely, opaque systems can lead to increased takeover time and unplanned takeover behaviors, reducing performance in non- driving-related tasks and compromising safety (Li et al., 2024). Message framing refers to presenting the same information using different semantic structures, such as gain-framed or loss-framed messages. Framing effects significantly influence emotional responses and decision-making behaviors in risk scenarios (Tversky and Kahneman, 1981). Gain-framed information tends to encourage positive attitudes and behaviors (Stadlthanner et al., 2022), whereas loss-framed information is more likely to trigger stronger negative emotions (Tversky and Kahneman, 1981; Zhang et al., 2022), prompting more urgent responses (Ropret Homar and Kneževi´c Cvelbar, 2021). A naturalistic experiment demonstrated that gain-framed messages (e.g., “Adhering to speed limits reduces accidents”) are more effective in reducing vehicle speed on highways compared to loss-framed messages (e.g., “Speeding increases accidents”) (Chaurand et al., 2015). However, presenting excessive negative information (e.g., road fatality statistics) can distract drivers and increase the risk of accidents (Hall and Madsen, 2022).
Although existing research provides some theoretical support for the application of transparency and message framing in ADAS scenarios, it also exhibits notable limitations. Existing studies tend to focus on a single factor, lacking systematic analysis of their interaction. Most research focuses on single-modal information transmission, failing to address how transparency and message framing can be comprehensively optimized from an information design perspective to enhance drivers’ takeover performance. Moreover, there is a lack of integration between subjective indicators (e.g., attitudes and emotions) and objective indicators (e.g., reaction times and physiological metrics) when understanding driver behavior. Few studies comprehensively examine how transparency and framing simultaneously influence these variables. To address the above mentioned research gaps, this study aims to explore the combined effects of transparency (i.e., transparent vs. not transparent) and message framing (i.e., gain vs. loss) on drivers’ subjective perceptions and behaviors during takeover requests.
METHOD
A total of 31 participants with valid driver’s licenses (23 females and 8 males) participated in this study. Among them, 19 participants were aged between 20 and 22, while 12 participants were aged 23 and above, with an average age of 22.6 years. The youngest participant was 21 years old, and the oldest was 26 years old. All participants reported normal or corrected-to-normal vision. The average driving experience of all participants was 2.26 years (SD = 1.48). All participants reported having no experience with autonomous driving systems, and all participants confirmed that they had not taken stimulants or sedatives within 24 hours before the experiment.
To explore the combined effects of different message designs on drivers’ perceptions of the designed information and behavior in takeover requests, and to minimize the influence of individual differences on experimental results, we used a 2×2 within-subject design. The experiment included two independent variables: Transparency and Message Framing, each with two levels: Transparent vs. Not Transparent, and Gain vs. Loss. Transparency reflects whether drivers are informed about the occurrence of an accident ahead, categorized into two scenarios: informing the driver about an accident ahead or providing no information, while at the same time, the Wizard of Oz method is used to simulate the proactive deceleration of an intelligent safety system. Message Framing presents either the benefits associated with slowing down or the losses associated with not slowing down in the face of a potential collision.
Each level of one dimension appeared with each level of the other dimension. For example, the transparency messages had one version with gain framing and another version with loss framing. By combining these dimensional levels, it is possible to analyze the effects of each dimension and their interactions. The four messages are “An accident ahead, slowing down = fewer collisions”, “An accident ahead, not slowing down = more collisions”, “Slowing down = fewer collisions”, “Not slowing down = more collisions”.
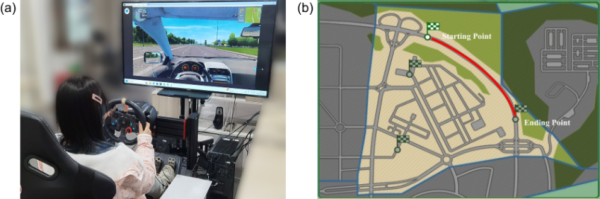
Figure 1: (a) The driving simulator used in this experiment, (b) Overhead view of the driving map in city car driving simulator.
The experiment was conducted in a driving simulator (Fig. 1a). The driving simulator system consists of a driver’s seat, steering wheel, pedals, display, and a high-performance computer providing the simulation driving platform. The driving scenario created by City Car Driving software (2016) was
Effect of Transparency and Message Framing on Drivers’ Subjective Perceptions 413
projected onto a 65-inch display with a resolution of 3840*2160 and a maximum refresh rate of 60 Hz. The steering wheel and pedals are controlled by a Logitech G29 combination controller.
The City Car Driving software (2016) provides vehicle dynamics simulation, autonomous driving algorithms, realistic scene rendering, and driving data recording. Drivers could control the vehicle’s movement using the steering wheel, brake pedal, accelerator pedal, and buttons for switching between forward, reverse, and gears 1, 2, and 3. The simulated driving map selected was the “New City, New District” map in the free driving mode (Fig. 1b). This map represents a large city surrounded by a ring road with suburban highway characteristics. Its road network includes a long one-way section suitable for simulating highway traffic environments, as marked by the red route in Fig. 1b. The experimental starting point was set from the highway entrance to the highway exit. To eliminate interference caused by environmental randomness in the game, such as weather, other vehicles, and pedestrians, the simulation settings were configured as follows: “summer, clear, daytime, 0% traffic density, and 0% pedestrian density.”
In the simulated driving environment of this experiment, the highway consisted of three lanes in each direction, with a speed limit of 60 km/h. During the driving task, the vehicle traveled at a speed of 40–55 km/h in the middle lane of the right-side two-lane road. Participants performed four simulated driving trials in a specified order, with each trial featuring one of four message prompts. To avoid sequence effects caused by different message prompts, each participant received the prompts in a randomized order. The driving task was the sole focus of the experiment, and participants were instructed not to engage in any non-driving-related activities. Traffic accidents were set up on the right-side two-lane road. According to the recommendation by Gold et al. (2013), the takeover time budget in the experiment was fixed at 7 seconds. Based on this, message prompts were issued when the vehicle was 103 meters away from the traffic accident. In the not-transparent condition, using the Wizard of Oz method, the experimenter pressed the brake pedal when issuing the message prompt to simulate the vehicle’s automatic deceleration. Additionally, due to the randomness of the game environment settings, only a single traffic accident was simulated on the right-side two-lane road to exclude interference from other vehicles or pedestrians in the game scene. After completing each driving trial, participants were required to subjectively evaluate their cognitive and affective resistance as well as their resulting attitudes toward the message. The subjective assessment questionnaire used after each trial was designed based on the items used by Chen (2013) and Dillard and Shen (2005). The questionnaire included several questions for each of the three indicators: threat appraisal, emotional reaction, and message attitude. Participants rated threat appraisal and emotional reaction on a 5-point Likert scale and message attitude on a 7-point scale. The detailed design of the questionnaire items is shown in Table 1. To prevent interference from the demographic background questionnaire, demographic information was collected only after the participants completed their fourth driving trial.
Table 1: Items used in survey to measure psychological reactance.
Table available in the original PDF paper.
Components Items Source Threat Appraisal The message threatened my freedom (Chen, 2013;
to choose.
Dillard and Shen, 2005) The message tried to plan for me. The message tried to manipulate me. The message tried to pressure me. Emotional Reaction I felt irritated after hearing this
(Chen, 2013;
message.
Dillard and Shen, 2005) I felt annoyed after hearing this
message. Message Attitude I thought this message is not at all
(Chen, 2013) convincing. – I thought this message is very convincing.
I thought this message is not at all persuasive. – I thought this message is very persuasive. I thought this message is not
sensible. – I thought this message is sensible. I thought this message is unimportant. – I thought this message is important. I thought this message is foolish. – I
thought this message is wise. I thought this message is wrong. – I thought this message is right.
The detailed procedure for the participants’ experiment is as follows:
1. The participant reads and signs the informed consent form. 2. The experimenter introduces the participant to the manual vehicle operation. 3. The participant is given a brief introduction to the entire experimental procedure. 4. Adjustment and calibration. The participant sits in the seat while the experimenter adjusts the height of the display to align the participant’s line of sight with the center of the screen. The position and tilt of the seat are adjusted to ensure that the participant is in the most comfortable driving posture. 5. The participant engages in a practice drive on a route similar in traffic density and road type to the experimental driving task. This allows them to familiarize themselves with the driving simulator and environment. The practice ends when participants indicate satisfying driving experience. 6. The formal experiment begins, with the participant completing four simulated driving trials in a prescribed order (i.e., the sequence is unknown to participants). 7. The participant fills out a subjective evaluation questionnaire.
Effect of Transparency and Message Framing on Drivers’ Subjective Perceptions 415
8. The participant rests in the driving simulator for 1–2 minutes before proceeding to the next driving session. 9. The process is repeated until the fourth driving session is completed. The participant then completes a demographic questionnaire, which includes basic driving information such as gender, age, and years of driving experience. This marks the end of the experimental procedure for the participants.
Participants are allowed to have breaks between the experimental drives. It should be noted that, to avoid the influence of potentially interfering variables (e.g., ambient environmental noise, lighting conditions, and temperature), all experimental drives are conducted in the same quiet room with constant lighting conditions and room temperature (Fig. 1a).
In this study, we used four dependent variables to measure drivers’ takeover performance: reaction time, threat appraisal, emotional reaction, and message attitude. Among these, reaction time is an objective variable, while the other three are subjective variables.
Takeover Time (TOT) is defined as the time that drivers take to resume control from automated driving (by initiating steering or braking actions) after a critical event occurs in the environment or after receiving a TOR (Huang et al., 2024b; Zhang et al., 2019). This metric reflects the time required for the driver to make a takeover decision after receiving a TOR.
Based on the items used by Chen (2013) and Dillard and Shen (2005), participants’ cognitive and affective resistance, as well as their resulting attitudes toward the message after completing each driving task, were measured, as listed in Table 1.
Respondents measured the degree of agreement with statements about the threat to freedom conveyed by the message using four 5-point Likert scales from 1 to 5 (i.e., 1 refers to strongly disagree and 5 refers to strongly agree). An overall score was computed by averaging the responses across all items with a larger value representing a larger perceived threat to freedom.
Respondents measured the extent to which they experienced different emotions after reading the message using two 5-point Likert scales from 1 to 5 (i.e., 1 refers to none of this feeling and 5 refers to a great deal of this feeling). An overall score was computed by averaging the responses to both items with a larger value indicating a greater negative emotional response to the message.
Attitudes toward the message were measured using a six-item scale, each anchored by bipolar adjectives with seven levels of response to statements about each message. The mean level of attitude toward each piece of message was computed by averaging the responses to these items with a larger value indicating a more positive attitude toward the message.
We utilized generalized linear regression models to analyze the effects of transparency and message framing on drivers’ subjective perceptions and behaviors during takeover requests, with repeated measures considered. Post-hoc comparisons were conducted when significant main effects were found. The independent variables were transparency (i.e., transparent vs. not transparent), message framing (i.e., gain vs. loss), and their two- way interaction. It was verified that the data satisfied the assumptions
for mixed-design ANOVA (i.e., no extreme outliers, normally distributed, homogeneity of variance, and homogeneity of covariances). The visualization and statistical analysis was performed using R 4.2.2.
RESULTS
We found that both transparency and message framing had no significant influence on drivers’ threat appraisal. Table 2 presents the significant effects of transparency and message framing on takeover time, emotional reaction and message attitude. Table 3 presents the ANOVA results of transparency and message framing on takeover time, emotional reaction and message attitude.
Table 2: Post-hoc comparisons of takeover time, emotional reaction and message attitude.
(Intercept) 4.98 0.18 27.15 < 2e-16 *** Transparency 0.52 0.21 2.45 0.02 * Message Framing −0.56 0.21 −2.63 0.01 ** Note: DVs stand for dependent variables, and IVs stand for independent variables. The reference levels for transparency and message framing were ‘not transparent’ and ‘gain’.
Table 3: ANOVA results of takeover time, emotional reaction and message attitude.
Transparency 1 8.34 8.34 5.99 0.02* Message Framing 1 9.60 9.60 6.90 0.01** Residuals 121 168.42 1.39 Note: DVs stand for dependent variables, and IVs stand for independent variables. The reference levels for transparency and message framing were ‘not transparent’ and ‘gain’.
Effect of Transparency and Message Framing on Drivers’ Subjective Perceptions 417
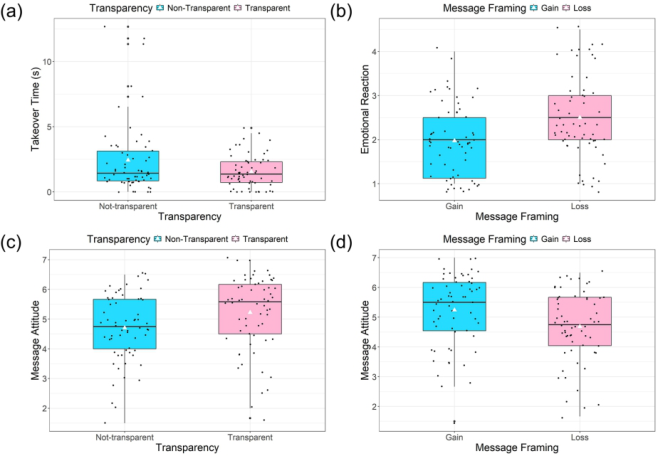
Figure 2: (a) Comparison of the takeover time across different transparency groups, (b) Comparison of the emotional reaction across different message framing groups, (c) Comparison of the message attitude across different transparency groups, (d) Comparison of the message attitude across different message framing groups.
The results indicate that information transparency has a significant effect on takeover time (F(1, 121) = 5.25, p = .02). Fig. 2(a) illustrates the takeover time under different transparency conditions. The takeover time under the not-transparent condition is higher than that under the transparent condition. This suggests that when drivers receive transparent information, their takeover time is shorter compared to when they receive non-transparent information. Enhancing information transparency may help reduce individuals’ takeover time from the perspective of information processing.
It was found that the message framing has a significant effect on emotional reaction (F(1, 121) = 10.91, p = .001). Fig. 2(b) presents in emotional reaction under the gain frame and loss frame conditions. It could be seen that when information is framed as a loss, individuals exhibit stronger emotional reaction compared to when it is framed as a gain. Drivers’ emotional reaction to loss-framed information is higher than those to gain-framed information.
We found that the information transparency has a significant effect on message attitudes (F(1, 121) = 5.99, p = .02). Fig. 2(c) further illustrates the specific impact of transparency on message attitudes. Message attitudes under the transparent condition are higher than those under the non- transparent condition, indicating that information presented transparently is more favorable. Moreover, the distribution of message attitudes under the transparent condition is more concentrated, suggesting that increased information transparency helps enhance the consistency of message attitudes. Specifically, drivers exhibit a significantly more positive attitude toward
transparent information, highlighting that communication clarity is key to improving information reception and acceptance.
It was found that the message framing also has a significant effect on message attitudes (F(1, 121) = 6.90, p = .01). Fig. 2(d) compares message attitudes under the gain and loss framing conditions. The median message attitude is lower when information is presented in a loss frame than when it is presented in a gain frame. This suggests that gain-framed information elicits more positive attitudes compared to loss-framed information. This trend is particularly evident among drivers, who consistently exhibit higher message attitudes when information is gain-oriented rather than loss-oriented.
DISCUSSION
In this study, we conducted a driving simulator study to explore the combined effects of message transparency and framing on driver behavior and perceptions during takeover requests, focusing on takeover time, emotional reaction, and attitudes toward message.
Drivers’ responses to different message prompts suggest that not- transparent communication may increase uncertainty in decision-making, requiring individuals to allocate additional cognitive resources to process the information, and the increased cognitive load may lead to longer takeover times (Fox and Rey, 2024). Additionally, individuals’ aversion to losses is typically stronger than their preference for equivalent gains (Tversky and Kahneman, 1991). As such, loss-framed messages may trigger more intense negative emotions (Wong et al., 2013). At the same time, transparency may enhance trust in the information source and perceived control over the decision-making process, which could increase drivers’ acceptance and satisfaction for the information (Muir, 1994). Furthermore, people tend to have optimistic expectations regarding positive outcomes, thus messages emphasizing gains may align with this optimism bias, thereby eliciting more favorable attitudes.
Several limitations of this study should be noted here. First, the study was conducted in a controlled environment, making it difficult to fully replicate the complexity of real-world driving. Second, the current study sample lacks representativeness, as factors such as age, cultural background, and driving experience may limit the generalizability of the findings. Third, this study primarily focused on the immediate behavioral and emotional responses to message transparency and framing, without investigating long- term effects such as trust (Huang et al., 2024a), reliance, or changes in habits related to information presentation. Finally, the combined effects of message transparency and framing, as well as their interactions with urgency, modality, and system reliability, remain to be further investigated. Future studies should address these limitations by exploring real-world scenarios, examining long-term behavioral impacts, and investigating the interactions between these factors.
Effect of Transparency and Message Framing on Drivers’ Subjective Perceptions 419
CONCLUSION
In this study, based on the data collected from a driving simulator experiment, we investigated the effects of transparency and message framing on drivers’ subjective perceptions and behaviors during takeover requests from the perspective of information design. The key findings are summarized as follows:
The information transparency significantly impacts drivers’ takeover performance, with longer takeover time observed when the information is not transparent.
The message framing significantly affects drivers’ emotional reactions, with loss-framed messages eliciting stronger emotional reactions compared to gain-framed messages.
Both transparency and message framing significantly influence drivers’ attitudes toward the designed messages. Transparent messages generally result in more positive attitudes, while gain-framed messages consistently lead to higher attitude scores than loss-framed messages.
In all, the findings of this study underscore the critical role of transparency and message framing in enhancing the safety of drivers when driving with ADAS, which could be used to guide the design of human-machine interaction interfaces, foster drivers’ acceptance of ADAS, and further calibrate drivers’ mental models of and trust in ADAS.
REFERENCES
Chaurand, N., Bossart, F. and Delhomme, P. (2015) A naturalistic study of the impact of message framing on highway speeding. Transportation Research Part F: Traffic Psychology and Behaviour, 35: 37–44. doi: 10.1016/j.trf.2015.09.001. Chen, Y. (2013) The effect of psychological reactance on acceptance of campaign
message: A case of “stop texting while driving” campaign in college students. Master of Science, Iowa State University, Digital Repository. doi: 10.31274/etd- 180810-3528. Dillard, J. P. and Shen, L. (2005) On the Nature of Reactance and its Role in Persuasive Health Communication. Communication Monographs, 72 (2): 144–168. doi: 10.1080/03637750500111815. Fox, S. and Rey, V. F. (2024) A Cognitive Load Theory (CLT) Analysis of
Machine Learning Explainability, Transparency, Interpretability, and Shared Interpretability. Machine Learning and Knowledge Extraction, 6 (3): 1494–1509. doi: 10.3390/make6030071. Gold, C., Damböck, D., Lorenz, L., et al. (2013) “Take over!” How long does it take to get the driver back into the loop? Proceedings of the Human Factors and Ergonomics Society Annual Meeting, 57 (1): 1938–1942. doi: 10.1177/ 1541931213571433. Gold, C., Körber, M., Lechner, D., et al. (2016) Taking Over Control From Highly
Automated Vehicles in Complex Traffic Situations: The Role of Traffic Density. Human Factors: The Journal of the Human Factors and Ergonomics Society, 58 (4): 642–652. doi: 10.1177/0018720816634226. Hall, J. D. and Madsen, J. M. (2022) Can behavioral interventions be too salient? Evidence from traffic safety messages. Science, 376 (6591): eabm3427. doi: 10.1126/science.abm3427.
Huang, C., Wang, J., Yan, S., et al. (2024a) Exploring Factors Related to Drivers’ Mental Model of and Trust in Advanced Driver Assistance Systems Using an ABN- Based Mixed Approach. IEEE Transactions on Human-Machine Systems, 54 (6): 646–657. doi: 10.1109/THMS.2024.3436876. Huang, W.-C., Fan, L.-H., Han, Z.-J., et al. (2024b) Enhancing safety in conditionally
automated driving: Can more takeover request visual information make a difference in hazard scenarios with varied hazard visibility? Accident Analysis & Prevention, 205: 107687. doi: 10.1016/j.aap.2024.107687. Kunze, A., Summerskill, S. J., Marshall, R., et al. (2019) Automation transparency: implications of uncertainty communication for human-automation interaction and interfaces. Ergonomics, 62 (3): 345–360. doi: 10.1080/ 00140139.2018.1547842. Li, J., Liu, J., Wang, X., et al. (2024) The Impact of Transparency on Driver Trust and Reliance in Highly Automated Driving: Presenting Appropriate Transparency in Automotive HMI. Applied Sciences, 14 (8): 3203. doi: 10.3390/app14083203. Liu, Z. and Zhang, J. (2024) Exploring factors in Human Cognition that affect
Human Performance during Takeover in Autonomous Driving. Highlights in Science, Engineering and Technology, 85: 1182–1193. doi: 10.54097/tr5g0e77. Muir, B. M. (1994) Trust in automation: Part I. Theoretical issues in the study of trust and human intervention in automated systems. Ergonomics, 37 (11): 1905–1922. doi: 10.1080/00140139408964957. Ropret Homar, A. and Kneževi´c Cvelbar, L. (2021) The effects of framing on
environmental decisions: A systematic literature review. Ecological Economics, 183: 106950. doi: 10.1016/j.ecolecon.2021.106950. Stadlthanner, K. A., Andreu, L., Ribeiro, M. A., et al. (2022) The effects of message framing in CSR advertising on consumers’ emotions, attitudes, and behavioral intentions. Journal of Hospitality Marketing & Management, 31 (7): 777–796. doi: 10.1080/19368623.2022.2065399. Tversky, A. and Kahneman, D. (1981) The Framing of Decisions and the Psychology
of Choice. Science, 211 (4481): 453–458. doi: 10.1126/science.7455683. Tversky, A. and Kahneman, D. (1991) Loss Aversion in Riskless Choice: A Reference- Dependent Model. The Quarterly Journal of Economics, 106 (4): 1039–1061. doi: 10.2307/2937956. Wong, N. C. H., Harvell, L. A. and Harrison, K. J. (2013) The Unintended Target:
Assessing Nonsmokers’ Reactions to Gain- and Loss-Framed Antismoking Public Service Announcements. Journal of Health Communication, 18 (12): 1402–1421. doi: 10.1080/10810730.2013.798376. Zang, J. and Jeon, M. (2022) The Effects of Transparency and Reliability of In- Vehicle Intelligent Agents on Driver Perception, Takeover Performance, Workload and Situation Awareness in Conditionally Automated Vehicles. Multimodal Technologies and Interaction, 6 (9): 82. doi: 10.3390/mti6090082. Zhang, B., de Winter, J., Varotto, S., et al. (2019) Determinants of take-over
time from automated driving: A meta-analysis of 129 studies. Transportation Research Part F: Traffic Psychology and Behaviour, 64: 285–307. doi: 10.1016/ j.trf.2019.04.020. Zhang, G., Li, M., Li, J., et al. (2022) Green Product Types Modulate Green Consumption in the Gain and Loss Framings: An Event-Related Potential Study. International Journal of Environmental Research and Public Health, 19 (17): 10746. doi: 10.3390/ijerph191710746.
LISTED IN THE AHFE DIGITAL BOOKSTORE CATALOGUE
Explore the complete digital volume
Advances in Human Factors of Transportation
Read this individual research paper free through the original publisher, or explore the full digital proceedings book.
ISBN 978-1-964867-62-5
Explore this ISBN in the AHFE Bookstore ↗Listed in the July 2026 bookstore catalogue; search by ISBN to confirm current availability · Digital book purchase optional