Nan Jiang, Jian Wu, Shuming Zhang, Yao Ding, Fengyi Guo (2024). An Inclusive design methodology for smart home products good for market performance. In: Usability and User Experience. AHFE Open Access, vol. 156, pp. 445–455. https://doi.org/10.54941/ahfe1005455
In the background of the rapid development of technology and intelligence, intelligent technology has brought more novel and convenient experiences to most users when using home appliances. It is because young users have become accustomed to the smart products, but it has also increased the difficulty for special groups such as the elderly and disabled. Home appliances are very daily products for the elderly, however the emergence of new forms and technologies of home appliances has lead them being unable to use basic functions properly. Large smart screens with tons of functions has made it difficult for users to find the key to access; voice operations have made it difficult for them to know how to speak, and so on. The era of intelligence has brought unprecedented technological panic to these special groups.However, despite the fact that the home appliance industry began addressing the issue of product usage for special groups as early as 2000, there has always been a significant challenge. The problem is that once the home appliance design meets the needs of a special group, the product will have "awkward shape", such as the washing machine's buttons being too large to accommodate more functions; The small size of the refrigerator is only for the convenience of elderly people to access, but it affects the volume for daily life required. In a word, although it meets the needs of the special population, it sacrifices the user experience of most people and even affects market sales.The main reason for the problems is the lack of practical and feasible inclusive research and design methodologies for smart home appliances. The main popular methodology is “Microsoft's inclusive design”, but it mainly focuses on software without a specific methodology for smart home products that combine software and hardware. This paper built a research and design methodology for innovative smart home products targeting special and healthy populations.And based on the know-how of R&D, we attempt to overcome this challenge and ensure that products that have been designed by this methodology can meet the needs of special populations for accessible use, while also covering healthy users as much as possible. While gaining a good reputation for humanity design in the market, it can also ensure market efficiency. Finally, the article introduces three successful cases of applying this methodology.
PURPOSE AND SIGNIFICANCE Accessible design and Universal design related to inclusive design. Below is a brief description of the differences among the three categories.
Accessible design: Targeting differences in physical abilities, it specifically refers to making designs that are friendly to disabled usage scenarios (includ- ing temporary and situational disabilities that healthy individuals may have). Universal design: Aiming at everyone, emphasizing that the same design can be used by everyone. Inclusive design: Targeting users with different abili- ties, providing diverse designs and opportunities in a more diverse way, in order to serve as many people as possible (Persson, 2014). Commonly used
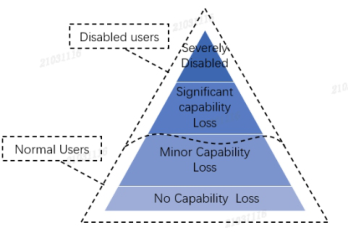
“User Pyramid” (Benktzon, 1993) to represent the relationship between the three,based on it, “No Capability Loss “is added, and divided it into two categories: Disabled user and the Normal Users (see Figure 1).
Figure 1: User pyramid (adapted from Benktzon, 1993).
A table was made to show the relationship between the three concept (see Table 1).
Table 1. Comparison table of the three.
Table available in the original PDF paper.
For in the field of smart home, the concept of inclusive design is more suitable. The first reason is that inclusive design is more in line with the characteristics of smart home products. Universal design emphasizes cov- ering all users through the same design, while inclusive design emphasizes providing different designs for different people, which is consistent with the goal of smart home. Smart home products emphasize providing comfortable and healthy lifestyles with personalized ways for different family members (it should be noted that actually product design in the smart home field includes both universal design and inclusive design). The second reason is that inclu- sive design was first proposed to be linked to the market. In 1994, Roger Coleman first proposed the term “inclusive design” at the 12th International
An Inclusive Design Methodology for Smart Home Products Good 447
Society of Human Engineering. Inclusive design was then considered a con- cept that helped market dealers see the potential market benefits of a product (Clarkson, 2003).
DISCUSSIONS AND ISSUES ON VARIOUS INCLUSIVE DESIGN METHODOLOGIES Tracking the global research trends related to inclusive design, it can be seen that the trend is that theoretical research is already abundant and tends to be stable, while there are more and more inclusive methodologies that specifi- cally guide design and research and development. So we focus on studying the advantages and disadvantages of inclusive design methods worldwide, and then see how to transform them into inclusive methodologies suitable for the field of smart home.
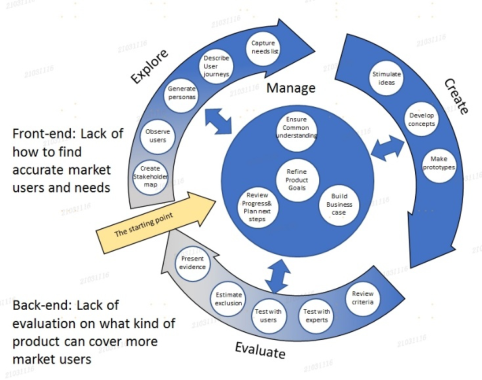
Figure 2: Inclusive design wheel (adapted from inclusive design toolkit of University of Cambridge).
In addition to the “User Pyramid” mentioned above, this model can help us plan and design the overall direction of the target audience. Other well- known ones include Microsoft’s Inclusive Design Methodology (Microsoft, 2016) and Cambridge University’s Inclusive Design Wheel (Cambridge Uni- versity School of Engineering,1980s). The inclusive design Wheel is quite comprehensive and detailed, expressing a continuous design process cen- tered on “Manage”, with “Explore”, “Create”, and “Evaluate” all revolving around the center. And provide various toolkits for each link. But it is found that there is a lack of correlation with the market from the entire contin- uous wheel. The Microsoft Inclusive Design Methodology and Cambridge Design Wheel only tell designers one direction, which is to “first identify a target audience, and then try to cover as many people as possible.” How- ever, the front-end “Explore” stage lacks how to identify which type of user needs should be addressed from the market, and the back-end “Evaluate”
stage lacks how to identify which solution covers more users. In fact, these two steps are very important. Facts have shown that due to the lack of mar- ket correlation research, the wrong user and design direction were chosen in the early stage, and the wrong solution was chosen in the later stage. The so-called “Friendly Design” that come into the market could not form long- term stable profits and was quickly delisted, causing losses to the enterprise. Therefore, the following study is to supplement the methodology of the front and back ends of the inclusive design wheel.
INTRODUCTION TO IDIM METHODOLOGY IDIM (Inclusive Design for Ideal Market) is divided into two parts, establish- ing market front-end and back-end connections.
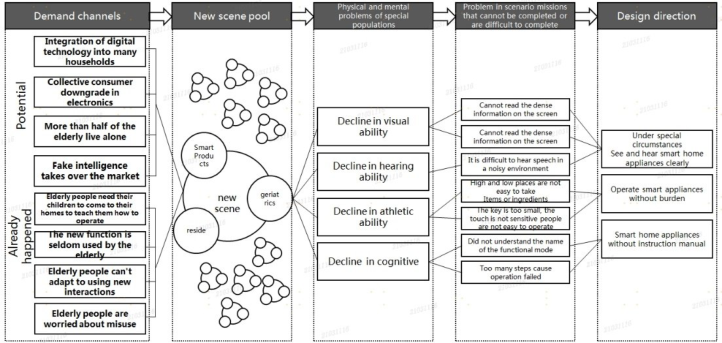
Figure 3: A case of flowchart of front-end connection.
Establish front-end connection: Identify new life scenarios from both “Potential” and “Already Happened” perspectives. “Potential” refers to the analysis of new life scenarios that may arise in the future from four aspects: politics, economy, society, and culture (Aguilar, 1967). Identify special users and needs in new generated scenarios from user comment system that has already occurred. Then, all the new scenes will be summarized into a new scene pool, and the differences in the physical and mental functions of the special populations involved will be listed. There are two ways to identify the problem points: one is to find users with such physical and mental func- tion problems for human-machine testing, and the other is to have designers wear devices that simulate special populations for testing. The two methods are selected based on the cost and speed of the actual R&D process. Identify interaction issues that may arise when completing tasks in these new scenarios through testing, and ultimately summarize these issues into design directions. Figure3 is shown a successful case.
An Inclusive Design Methodology for Smart Home Products Good 449
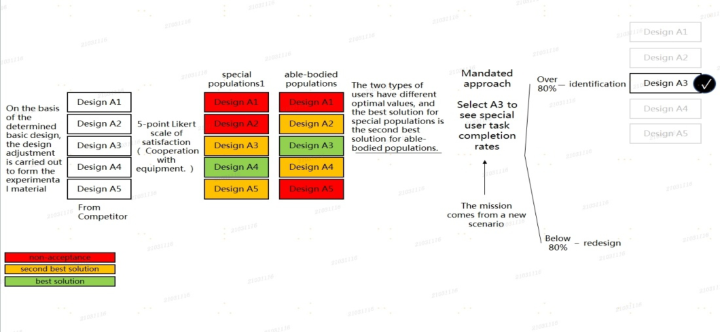
Establishing back-end connection(see Figure 4): The common problem with back-end is the lack of specific evaluation plans, which cannot effec- tively guide and evaluate product design. Most smart home products only have one design form because of costs and aesthetics. Therefore, choosing which design form becomes a problem.
For example, users with physical disabilities find it difficult to reach the bottom of the washing machine. When we raise the inner drum of washing machine, it does make it easier for disabled groups to pick up and place it, but the problem it brings is that the capacity of the washing machine is reduced, and the biggest purpose of the washing machine is to wash more clothes, which actually makes normal users give up buying. Designers actually don’t know how many new disabled users these subtle changes will attract and how many normal users will be lost. In industry standards, generally speaking, the standards for the general population and disabled groups are different. Designers will only see design data suitable for disabled users, but they do not know how to flexibly adjust the data. The new inclusive design method- ology provides detailed and practicable evaluation methods to help designers quickly and accurately select design solutions, covering a wider range of users.
Figure 4: The flowchart of back-end connection.
Firstly, in the final design proposal, it is necessary to expand different pro- posals based on collecting 2–4 competitors of the same model with good sales and reputation on the market, and paying attention to only minor changes between the designs. By using subjective and objective satisfaction testing methods (see Table 3), the subjective the Likert satisfaction scale (see Table 2) is combined with professional equipment to capture physiological, psycho- logical, and behavioural data to ensure the accuracy of the results of the Likert scale. The advantage of this scale is that it can help determine the satisfaction level of all designs. In general, the best solution for the general population and the disabled population must be different, and the best solu- tion for the disabled population is basically the second-best solution for the general population. After accumulating 20–30 projects annually, it has been
found that if the best solution for disabled users is chosen, it is likely to affect the main functions of the product, thereby affecting the purchasing power of the general population. But if we choose the best solution for the general population, disabled users actually have a high acceptance of their second- best solution. So the basic principle is to ensure that the selected best solution for normal people is within the acceptable range of disabled users, but how to determine it becomes the most crucial step. In this step, we did not con- tinue to use “acceptance related scales”, but instead using task completion rate (ISO/TS 20282,2013). The reason is that the results of the scale can represent levels, but cannot analyse an accurate acceptance line. This prob- lem mainly comes from elderly users. It was found that during the interview process with such users, their self-expression does not match the facts. Even in situations where it is difficult to complete or the task is not completed, some elderly users still express “acceptable”. So we chose the observation task method here, selecting 10 disabled group users and evenly distributing them based on age and physical function to observe their task completion. The task here is the core task of the design, which is a commonly used task. For example, the washing machine is “Turn on - Select common mode - Select parameters - Start”. The judgment standard is to determine whether the task completion rate of disabled users exceeds 80% based on the best design of normal users (GB/T 32261.2,2018). Ergonomics generally requires products to meet the needs of over 90% of users. A 100% pass rate in user testing is necessary to achieve a success rate of 92% for the target user group at a confidence level of 80%, in order to meet this requirement. Given daily experience, it is difficult for disabled people to achieve a completion rate of 100%, so the ergonomic requirements have been appropriately relaxed. At present, the standard requires only an 80% pass rate for user testing. Accord- ing to GB/T 32261.2, the estimated success rate of the target user group at an 80% confidence level is around 70%. Failure to complete tasks and exceed- ing three times the proficiency time during task operation is considered task failure. If it exceeds 80%, the best solution for normal users can be chosen. However, if the task completion rate is below 80% and negative feedback has been generated from disabled users during the testing process, the solution needs to be redesigned.
Table 2. Likert satisfaction scale.
Table available in the original PDF paper.
Not at all satisfied Satisfied Neutral Satisfied Very satisfied
1 2 3 4 5
Are you satisfied with the design?
We have conducted 3 experiments to confirm the feasibility of this method based on real market data. In fact, we added a purchase intention Likert scale question(see Table 4) before and after the testing to assess changes in purchase intention(see Table 5). This experiments ultimately showed that the design selected through this methodology can ensure that the overall change rate of purchase intention of the two groups of people is positive.
An Inclusive Design Methodology for Smart Home Products Good 451
Table 3. Subjective and objective test data table.
Subjective data Likert Scale Score Physiological and psychological data (Taking eye trackers as an example) Behavioural data Task completion time Task error rate
Do you think this design will strengthen the desire to purchase
Table 5. Purchase intention change data table.
Table available in the original PDF paper.
The best design for disabled users
Initial design The best design for the normal users
Normal users Disabled users
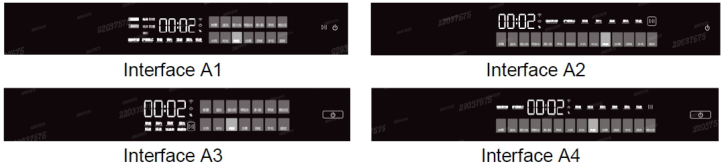
EXAMPLE OF CASE (1) Experiment Name: Interface Layout Study of Washing Machine. (2) Experiment Reason: With the development of smart homes and the increasing number of product functions, taking washing machines as an example, we have chosen the most functional interfaces currently avail- able, studied the layout of washing machine interfaces, and clarified design principles. Through research, we clarified the existing washing machine inter- face styles, processed the interface, and removed visual factors. Finally, we designed four interface interaction prototypes.
Figure 5: Comparison of design.
(3) Users Recruitment criteria: In order to ensure the wide representa- tiveness of the sample, 30 users were randomly selected according to the statistical principle of sample balance. The users were divided into 15 males and 15 females; This includes 15 normal users aged 30–55 and 15 elderly users aged 60–70. (the test is the recruitment of users for actual projects in the enterprise, which can ensure the accuracy of screening test users).
Figure 6: Test process diagram with eye tracker.
(4) Experimental method: Before the experiment begins, the interviewer explains the experimental procedures to the user, and then conducts equip- ment debugging to prepare for the experiment. Design tasks based on testing requirements for participants to operate the product according to scripts, and use an eye tracking device to record the user’s eye movement. The required collection indicators include gaze trajectory, task completion time, task error rate, and subjective score.
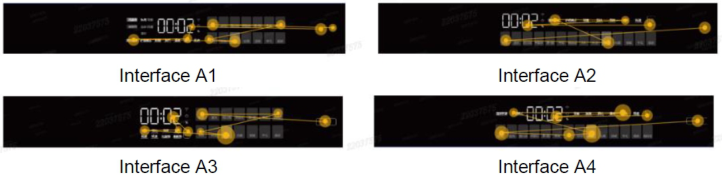
Figure 7: Eye tracking images for normal users.
Through the user’s eye tracking, it can be observed that the paths of the four existing interfaces all follow the operational logic.
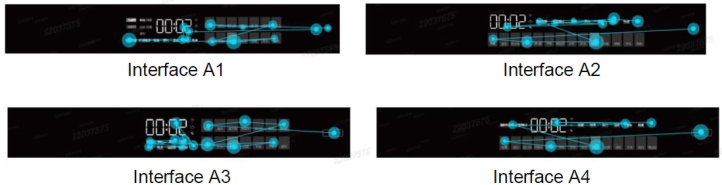
Figure 8: Eye tracking images for elderly users.
An Inclusive Design Methodology for Smart Home Products Good 453
The eye tracking of elderly users can be observed that when clicking on the program, the program is arranged in a single row for faster use; In interface A3, when the parameters are arranged in double rows, the eye tracking of the elderly begins to become chaotic, so this arrangement will increase the cognitive difficulty of the elderly.
Task completion time Task error rate 3/15 3/15 5/15 2/15
Note: Due to visual issues, the eye movement indicators of 4 elderly users have been invalidated, and the eye movement indicators in the table are for 11 people.
The results indicate that normal users chose interface A1, while elderly users chose interface A4. Normal users believe that information is more concentrated and easier to search. So we use IDIM methodology to make judgments. See if the “second-best solution” for the elderly can enable them
to successfully complete tasks. The specific criterion for task success is that the simulated completion time of the laundry task is within 3 times that of the proficient user, which is considered as task success. The average time for skilled users is 5.26s, with a task completion rate of over 80%.
Table 8. Task completion rate for the elderly population.
According to the data, if it is Interface A1, the purchasing intention of the healthy population among 30 users increased by 20.9%, while the purchas- ing intention of the elderly population increased by 12.0%, with an average increase of 16.45%, If it is Interface A4, among the 30 users, the purchasing intention of the healthy population increases by 17.4%, while the purchas- ing intention of the elderly population increases by 10.1%, with an average increase of 13.75%. Therefore, after verifying the inclusive design methodol- ogy of IDIM, selecting Interface 1 can maximize the coverage of more people and may ensure market performance.
In addition to the above case, there are also real market data to confirm the effect of purchasing changes by recruiting users. the washing machine has been on the market for 5 months. Although it is not possible to count the percentage of sales to the elderly and the general population, the total sales have been significantly increased compared to the previous generation of products, with the sales of the washing machine increasing by 15.4%. In addition, user evaluation system statistics for a year of user evaluation system data, the washing machine compared to the previous generation, the bad evaluation which is that elderly people have difficulty using washing machines is reduced 79.4%. In the market sales increasing at the same time, user evaluation has also increased dramatically, so it can be judged that the IDIM methodology has effectively solved the problem that the connection with market is not close.
FUTURE DIRECTION The problem with this method is that research is still needed based on each product design. The future direction is to accumulate a large amount of prod- uct testing data, form scientific algorithms, and develop an experience digital
An Inclusive Design Methodology for Smart Home Products Good 455
twin system. Design and R&D personnel can automatically input various design data, and the system can output experience results for various groups of people and the number of the market population covering.
REFERENCES
Cambridge University School of Engineering. (1980s). Inclusive Design Toolkit. Francis J. Aguilar. (1967). Scanning the Business Environment. Hans Persson. (2014). Universal design, inclusive design, accessible design, design for all: different concepts—one goal? On the concept of accessibility— historical, methodological and philosophical aspects. International Organization for Standardization. (2013). Information technology –
Accessibility considerations for people with disabilities – Part 2: Requirements for the design and development of accessible ICT products and services, ISO, Switzerland. John Clarkson. (2003). Inclusive Design for the Whole Population. Maria Benktzon. (1993). Designing for our future selves: the Swedish experience Microsoft. (2016). Microsoft Inclusive Design. Standardization Administration of China. (2018). Information technology - Guidelines for accessibility design – Part 2: Accessibility design of software products, SAC, China.
LISTED IN THE AHFE DIGITAL BOOKSTORE CATALOGUE
Explore the complete digital volume
Usability and User Experience
Read this individual research paper free through the original publisher, or explore the full digital proceedings book.
ISBN 978-1-964867-32-8
Explore this ISBN in the AHFE Bookstore ↗Listed in the July 2026 bookstore catalogue; search by ISBN to confirm current availability · Digital book purchase optional