Jian Wu, Nan Jiang, Shuming Zhang, Yao Ding, Yaoyao Zhao, Fengyi Guo, Sihan Chen (2024). The construction method and application of a dynamic user experience evaluation system for smart home appliances. In: Usability and User Experience. AHFE Open Access, vol. 156, pp. 291–302. https://doi.org/10.54941/ahfe1005440
The term UX is usually applied in the software field, but it is also used in the hardware product, space and service at present. Apart from the relatively mature UX evaluation methods in the automotive field, the construction of the UX evaluation system in the smart home appliance field is not perfect enough, and there is no exclusive, flexible, and universal evaluation system.One is that smart home appliances are different from traditional products, such as beds and office chairs, and do not require much brain thinking. Smart home appliances still have interfaces to interact with, but they are different from software products, such as mobile phones and computers, which require long-term interaction; Secondly, different household appliances also have their own characteristics, such as washing machines placing more emphasis on interface interaction, refrigerators placing more emphasis on space capacity, and water heaters placing more emphasis on installation; Thirdly, the usage tasks of existing household appliances are constantly changing according to lifestyle trends, and the emergence of new scenarios leads to changes in the task of evaluating smart household appliances. In addition, many evaluation systems have not been effective in improving the R&D process of household appliance in practice. Due to a lack of understanding of the product development process, the R&D design is unable to address the identified issues and truly assist in improving the product experience.In these cases, an evaluation system and application process mechanism for smart household appliances were built. This paper mainly studies four directions: (1) Combining industry analysis and home appliance attributes, define exclusive UX index specifically for home appliances. (2) Expanding UX index into a dynamic evaluation system, which can be reflected in: ① being applicable to different categories of household appliances, assigning index weights based on user, R&D personnel, and market feedback; ② It can be applied to users with different physical states, such as the elderly and ordinary people, to adjust the difficulty of passing the index; ③ It can be applied in different scenarios and tasks, analyzing lifestyle trends and market feedback, predicting the occurrence of new usage scenarios and tasks, and adjusting evaluation system testing tasks. (3) Integrate the UX evaluation system into the development process of new products, form a complete design and testing process, and help products achieve experience optimization continuously. (4) Based on three successful cases, point out the feasibility of the UX evaluation system for improving the home appliance experience and its positive impact on the market.
Today’s society is in the context of the information age, the rapid development of the Internet, a large number of smart home appliances have also appeared in people’s homes, in order to further improve people’s living standards and expand the home appliance service market, smart home scenarios have begun to appear. For example, traditional home appliance brands such as Haier and Midea have taken the smart home appliance industry as a breakthrough in transformation and upgrading, and carried out intelligent transformation and breakthroughs in traditional household appliances such as air conditioners and kitchen appliances. Among them, as the actual user of smart home prod- ucts, user experience is gradually placed in a more important position, and the attention to user needs in the field of home appliances is getting higher and higher, and the feedback on user experience is also becoming more and more important.
ANALYSIS OF THE CURRENT SITUATION OF SMART HOME PRODUCT EVALUATION SYSTEM To explore the development of user experience, we conducted a literature search for specific keywords and keyword combinations, as shown in Table 1.
Table 1. Literature search keywords.
Table available in the original PDF paper.
Search for a topic
Examples of search keywords An example of the scope of the search Process division, user needs, UET evaluation, and whole-process user experience evaluation of home appliances User experience development of smart home products HFE, IEEE Xplore, ScienceDirect, and China National knowledge Infrastructure Construction and development of user experience evaluation system in other fields
Qualitative measurement (user interview method, observation method), quantitative measurement (measurement of physiological response signals such as facial expressions, EEG, and eye movement using relevant instruments and equipment), direct evaluation, modeling evaluation (analytic hierarchy process, expert consultation method, etc.)
After screening and merging the literature, we selected the representative results. Cao (2012) analyzed the psychological needs and physiological needs of users, and focused on the importance of the price, brand power and active adaptation characteristics of smart interactive home appliances to the psycho- logical needs of users; Li et al. (2017) analyzed the psychology and needs of smart home appliance users from the perspective of consumer psychology and social psychology, and summarized the characteristics of demand changes in
The Construction Method and Application 293
three aspects: networking, humanization and emotion. Jung (2022) investi- gated the user experience and identified the user’s needs for common kitchen utensils by conducting semi-structured interviews with users who frequently use kitchen utensils. With the continuous development of user experience, experts at home and abroad have established corresponding evaluation sys- tems to effectively sort out and integrate the complex feedback information data. For example, Munawar et al. (2020) took the user as the evaluation object of the recommendation system framework, and Zhou et al. (2023) took four first-level indexes of interaction efficiency, interface comfort, plat- form reliability, and platform attractiveness as the core, and 16 second-level indexes as the core Liang et al. (2017) applied the analytic hierarchy pro- cess and fuzzy comprehensive evaluation method to the research on the quantitative evaluation model of user experience of mobile reading appli- cations, and Wu et al. (2018) proposed a “user-oriented” design evaluation index establishment method for the research of smart home appliances. Yang (2021) preliminarily established a user experience evaluation system based on mobile terminals from five evaluation dimensions, including sensory experi- ence, functional experience, content experience, interactive experience and emotional experience, and 17 subdivided evaluation indexes.
However, in practical application, there is a lack of a more efficient and systematic user evaluation system as the basis for decision-making and implementation, and the user experience of existing smart home products is focused on single products, which cannot fully reflect the user’s experience level in the entire home scene, so it is urgent to establish an evaluation sys- tem that can cover the whole category of smart home products. Therefore, based on the overall evaluation of smart home products, this paper creates a dynamic index system that meets the needs of different users and is suitable for different scenarios from the perspectives of different users, so as to more accurately reflect the needs of users.
BUILD A FRAMEWORK FOR THE UX EVALUATION SYSTEM OF SMART HOME PRODUCTS The smart home domain consists of hardware (appliances, furniture, cabi- nets), software (smart screen, voice, APP) and space (motion, light, sound). For all of the above products to do a evaluation system, not universal and inefficient. We have invented a new benchmarking methodology called the “Three Industries” benchmarking method, which involves business indus- try and professional industry determining the evaluation system indexes and methods for our industry. Then look at the specific metrics for the top busi- nesses or organizations in the industry in the hardware domain, software domain and space domain. The selection principle is that the company or organization’s products have unquestionable impact in terms of experience. For hardware, Panasonic of Japan was selected, for software, Huawei, and for space, the International WELL School of Architecture.
From these three companies, it can be seen that the principle of splitting the segmentation indexes is based on cognitive psychology, receiving information through the visual, auditory and tactile senses, processing the information
through the brain, and then responding through the body and language. So the index splices basic human five senses to start, get more suitable for the smart family 7 indexes: Vision, Hearing, Tactile sensation, Body reach, Understanding, Safety, Accessible space, to form a complete closed loop.
Table 2. User experience indexes for companies in various sectors.
Table available in the original PDF paper.
Field Corporations Group Indexes Hardware Panasonic Healthy Population Visual Emotional, Easy to Understand, Accessible Comfortable, Safe, Unencumbered Special Population Easy-to-understand cues and expressions, effortless movements and postures, easy-to-understand interactions, peace of mind, safe, accessible, easy-to-move spaces Software HUAWEI Healthy Population Easy to understand, easy to learn, easy to follow, attractive Special Population Perceptible, actionable, understandable, consistent Space WELL Healthy Population Physical health, mental health comfort, social health Special Population Physical health, mental health comfort, social health
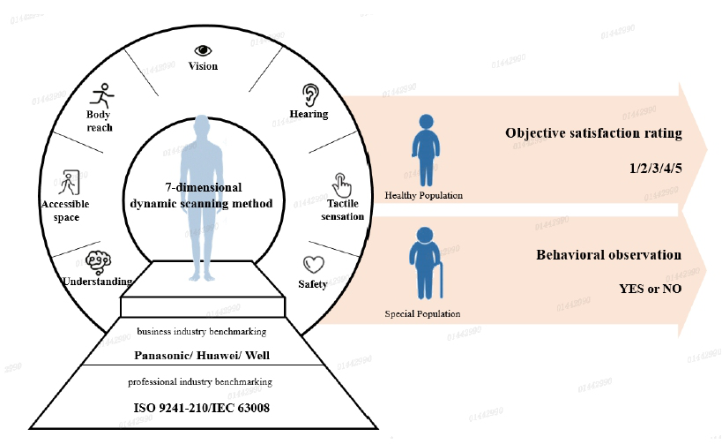
After business industry benchmarking, professional industry integration with international standards. the choice is the international standard of user experience “ISO 9241-210:2019 Ergonomics of human-system inter- action Part 210: Human-centred design for interactive systems” and home appliances. IEC 63008–2020 Household and similar electrical appliances - Accessibility of control elements, doors, lids, drawers and handles” for accessibility. The criteria for healthy users are effectiveness, efficiency and satisfaction, while the criteria for special users are completion or non- completion, as derived from the international standards. That is to say, the standard for special populations is successful completion (effectiveness, efficiency), while the healthy user is a higher level, to achieve subjective sat- isfaction. So both groups of people use 7 indexes, but the evaluation criteria are different. The healthy population should use objective satisfaction scor- ing method and commonly used five level Likert scale; And special groups use behavioral observation to see if the task is completed. This forms the “7-dimensional scanning dynamic scanning method” (see Figure 1). Univer- sal hardware, software, and space are available; It can also be used for both healthy and special populations.
Note: In the future, when the product develops to a better extent, the standards for special groups will also be upgraded from completion to satisfaction.
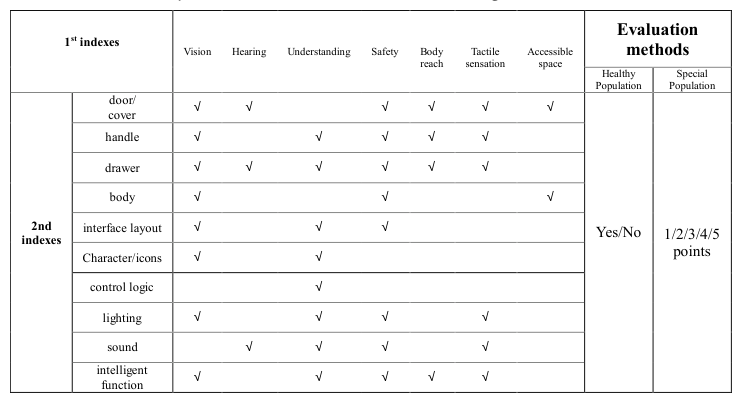
At the same time, by analyzing the structure of existing smart home products, we have summarized the 10 most universal product touchpoints: door/cover, handle, drawer, body, interface layout, character icons, con- trol logic, lighting, sound, and intelligent functions. By crossing the 7 user experience indexes obtained in the previous text, 41 secondary indexes were obtained. Finally, obtain an evaluation system for the corresponding category. Taking the washing machine as an example, the user experience evaluation model is shown in Table 4.
Table 3. The user experience evaluation model of washing machine.
Differentiate and adjust the standard line for different user groups. For different groups of users, set different excellent and bottom lines. Due to cost considerations for the enterprise, 10 people will be recruited for each project as the testing personnel. According to authoritative confidence interval data (for the system), 10 people can identify at least 83% of issues. And according to my smart home products, there won’t be too many problems compared to complex computer systems. 10 people are enough to discover all the prob- lems, and experience shows that the types of problems discovered are usually saturated by the 5th to 6th person.
Healthy population-objective satisfaction scoring method, combined with professional testing equipment such as eye tracking devices, pressure sensors, facial expression analysis systems, etc.
Excellent line: The satisfaction score of the indicator is higher than that of industry competitors. Such indicators can be used as selling points for market experience promotion.
Bottom line: It’s not just about scores, but about the detection rate of indicator problems. The following problems are considered as one prob- lem discovery: x scores below 4 points; y The user did not complete the task; z The user takes more than three times the proficient time to com- plete the task; { The device indicators are abnormal. A problem detection rate below 20% is considered a low priority problem, 20%–50% is con- sidered a medium priority problem, and more than 50% is considered a high priority problem, which means that 6 out of 10 people have prob- lems. High priority issues are recommended to be rectified before listing, while medium and low priority issues are not mandatory to be rectified.
Note: In the business field, a confidence interval of 80% is sufficient. On this basis, 0 out of 10 people are required to complete the task, which can ensure a user success rate of 92.1%. If 1 person fails to complete the task, the success rate can be guaranteed to be 78.8%. But here we do not empha- size that the product should be flawless in use, as perfect products do not exist. It is sufficient to ensure that the product will not cause negative mar- ket experience and reputation. Based on nearly 50 tests and comparison with market reputation system data, half of the users will have problems before corresponding negative experience data appears on the market. Therefore, for high priority issues greater than 50%, it is recommended to rectify them before they can be launched.
Special population - behavior observation method, to see if the task is completed.
Excellent line: The task completion rate of the indicator is higher than that of industry competitors.
Bottom line: When the task completion rate is less than 80%, the item does not pass the test. If there are 10 testers, that is, 3 out of 10 people who have not completed the task will be considered as failing the indicator. Incomplete tasks include not only task failures, but also users who spend more than three times their proficient time completing tasks.
The Construction Method and Application 297
DYNAMIC OPTIMIZATION OF USER EXPERIENCE EVALUATION SYSTEM Implement dynamic monitoring of indicator content on a quarterly basis. Update the key indicators for each category based on the three dimensions of new indicators, user usage rates for various functions (user touchpoints), and word-of-mouth complaint rates to ensure timely updates of the indicator sys- tem and dynamic accuracy of test results. For example, in recent years, more and more users have placed products on balconies, and the lighting has caused the screen to be unclear; Or in order to pursue an integrated appearance, new materials are used as interface carriers, making the interface increas- ingly unclear and the problem of visualization increasing. So, using interface visibility as a key experience indicator to ensure the long-term effectiveness of the evaluation system and improve the timeliness of evaluation results.
Table 4. Example of keywords imported from HVOC system.
Table available in the original PDF paper.
Index The user’s original words keyword Visibility The operation panel is too dark to see the screen clearly.
The brightness of the index light is low and the visibility is poor Poor visibility of the keys The brightness of the panel is low and the visibility is poor
It means that the power button is not clear, every time you have to grope to press, you need to press it several times to turn it on, last year I bought the machine, and I am not satisfied with the quality The screen is invisible The standby button of the range hood is not clear Audibility The tone is a bit loud, but acceptable Loud The button does not respond loudly, saying that there is a problem with the product quality, contact the door-to-door inspection, if it is Healthy, open a product Healthy quality inspection order Accessibility If you can’t get the range hood oil box, there may be a problem and you need the master to take a look
The installation position of the machine does not conform to the personal body size and usage habits The position of the part is not reasonable
The customer reported that the master was unqualified in installation, and the installation was too high for himself, and he couldn’t use it at all, so he asked for free on-site adjustment The new machine of the range hood is newly purchased and installed, and the customer feedback is too short, blocking the arm, and the after-sales solution needs to be solved to contact the customer Understandability The range hood always has a prompt sound, what’s going on
The prompt sound is not easy to understand Poor comprehension of func- tional text descriptions Icons are not easy to understand
The master needs to come to guide the use, which means that the manual does not understand and needs to come to the door This display is incomprehensible Consult the self-cleaning function on the range hood, and what other icons mean, the user can not provide the machine model, you can take a picture to the staff to see The user enters the line to reflect, what does hot melt wash mean
(Continued)
Table 4. Continued Index The user’s original words keyword
Table available in the original PDF paper.
Peace of mind and safety
The range hood is loud Loud noise The contact surface is not smooth, and there is a psychological burden of injury The new machine is running noisy, and it is required to be compensated The glass cooktop is unevenly polished, scratching hands, worried that it will fry the board Feedback The knob on the right is quiet, and the experience is poor
The switch feedback is quiet The switch is struggling Other faults are difficult to turn the ignition knob, but it can be used for ignition. The ignition is difficult, and it often fails to hit many times. Replacement. The two stoves are not easy to ignite, and there is no response for a long time, and there is a banging sound for a long time Movable space The sanitizer drawers are hard to pull out The drawer doesn’t pull smoothly Slippery slide
APPLICATION CASES Case1: The washing machine market feeds back new problems and updates the test indexes.
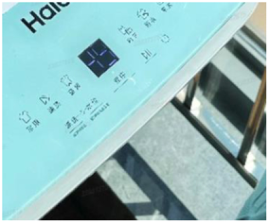
Through the HVOC word-of-mouth system, it was found that 22.3% of users mentioned the problem that the balcony scene could not see the inter- face clearly, so the test items of balcony visibility were added to the evaluation system.
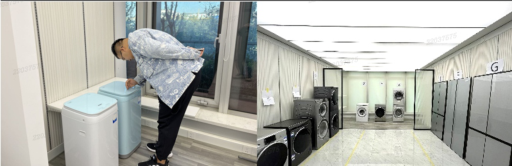
Figure 2: User complains about the scene.
In order to ensure the wide representativeness of the sample, 30 users were randomly selected according to the statistical principle of sample equilib- rium, and the users were divided into 15 males and 15 females, including 15 ordinary users aged 30–55 and 15 elderly users aged 60–70. At the same time, the layout of the environment and the site takes into account the influencing factors from various angles, simulates the scene of the family balcony, and places the products here, simulates the environmental illumination in different scenarios, for example, the illumination value of the outdoor is 10000 lx on a cloudy day, and the color temperature of the
The Construction Method and Application 299
noon sun is 4500∼5500K, in which the illuminance measurement position is 0.75 meters above the ground, vertically upward. Simulating the reflection of sunlight through the point light source, the irradiation angle is 45
with the horizontal plane and 45
with the product in the opposite direction, the irradiation range covers all the operation interfaces, the brightness and color temperature are 30W, and the illuminance and color temperature meet the requirements of ambient lighting.
Figure 3: Test environment.
Before the experiment begins, the host explains the precautions and exper- imental procedures to the subjects, and then conducts equipment debugging to prepare for the start of the experiment. Design tasks based on test- ing requirements for participants to operate the product according to the script. The required collection indicators include problem discovery rate, task completion rate, and subjective rating.
Table 5. Evaluation results.
Table available in the original PDF paper.
Illuminance in different scenes Satisfaction rating Problem discovery rate Below 100lx 4.35 0 1000lx 3.98 66.67% 10000lx 3.15 93.33%
The test found that the problem detection rate was greater than 50% for both 1000lx and 10000lx, so rectification is needed. Based on the test results, optimize the product interface and compare it with competitors to determine whether it meets this indicator. The testers and testing process are relatively consistent with the previous testing.
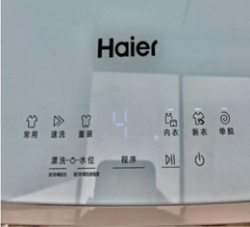
Figure 4: Original product.Figure 5: Product after optimization.Table 6. Evaluation results.
Table available in the original PDF paper.
Illuminance in different scenes After optimization Satisfaction rating
After optimization Problem discovery rate Below 100lx 4.51 0 1000lx 4.35 0 20000∼50000lx 3.98 93.33%
The test found that the problem detection rate under three different light- ing conditions was not greater than 50%, so it passed. After the optimized product was launched, the user complaint rate for displaying issues decreased from 22.3% to 3.4%. The experiment found that optimizing indicators based on word-of-mouth data has a positive effect on product experience testing, which can effectively avoid user complaints after the product is launched. The satisfaction level of the products optimized based on the indicator results has increased, and the optimization effect of the indicators is good.
Case 2: Evaluation criteria for elderly users (special groups). Due to changes in physical functions and cognitive abilities, elderly users have special needs for home appliances. Therefore, in terms of user experience testing, the evaluation criteria for elderly users should be easy for a healthy population. Based on the evaluation criteria mentioned earlier, we conducted tests on 6 categories of products and their key indicators, and compared them with competitors to verify the feasibility of the current evaluation system.
In order to ensure the wide representativeness of the sample, 30 users were randomly selected according to the statistical principle of sample balance. The users were divided into 15 males and 15 females; The users are all elderly users aged 60–70.
Through aging tests on various categories of products, it was found that except for refrigerators, the test results of other categories were basically consistent with the word-of-mouth evaluation, indicating that the evaluation indicators and standards designed in this article for the elderly have certain feasibility, which can help enterprises verify the aging degree of products.
The Construction Method and Application 301
Table 7. Evaluation results.
Table available in the original PDF paper.
Indexes Sample1 Sample1
Type 1 Product Indicator completion rate of “body reach” 4/10 6/10 Word of mouth complaint rate 10.25% 10.17%
Type 2 Product Indicator completion rate of “body reach” 5/10 3/10 Word of mouth complaint rate 7.45% 7.89%
Type 3 Product Indicator completion rate of “body reach” 5/10 8/10 Word of mouth complaint rate 9.79% 9.56%
Type 4 Product Indicator completion rate of “body reach” 3/10 7/10 Word of mouth complaint rate 4.21% 3.98%
Type 5 Product Indicator completion rate of “body reach” 8/10 6/10 Word of mouth complaint rate 2.67%% 3.16%
Type 6 Product Indicator completion rate of “body reach” 7/10 5/10 Word of mouth complaint rate 3.81% 4.69%
CONCLUSION
From the above three cases, it can be seen that the dynamic user experience evaluation system of this smart home product can effectively help to find out the product experience problems, and the problems found highly coin- cide with the real complaints of the actual users. The dynamic correction of the evaluation system by the Hvoc IWOM system can effectively ensure the applicability of the evaluation system, which can effectively guarantee the user experience level of smart home products.
FUTURE DIRECTION The current indicator system is designed to evaluate individual indicators, identify problems, and form selling points. But the next step is to obtain the overall evaluation result, which requires assigning weights to each indicator and evaluating the total score for two groups of people respectively, to help evaluate the product’s experience level in the entire industry.
REFERENCES
Cao, Z. et al. (2012). Study on Interactive Design of Smart Home Appliances.
Shenyang Aerospace University. Website: https://cdmd.cnki.com.cn/Article/CDM D-10143-1012317078.htm. Jung, W. C. (2022). Investigating the User Experience and Identifying User Needs for Kitchen Appliances Using Thematic Analysis. Website: https://ieeexplore.ieee.org/ document/9989926. Liang, L., Xu, C., & Lin, S. (2015). A Study on the Construction of a Quantitative
Evaluation Model for User Experience in Mobile Reading Applications. Deco- ration, (6), 124–125. Website: https://www.cnki.com.cn/Article/CJFDTOTAL-SH I201506049.htm. Li, Y., & Jia, J. (2017). Analysis of the Trend of User Psychological Needs in Smart Home Appliances. Packaging Engineering, 38(4), 108–111. Website: https://ww w.cnki.com.cn/Article/CJFDTOTAL-BZGC201704025.htm. Munawar, Z., Suryana, N., Sa’aya, Z. B., & Herdiana, Y. (2020). Framework With
An Approach To The User As An Evaluation For The Recommender Systems. In 2020 Fifth International Conference on Informatics and Computing (ICIC) (pp. 1–5). Gorontalo, Indonesia: IEEE. doi: 10.1109/ICIC50835.2020.9288565. Wu, G. (2018). Research on the Evaluation System of Intelligent Home Appliance Product Design [智能家电产品设计评价体系研究]. Southwest University of Sci- ence and Technology. Website: https://cdmd.cnki.com.cn/Article/CDMD-10619- 1018199902.htm. Yang, S. (2021). Research on User Experience Evaluation of Smart Small Home
Appliances Based on Mobile End [基于移动端的智能小家电用户体验评价 研究]. Jiangnan University. Website: https://cdmd.cnki.com.cn/Article/CDMD- 10295-1021757460.htm. Zhou, C., Chen, M., & Wang, C. (2023). Research on Evaluation Indexes of Online Shopping App User Experience [线上购物APP用户体验评价指标研究]. Design, (07). Website: https://www.cnki.com.cn/Article/CJFDTOTAL-SJTY202307030. htm.
LISTED IN THE AHFE DIGITAL BOOKSTORE CATALOGUE
Explore the complete digital volume
Usability and User Experience
Read this individual research paper free through the original publisher, or explore the full digital proceedings book.
ISBN 978-1-964867-32-8
Explore this ISBN in the AHFE Bookstore ↗Listed in the July 2026 bookstore catalogue; search by ISBN to confirm current availability · Digital book purchase optional