Yurina Koyama, Yusaku Okada (2025). Method to measure the effectiveness of new technologies that contribute to reducing damage from natural disasters. In: Safety Management and Human Factors. AHFE Open Access, vol. 189, pp. 1–12. https://doi.org/10.54941/ahfe1006565
Natural disasters pose various challenges to the national land. While various technological innovations have contributed to overcoming these difficulties, there are still many problems that need to be solved to play a preventive role. A framework is needed to examine social design proposals that promote the production of technology. However, in order to implement such an idea in society, a new business model based on non-monetary value and reputation must be developed to address various social issues, including not only disaster prevention but also maintenance and management of social infrastructure and green infrastructure, including agriculture. This research is therefore focused on the concept of adaptive finance, which is a practical approach to finance for adaptation. Therefore, the purpose of this study was to organize basic data and visualize the characteristics of new technologies in order to put the concept of adaptive finance into practice. We examined ways to visualize the effects of new technologies based on a database of new technologies (domestic open data) that have been developed for the maintenance and management of social infrastructure and for disaster prevention and mitigation. In addition, we developed an index to quantitatively evaluate the degree of damage reduction. By doing so, we aimed to clarify how the introduction of new technologies contributes to disaster prevention and mitigation, and to promote their application to actual disaster prevention policies. For this visualization, we used generative AI to create an index based on various technological data. The results of this research will support policy makers, local governments, and private companies in their decisions to introduce disaster prevention technologies and contribute to minimizing disaster damage in the future.
The frequency and scale of natural disasters have increased with global warming and urbanization. A wide variety of disasters, including typhoons, floods, earthquakes, tsunamis, and landslides, have occurred around the world, causing loss of life and economic damage. Japan, in particular, is located in the path of earthquake zones and typhoons, making it an extremely high-risk region for natural disasters; in the 2011 Great East
Japan Earthquake, a huge tsunami devastated many municipalities, causing an estimated economic loss of 16.9 trillion yen (Cabinet Office, 2016). In addition, the 2018 torrential rains in western Japan caused major damage, with rivers overflowing and landslides in many areas and more than 200 deaths reported (Japan Meteorological Agency, 2018). To minimize such damage, in addition to conventional disaster prevention measures such as infrastructure development and hazard mapping, active use of new technologies is essential (UNDRR, 2015). Improving the accuracy of disaster forecasting using remote sensing technology and AI and rapidly collecting disaster damage information using drones and IoT have attracted attention as innovative technologies in the field of disaster prevention and mitigation (Matsuoka & Yamazaki, 2004). However, methods to properly measure the effectiveness of these new technologies have not yet been fully established (Aven, 2016). Conventional evaluation methods for disaster prevention measures have generally taken the approach of comparing the degree of damage reduction based on past disaster data (Aven, 2016). However, new technologies have immediate and indirect effects, such as improved forecasting accuracy and faster information dissemination, making it difficult to adequately evaluate them using conventional methods.
To address these issues, this study aims to propose a new evaluation method that incorporates the concept of adaptive finance and to organize the basic data for this method. Furthermore, it aims to visually visualize the characteristics of new technologies and provide guidelines for policy makers and technology developers to facilitate their decision making in the field of disaster management (Helgeson, 2015).
METHOD
Subject The effectiveness measurement method will be limited to “earthquakes” among natural disasters.
There are a wide variety of natural disasters, including earthquakes, tsunamis, typhoons, torrential rains, floods, landslides, volcanic eruptions, snow storms, and droughts. Each type of disaster has a different occurrence mechanism, impact area, and damage characteristics, and the evaluation methods differ greatly from one disaster to another. Because of these differences, we decided to limit our research to the evaluation of natural disasters related to earthquake disasters, and to examine how to measure the effectiveness of new technologies in mitigating the damage.
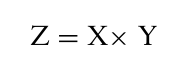
Basic Formula for Technical Evaluation We aim to express the final evaluation Z of the technology by the following equation
Equation reproduced from the original PDF.
X is an indicator of the effectiveness of the technology and expresses the effect of reducing damage caused by natural disasters in terms of monetary
Method to Measure the Effectiveness of New Technologies 3
value. For example, the reduction in construction costs and carbon dioxide reduction from tunnel collapse will be converted into monetary credits. More specific calculation formulas will be considered in the future. Hallegatte & Przyluski (2010) proposed a concept and methodology for converting the economic impacts of natural disasters into monetary values. Freeman et al. (2003) describe a method for considering the impact of natural disasters in development planning. Based on the above, we plan to develop more specific formulas in the future.
Y is an indicator of the degree of implementation of the technology. In this project, we will create an equation to determine this Y.
Based on this configuration, we aim to develop an evaluation model for Z to realize an effectiveness measurement method that can quantitatively evaluate the extent to which new technologies contribute to the mitigation of earthquake damage.
In addition, data on the technical accuracy and exit strategies of 35 new technologies in a project were evaluated by experts in the civil engineering field and were used as supervised data.
Evaluation Items Damage Items It was decided to determine what kind of damage the new technology would contribute to reducing. In addition, we decided to utilize existing public survey data in order to construct an objective index to comprehensively assess the damage caused by earthquakes. We utilized the data “List of Damage Assumption Items”, which was discussed in the “Expert Committee on Earthquake and Tsunami Countermeasures Based on Lessons Learned from the Tohoku Earthquake (7th Meeting)” organized by the Cabinet Office, and extracted the relevant items for this technical evaluation. For simplification of the evaluation, damage items were replaced with letters (Table 1).
Table 1: Correspondence table of evaluation items and damage items.
Table available in the original PDF paper.
Evolutive Item Damage Classification Damage Items A Building Damage Damage caused by liquefaction B Damage caused by the collapse of steep
slopes C Residential land development D Damage caused by the tsunami E Earthquakeand fire Fires F Falls, Fallingobjects, Collapse of block walls, vending machines,
etc.
etc. G Falling objects outdoors H Earthquake waste Debris (earthquake waste) I Human casualties Shifting and falling objects stored indoors, objects falling indoors J Collapse of steep slopes K Damage caused by landslides and
large-scale collapses Continued
4 Koyama and Okada
Table 1: Continued Evolutive Item Damage Classification Damage Items
Table available in the original PDF paper.
L Collapse of block walls, etc., objects falling outdoors M Damage caused to people who require
assistance during disasters N People unable to escape on their own (those needing rescue) O Transportation Roads (highways, general roads)
facilities
P Railways Q Ports R Airports and heliports S Closures on narrow streets
Range In evaluating new technologies that contribute to the mitigation of earthquake damage, we classified the extent to which they affect two categories: “local” and “broad”. For simplicity of evaluation, the ranges werereplaced with letters (Table 2).
Table 2: Correspondence table of evaluation items and scope.
Table available in the original PDF paper.
Evolutive Item Range T Local U Broad
The Subject of the Technology Topographic classification information provided by the Geospatial Information Authority of Japan was used for the subject of the technology. Topographic classification is a classification of landforms based on their form, origin, and nature, and is the basic data for understanding the characteristics of land in detail. For simplification of the evaluation, the technology targets were replaced with letters (Table 3).
Table 3: Correspondence table between evaluation items and technology targets.
Table available in the original PDF paper.
Evolutive Item Technology Objectives V Mountain slopes,
etc. W Deformed land (Cliffs, Landslide terrain) X General surfaces of
lowlands
Continued
Method to Measure the Effectiveness of New Technologies 5
Table 3: Continued Evolutive Item Technology
Table available in the original PDF paper.
Objectives Y Frequently flooded landforms Z Water areas AA Artificial
landforms AB Highway AC General road AD Bridge AE Tunnel Highway AF General road AD Bridge AG Airports AH Ports and harbors
Scale For the scale, evaluation items were created for “one unit in a region,” “one unit in a cooperative region,” and “several units in a country [for large-scale disasters]. The scale of “one unit in a region” covers technologies that are operated by municipalities and local governments. In this scale of evaluation, emphasis is placed on the following aspects: operational feasibility within the municipality’s budget, burden of maintenance and management, and degree of impact on residents. Next, the scale of “one unit in a cooperative region” covers technologies that are introduced in multiple municipalities or prefectural units. Finally, the scale of “several units in a country (for large- scale disasters)” is for technologies that are intended for disaster prevention measures at the national level. For simplicity of evaluation, the scale was replaced with letters (Table 4).
Table 4: Correspondence table between evaluation items and scale.
Table available in the original PDF paper.
Evolutive Scale Item AI One unit in the region AJ One unit in a cooperative region AK Several units in the country [for large-scale disasters
Frequency Three standards were established: “routine inspection and maintenance,” “periodic inspection, maintenance, and repair,” and “disaster inspection and infrastructure triage assumptions. Daily inspections and maintenance” refer to inspections and equipment maintenance that are carried out continuously under normal circumstances and are mainly carried out by local governments and infrastructure managers. Periodic inspections, maintenance, and repairs” include large-scale inspections and repairs carried out on an annual basis or based on specific standards. Disaster inspections and infrastructure triage
6 Koyama and Okada
assumptions” refer to emergency responses immediately after an earthquake to quickly assess damage and determine which infrastructure should be restored on a priority basis. For simplicity of evaluation, the frequency of use was replaced with letters (Table 5).
Table 5: Correspondence table of assessment items and frequencies.
Table available in the original PDF paper.
Evolutive Frequency Item AL Daily inspection, maintenance AM Routine inspections, maintenance, and repairs AN Disaster inspections, Infrastructure triage
assumptions
Technical Maintenance To evaluate the burden of maintenance during installation and operation, the following four perspectives were used: “simple, periodic replacement,” “periodic maintenance (can be handled by general contractors),” “periodic maintenance (can be handled only by special contractors),” and “special maintenance. Convenient, periodic replacement” refers to parts and systems that can be replaced after use with simple work and can be handled quickly and at low cost. Periodic maintenance (can be handled by general contractors)” refers to items that require periodic inspection and repair but do not require special skills and can be handled by general contractors. Routine maintenance (which can be handled only by special contractors)” refers to equipment and systems that can be handled only by contractors with specialized skills, which may pose challenges in terms of cost and response time. Specialized maintenance” requires advanced technology and maintenance by a specific manufacturer, which imposes a heavy burden for repair. Comprehensive evaluation is made on the practicality of new technology and the feasibility of long-term operation. For simplicity of evaluation, technical maintenance is addressed as Ichi-Yon (Table 6).
Table 6: Correspondence table between evaluation items and technical maintenance.
Table available in the original PDF paper.
Evolutive Technical Maintenance Item AO Simplified, periodic replacement AP Routine maintenance (can be handled by general
contractors) AQ Special maintenance
Technology Features The characteristics of the technology were evaluated in terms of safety, simplicity, quality, and efficiency. Experts were asked to complete a questionnaire and scored ⊚as 4, 0 as 3, 1 as 2.5, and × as 0.
Method to Measure the Effectiveness of New Technologies 7
Evaluation Results A principal component analysis of the evaluation criteria was performed. From the principal component loadings, a name was determined that reflects each of the characteristics. Principal Component 1 is “Complex infrastructure damage over a wide area”. Principal component 2 is “disaster risk specific to waterfront and lowlands Principal Component 3 is “infrastructure maintenance and restoration in the event of a large-scale disaster. By utilizing these evaluation axes, the impact of earthquake damage will be appropriately classified and analysed.
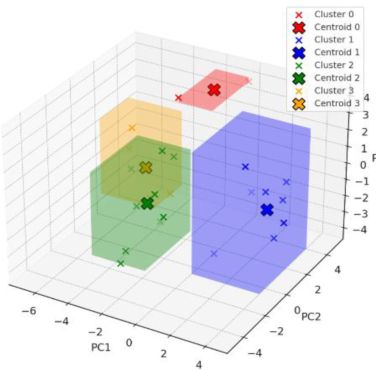
The new technology was then clustered. This clustering was done using the K-means method (Figure 1).
Figure 1: Results of clustering of new technologies and cluster range.
Each cluster is named after the characteristics of each cluster. Cluster0: “Stable high-performance zone” PC1: Has strengths in localized applications with a narrow range of application. PC2: A technology with wide applicability that can flexibly adapt to the environment and situation. PC3: Has high disaster response capabilities and has stable and high damage reduction capabilities. Cluster1: “Flexible and high-scale technology” PC1: Has a wide range of application and can be used in large areas. PC2: Can be applied in a wide range of situations and can be flexibly adapted. PC3: Has a wide range of damage response capabilities and enables flexible scale response. Cluster2: “Specialized disaster resistance technology” PC1: Shows a very narrow range of application PC2: Applicable situations are limited, and strengths are demonstrated under specific conditions. PC3: Disaster response capabilities are within a medium range and performance is focused on specific disasters. Cluster3: “Wide-range, highly durable technology” PC1: Has overall response capabilities over a wide range. PC2: Has a relatively wide range of application and can be used in a variety of conditions. PC3: Has medium disaster response capabilities and ensures a certain degree of stability.
8 Koyama and Okada
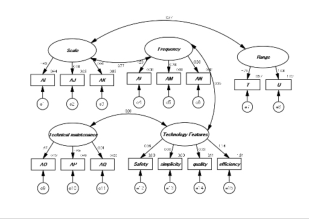
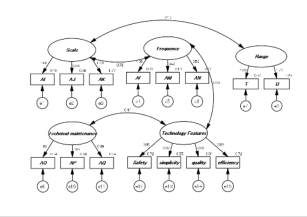
SEM (Structural Equation Modelling) Analysis Based on the supervised data, 35 technologies were divided into two groups and SEM analysis was performed as bad and good technologies (Figures 2 and 3).
Figure 2: Bad technology SEM.Figure 3: Good technology SEM.
It can be read that the relationship between technology x technical maintenance is strong. Therefore, we believe that including the characteristics of technology x technical maintenance in the evaluation will make it easier to express the characteristics in creating the evaluation formula. Also, it can be read that good technology has technology →safety (0.85), simplicity (0.92), and efficiency (0.72), indicating that technology has a strong influence on these items, whereas bad technology has a small path coefficient, indicating that technology does not have a sufficient influence on the evaluation items.
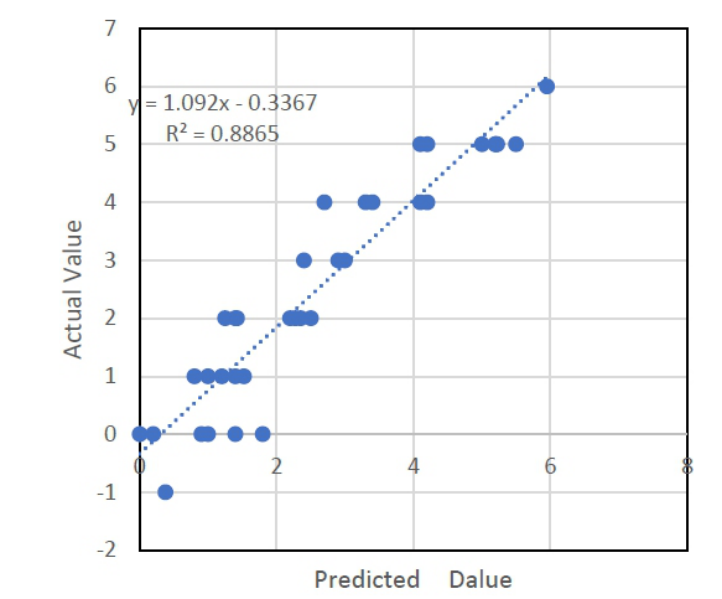
Proposal of Model Equation As the degree of implementation, the teacher data is shown as A+ = 6, A = 5, B+ = 4. B = 3, B−= 2, C = 1, D = 0, E = −1 and the modelling is done.
The following model equation is proposed. Y = 0.8 + (0.5∗simplicity∗efficiency) + (−0.3∗M∗simplicity) + (−0.5∗ D ∗simplicity) + (−0.5 × simplicity2) + (0.3 ∗AQ ∗quality) + (0.4 ∗AP ∗ efficiency) + (1.0∗P∗AN) + (0.4∗P∗quality) + (−0.2∗C∗quality + (−1.1∗ F ∗AP) + (1.0 ∗D ∗AP) + (0.4 ∗AM ∗AP) + (−0.6 ∗F ∗quality) + (0.9 ∗R ∗
Method to Measure the Effectiveness of New Technologies 9
AM) + (0.7∗F∗simplicity) + (0.6∗G∗efficiency) + (0.6∗B∗AN) + (−0.6∗ C∗AQ) + (−0.2∗P∗efficiency) + (−0.6∗I∗AQ) + (−0.3∗B∗AM) + (0.9∗ K ∗quality) + (−1.3 ∗H ∗AP) + (−0.2 ∗D ∗efficiency) The coefficient of determination, R2 = 0.8865, is considered valid when compared to the teacher data.
Figure 4: Comparative study of predicted values and actual values.
The meaning of the interactions and terms are explained below (Table 7).
Table 7: Meaning of the formation of terms in the model equation.
Table available in the original PDF paper.
Term Meaning
1 The basic standard for evaluating the degree of implementation of a
technology. Using this as a standard, the evaluation will fluctuate depending on individual performance and responsiveness. 2 Technology with high simplicity and efficiency is easier to operate, and its implementation in the field is promoted. When both are high, a synergistic effect is generated. 3 The degree of implementation of technologies for disaster relief efforts
will decline because overly simple structures may not be able to respond, and complexity may be necessary. 4 If the simplicity is too high in tsunami countermeasure technology, it will not be effective enough and reliability will decrease.
Continued
10 Koyama and Okada
Table 7: Continued Term Meaning
Table available in the original PDF paper.
5 If the simplicity is too high, the effectiveness and durability may be low,
and this is a factor that reduces the degree of implementation. 6 If quality is high even when special maintenance is required, stable operation can be achieved, and the degree of implementation will increase. 7 If the maintenance can be handled by general contractors and is highly
efficient, it is easy to manage, and implementation will increase. 8 Disaster inspections of railroads are essential, and the level of implementation of the technology is highly evaluated. 9 If the quality of railway-related technology is high, reliability during
disasters will improve and implementation will increase. 10 In built-up areas, high quality increases costs, making implementation more difficult. 11 If periodic maintenance is required for technologies to prevent rock
walls and vending machines from toppling over, maintenance will become more complicated, and implementation will decline. 12 If periodic maintenance is possible for tsunami prevention technology, its reliability will improve, and its implementation will be promoted. 13 If a technology requires periodic inspections and can be handled by
general contractors, its introduction is likely to be promoted. 14 If the quality of the technology for preventing rock walls from tipping over is high, costs will increase, and introduction will be difficult. 15 Periodic inspections at airports are important, and the level of
implementation of the technology is highly valued. 16 Technology that can provide simple fall prevention measures will be more likely to be introduced. 17 Efficient outdoor fall countermeasure technology will lead to risk
reduction and increase the level of implementation. 18 Technology for dealing with steep slope failures that can be inspected during disasters will be implemented more frequently. 19 Technologies that require special maintenance are difficult to implement
and will be particularly undervalued in housing developments. 20 If railway-related technology is inefficient, the operational burden will increase and the level of implementation will decline. 21 If indoor falling object prevention technology requires special
maintenance, it will be difficult to maintain, and implementation will be less likely to proceed. 22 If periodic inspections for steep slope failure are complicated, the level of implementation will decline. 23 High-quality landslide prevention technology is highly reliable, and its
implementation will increase. 24 If periodic maintenance is required for earthquake waste treatment technology, it will be difficult to operate, and the level of implementation will be lowered. 25 If the tsunami countermeasure technology is inefficient, it is difficult to
manage, and implementation will be delayed.
Method to Measure the Effectiveness of New Technologies 11
Enhancing Evaluation Through Generative AI Integration Generative AI allows for the comprehensive analysis of diverse data sources, including historical disaster records, regional characteristics, and technology cost-effectiveness. This facilitates the objective evaluation of new technologies, enabling evidence-based recommendations for implementation priorities. For example, AI can assess disaster risk, fiscal constraints, and technological efficacy when a local government considers adopting earthquake mitigation technologies. Such outputs aid decision-making by aligning risk and financial resources, offering valuable support from an adaptive finance perspective.
CONCLUSION
This research aims to develop a method for measuring the effectiveness of new technologies in earthquake disasters, proposing a supervised data-based evaluation model. The model quantitatively assesses effectiveness through a mathematical framework incorporating technology features, implementation level, and maintainability. With a high coefficient of determination (R2 = 0.8865), the model demonstrates strong validity. Beyond effectiveness measurement, it is crucial to optimize technology adoption strategies by considering the innovation diffusion process (Rogers, 2003). Early adoption by policymakers and local governments is key to spreading disaster prevention technologies. Incorporating a disruptive innovation perspective (Christensen, 1997) is also vital for evaluating new technologies like AI-based earthquake prediction and drone-based damage assessment, which could transform existing infrastructure. The proposed model provides a flexible framework for assessing such innovations. Additionally, evaluation criteria should align with the growth and diffusion stages of technologies using a technology roadmap (Tidd & Bessant, 2025), enabling strategic policy recommendations from a long-term perspective.
Future research should apply the model to other natural disasters, such as floods, typhoons, and tsunamis, to verify its versatility. Collecting empirical data and improving the model’s accuracy will help develop a practical evaluation tool for policymakers and companies, promoting technology implementation and reducing disaster damage.
REFERENCES
Aven, T. (2016). Risk assessment and risk management: Review of recent advances on their foundation. European Journal of Operational Research, 253(1), 1–13. Cabinet Office, Government of Japan. (2016). Chapter 3, Section 6: Disaster
prevention and reduction initiatives. In 2016 White Paper on Disaster Management. Retrieved from https://www.bousai.go.jp/kaigirep/hakusho/h28/ho nbun/3b_6s_19_00.html. Christensen, C. M. (1997). The Innovator’s Dilemma: When New Technologies Cause Great Firms to Fail. Harvard Business Review Press. Freeman, P. K., Martin, L. A., Mechler, R., & Warner, K. (2003). Catastrophes and
Development: Integrating Natural Catastrophes into Development Planning. The World Bank.
12 Koyama and Okada
Geospatial Information Authority of Japan (GSI). (n.d.). Land Classification Configuration. Retrieved February 14, 2025, from https://www.gsi.go.jp/bousai chiri/lc_configuration.html. Hallegatte, S., & Przyluski, V. (2010). The Economics of Natural Disasters: Concepts and Methods. World Bank Policy Research Working Paper 5507. Helgeson, J., & Ellis, J. (2015). The role of the 2015 agreement in enhancing
adaptation to climate change. OECD/IEA Climate Change Expert Group Papers, No. 2015/01, OECD Publishing, Paris. https://doi.org/10.1787/5jrxg3xb0h20-en Intergovernmental Panel on Climate Change (IPCC). (2014). Climate change 2014: Impacts, adaptation, and vulnerability. Cambridge University Press. Japan Meteorological Agency. (2018, July 13). Heavy rain event of July 2018:
Report. Retrieved from https://www.data.jma.go.jp/stats/data/bosai/report/2018/ 20180713/20180713.html. Japan Science and Technology Agency (JST). (2022). Strategic Innovation Program (SIP) Technical Overview. Retrieved from https://www.jst.go.jp/sip/dl/k07/sip_ k07_souran.pdf. Matsuoka, M., & Yamazaki, F. (2004). Use of satellite SAR intensity imagery for
detecting building areas damaged due to earthquakes. Earthquake Spectra, 20(4), 975–994. Rogers, E. M. (2003). Diffusion of Innovations (5th ed.). Free Press. Tidd, J., & Bessant, J. R. (2025). Managing innovation: Integrating technological, market and organizational change (Eighth edition). Wiley. United Nations Office for Disaster Risk Reduction. (2015). Sendai Framework for
Disaster Risk Reduction 2015–2030. United Nations. Retrieved from https://ww w.undrr.org/publication/sendai-framework-disaster-risk-reduction-2015-2030.
LISTED IN THE AHFE DIGITAL BOOKSTORE CATALOGUE
Explore the complete digital volume
Safety Management and Human Factors
Read this individual research paper free through the original publisher, or explore the full digital proceedings book.
ISBN 978-1-964867-65-6
Explore this ISBN in the AHFE Bookstore ↗Listed in the July 2026 bookstore catalogue; search by ISBN to confirm current availability · Digital book purchase optional