Saki Akita, Yusaku Okada (2025). Prototype of a safety management support tool using the results of a safety activity awareness survey. In: Safety Management and Human Factors. AHFE Open Access, vol. 189, pp. 42–53. https://doi.org/10.54941/ahfe1006569
In recent years, enhanced safety management has been implemented in various sectors. In particular, it has been aimed at voluntarily evaluating the culture, awareness, and organization of safety on an ongoing basis with the cooperation of employees.Until now, the evaluation of motivation regarding safety activities has been carried out using a questionnaire-based survey method. However, it is difficult even for those with sufficient experience and skills in safety management to decipher the background of the collected results and future issues. For this reason, many companies ask experts and safety consultants to conduct assessments, but the reality is that they are not able to analyze the results down to the detailed departmental level due to the high cost involved. Therefore, the objective of this study was to develop a system that automatically indicates issues related to safety management and their solution policies by analyzing the results of an awareness survey on safety activities from various perspectives.Since 2007, this laboratory has conducted a total of 200,000 people at more than 70 businesses, and has data on their awareness of safety activities. These big data were processed using variance-covariance structural analysis to create a structured model of the influence of the questionnaire items. Based on this structural model, all survey data were multilayered. Furthermore, the relationship between the multilayered data and the past findings of the experts (assessment results) was formulated using machine learning (deep learning). Finally, we developed an application that implements the results obtained in this way. In other words, we developed a system that, upon inputting the results of an awareness survey on safety activities, outputs “Current issues regarding safety activities,” “Priorities for solving issues,” and “Advice for solving issues. The system was developed to output “current issues regarding safety activities,” “priorities for resolving issues,” and “advice for resolving issues.The system is now being used to examine the content of the “advice for on-site management” obtained from this system for the businesses that conducted the safety awareness survey in 2024 (approximately 15,000 subjects). In the future, we plan to have businesses in the railroad, manufacturing, IT service, and medical industries join the project to verify the validity of the system and to improve its practicality.
If there is insufficient understanding of safety activities, including countermeasures, at the site where safety and human error countermeasures are implemented, the countermeasures are more likely to become formalities. Human errors are more likely to occur if employees are not motivated to participate in safety activities. It is challenging to maintain high motivation among all frontline workers to engage in safety activities. Human error often seems less significant unless it directly affects the individual.
In safety management activities, on-site ‘safety awareness’ is one of the most important aspects. However, it is not the overall ‘safety awareness’ that the site supervisor should evaluate, but the depth of understanding and confidence in individual activities. The depth of understanding and confidence in various safety activities and approaches can provide valuable insights to improve the ‘safety awareness’ of the department. If the issue
is employee participation in safety management activities, education can be perceived as a mentality of ‘doing your best’ and ‘being positive’. This mindset can lead to the misidentification of problems such as ‘lack of feeling’ or ‘weak awareness’, which may contribute to human errors. Such analyses can demotivate workers, discourage them, and put them in situations where they are more prone to errors. This negative cycle can lead to departments being labelled as ‘error-prone’ or ‘error-prone teams’. In the construction industry, safety climate has been shown to strongly correlate with leadership and safety behaviours (Chen et al., 2021). Workplace safety can be perceived by employees as a time-based utility or value (Hantula et al., 2001). Safety culture factors and risk perception vary significantly depending on industry and organizational context (Kao et al., 2007). After major disasters, safety culture is increasingly seen not only as a managerial issue but also as an ethical concern (Kastenberg, 2015). Establishing a flow that allows for the accurate assessment of employees’ basic understanding of safety activities and human error, as well as their understanding of various safety management activities, is essential. Reviewing safety management activities based on these assessments can help revitalize overall safety management efforts. Research on safety culture and climate has shown a growing trend, with shifting thematic focus over time (Li and Hale, 2016). Improving process safety culture often benefits from using root cause analysis (Sutton, 2008). Additionally, a safe workplace can contribute to higher customer satisfaction (Willis et al., 2012). By understanding employees’ perceptions of human error and safety activities, safety management issues can be more effectively identified and addressed. This study aims to utilize data from the “Employee Understanding of Safety Activities Survey”, which has been conducted across various industries (e.g., railways, airlines, steel, heavy industry, medical, IT services, general contractors, etc.) since 2010, and to develop tools based on these findings.
MATERIALS
This study utilized a survey consisting of 55 items, organized into seven categories: (1) Basic Knowledge on Human Error, (2) On-site Atmosphere, (3) Check/Confirmation System, (4) Accident/Incident Reporting, (5) Recurrence Prevention Countermeasures, (6) Investigation of Latent Factors on Human Error, and (7) Strategic Safety Management (Tables 1 and 2). The 55 survey items used in this study are part of a validated and widely applied evaluation framework that has been developed and refined through a series of practical implementations (Yokomizo et al., 2009; Mori et al., 2006; Nakayama and Okada, 2006). The questionnaire has been continuously applied since 2010 in various industries such as railway, aviation, steel, heavy industry, healthcare, IT services, and construction. It was originally developed by the authors and has been refined through repeated implementation in practical settings, ensuring its validity and reliability. The dataset used in this study comprises responses from approximately 200,000 individuals across over 70 organizations, collected between 2007 and 2022.
44 Akita and Okada
Table 1: Survey items (basic knowledge on human error).
Table available in the original PDF paper.
Evaluation Category Survey Items Basic Knowledge Fundamental on Human Error Ideas on Human Factors
1 I think I don’t make human errors. 2 I think human errors occur because of low skills (ability). 3 When I make a human error, I would prefer to hide it if possible. 4 I think the cause of human errors is the fault of the person who made the error. 5 I think carelessness and absent-mindedness are the individual’s responsibility. 6 I think human errors can be eliminated through individual effort. 7 I think human error prevention measures should focus on developing people who do not make mistakes. 8 When I make a human error, I think it was just bad luck. 9 Writing human error or trouble reports is troublesome, so I only write the bare minimum necessary. 10 I don’t understand why I have to write reports for incidents that haven’t caused any trouble. 11 I don’t know that there is an academic field dedicated to studying human errors. 12 I have never attended a lecture or training on safety or human errors. 13 I think investigating human errors is a waste of time, and I would prefer not to do it. 14 I don’t understand the purpose of analyzing human errors. 15 I do not conduct cause analysis of human errors. 16 As long as recurrence prevention is in place, that is sufficient. 17 The current human error prevention activities are sufficient. 18 I am not interested in other companies’ human error prevention activities. 19 I think human error prevention activities should be considered and addressed individually. 20 There is no need to manage human errors at the organizational level.
Table 2: Survey items (6 categories).
Table available in the original PDF paper.
Evaluation Category Survey Items On-site An environment Atmosphere where individuals feel comfortable reporting incidents when trouble occurs 21 In your department, people who make human errors are sometimes scolded. 22 In your department, punishments are sometimes given for making errors. 23 In your department, there is a tendency to look down on people who make errors. 24 In your department, there is an atmosphere that makes it difficult to report human errors. 25 In your department, investigations into the causes of human errors and troubles tend to focus on assigning blame. Check/
Procedures and Confirmation System mechanisms for error prevention through systematic checks 26 I do not know that “Ensuring Transport Safety” includes not only transport safety but also customer safety. 27 In your department, the awareness of prioritizing safety has not taken root. 28 In your department, employees are unable to think and take action on their own in daily operations. 29 In your department, the concept of “Bad News First” is not well understood, implemented, or practiced. 30 In your department, psychological safety is low, and employees cannot freely express their opinions and thoughts.
Continued
Prototype of a Safety Management Support Tool 45
Table 2: Continued Evaluation Category Survey Items
Table available in the original PDF paper.
31 In your department, it is not easy to make suggestions to the department head, supervisors, or senior colleagues. 32 You are not familiar with the regulations that outline the “Basic Safety Policies.” 33 In your department, regular training on the “Basic Safety Policies” is not conducted. 34 In your department, the “Basic Safety Policies” and the “Code of Conduct for Officers and Employees Regarding Transport Safety” are not being practiced. 35 In your department, regulations, manuals, and checklists are not reviewed regularly, and continuous improvements are not being made. Accident/Incident Investigation and Reporting analysis of accident causes 36 In your department, trouble case analyses are sometimes conducted based only on the reports from those directly involved in the incident. 37 In your department, managers do not visit the site of the trouble to conduct investigations. 38 In your department, investigations focus only on the moment when the trouble occurred, without examining the workflow leading up to the incident. 39 In your department, the factors and background of human errors are not analyzed. 40 In your department, investigations focus only on direct causes, without examining indirect or latent causes. Recurrence
Measures to Prevention Countermeasures prevent the recurrence of incidents 41 In your department, human error countermeasures sometimes consist only of the reflection of those involved in the trouble. 42 In your department, countermeasures focus on raising awareness, including that of the individuals involved and the entire department. 43 In your department, countermeasures are not planned according to the background of human errors. 44 In your department, statistical analysis of trends and characteristics of trouble occurrences is not conducted. 45 In your department, countermeasures from other companies are not used as a reference. Investigation of
Proactive Latent Factors on Human Error measures, including near-miss incident reporting and minor event prevention 46 I do not know that there is a department responsible for providing guidance on trouble countermeasures in my department. 47 In your department, near-miss incidents are not being accurately collected. 48 In your department, training sessions, including those on human errors, are not conducted regularly. 49 In your department, human error education is not provided to both managers and frontline workers. 50 In your department, information on incidents, near-misses, and their countermeasures is not being shared. Strategic Safety
Organizational- Management level framework for preventing human errors 51 Not all managers in your department have adequate knowledge of human error management. 52 In your department, information on human error prevention activities from other companies in the same industry or different industries is not being collected. 53 I do not know that there are external connections where advice on human error management can be obtained. 54 In your department, risks related to human errors are not being accurately assessed. 55 In your department, the concept of human error management has not been widely adopted.
46 Akita and Okada
METHOD
This study employed a multi-step analysis approach to develop a system that automatically classifies organizational safety awareness levels and generates appropriate feedback.
First, among the 55 items, five core categories excluding “Basic Knowledge” and “Check/Confirmation” were selected for analysis. For each category, a cluster analysis was performed on the normalized distribution of five response options (ranging from 1 to 5). The clustering process was adjusted to maintain even representation across departments and to capture distinct response patterns. The results were stratified into six levels representing varying degrees of safety awareness and reporting culture.
Second, a classification model was developed using LightGBM, a Gradient Boosting Decision Tree algorithm. The model was trained to predict the six- level evaluation hierarchy based on the response distribution ratios as input features. Compared to traditional decision tree algorithms, LightGBM adopts a leaf-wise growth strategy, which enables higher prediction accuracy and reduced computational cost. It also uses Gradient-based One-Side Sampling (GOSS) and Exclusive Feature Bundling (EFB), making it suitable for large- scale organizational data.
Finally, a comment generation mechanism was integrated into the system. For each predicted evaluation level, the system automatically selects and outputs a feedback comment tailored to the organization’s response tendencies. These comments are based on expert assessments and practical safety management insights, enabling the system to offer actionable advice.
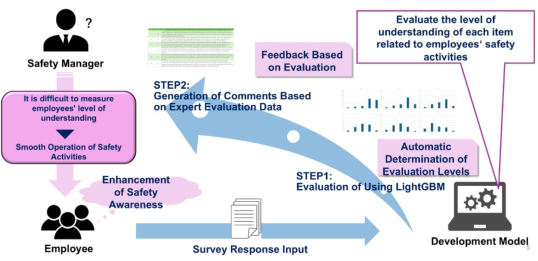
As illustrated in Figure 1, the proposed system consists of two main steps following the input of survey responses. In Step 1, the response distributions are analyzed using LightGBM, which automatically determines the evaluation levels for each of the five categories. In Step 2, based on these levels, the system generates feedback comments referencing expert evaluation data. These outputs provide safety managers with insights into employees’ understanding of safety activities, supporting smooth and effective safety operations. Ultimately, this process contributes to raising employees’ safety awareness through tailored guidance derived from organizational data. (Figure 1).
Figure 1: Outline of the supporting system developed in this study.
Prototype of a Safety Management Support Tool 47
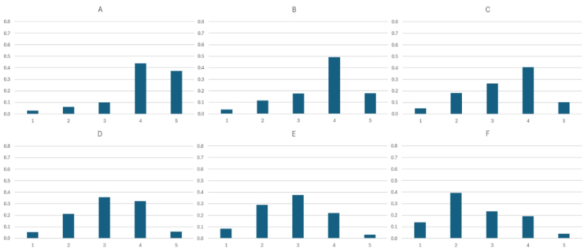
Classification and Stratification of Evaluation Scales Using Response Patterns In this study, we first conducted cluster analysis on response patterns for five items, excluding the basic concepts and checklist among the 55 survey items. These clusters were then stratified into six levels. The cluster analysis was adjusted to ensure that response patterns across different departments were evenly distributed, and responses with distinct tendencies were appropriately identified. Groups were formed at unit size ranging from several dozen to around one hundred individuals. As a concrete example, this paper presents the stratification results for “Atmosphere” (Figure 2).
Upon analyzing the histogram distributions of each cluster, clear trends were observed regarding the status of error reporting and the degree of psychological safety within the organization.
Cluster A: Predominantly responses of 4 and 5, with minimal selections of 1 to 3. This indicates a highly favorable error reporting culture, where employees feel secure in reporting errors, reflecting a high level of psychological safety. In such organizations, errors are appropriately shared, enabling prompt implementation of corrective measures and effective risk management.
Cluster B: While 4 is the most frequent response and 5 is also present, there are slight occurrences of responses from 1 to 3. This suggests that, although the error reporting environment is generally well-established, some employees may still harbor concerns. Particularly, there may be apprehension among employees that reporting could negatively impact their evaluations. Therefore, it is necessary to further encourage error reporting and for management to actively provide feedback to ensure a higher degree of psychological safety.
Cluster C: Responses of 3 and 4 are predominant, with 1 and 2 being less frequent but still present. This implies that, while the organization’s safety culture is somewhat established, there is variability in the frequency and quality of error reporting. Some employees understand the significance of error reporting and engage proactively, but there may not be a unified approach across the organization. Differences in managerial responses and
48 Akita and Okada
feedback quality could lead to varying levels of comfort in reporting errors across departments. Moving forward, it is essential to reform management’s mindset and enhance transparency in error reporting.
Cluster D: The majority of responses are 3, with 2 and 4 also comprising a significant portion. This suggests that error reporting is not sufficiently promoted within the organization. If there is a tendency to emphasize individual responsibility post-reporting, employees may hesitate to report errors. Continuing in this manner could lead to concealment of issues, increasing the risk to organizational safety. Therefore, fostering a culture that focuses on utilizing errors for improvement rather than assigning blame, and ensuring management actively secures psychological safety, is necessary.
Cluster E: Responses of 2 and 3 are prevalent, with 4 and 5 being very rare. This distribution indicates that the error reporting culture is not well-established, and many employees feel significant resistance to reporting. Particularly, if employees believe that reporting could lead to blame or lower evaluations, error concealment may become routine, severely hindering organizational improvement. To address this, management must consistently communicate the importance of error reporting and provide appropriate feedback to reporting employees. Additionally, it is urgent to reassess perceptions of human error and advance education and awareness reforms.
Cluster F: Responses of 1 and 2 are predominant, with very few responses of 3 or higher. This distribution suggests that error reporting is scarcely conducted, and psychological safety is extremely low. If reporting leads to severe reprimands or punitive actions, employees will avoid reporting errors altogether. Past experiences where reporting employees faced isolation, or disadvantages may further exacerbate this trend. In such situations, identifying the root causes of human errors and implementing preventive measures becomes exceedingly difficult. To fundamentally transform the organization’s safety culture, it is imperative to reform management’s mindset and initiate top-down policy changes. In the short term, introducing incentive systems for error reporting and establishing mechanisms to ensure reporting does not negatively impact evaluations are necessary steps.
Automatic Evaluation Hierarchy Determination and Feedback Generation Using LightGBM In this study, we utilized response data collected between 2007 and 2022 to create feedback comments corresponding to evaluation results for five items, excluding basic concepts and checklists from the 55-question survey. Using these data, we trained a model with six-level hierarchical evaluations as training data, employing LightGBM, a type of Gradient Boosting Decision Tree (GBDT).
Traditional decision tree algorithms adopt level-wise growth, where all branches are expanded evenly, often leading to higher computational costs. In contrast, LightGBM employs leaf-wise growth, prioritizing the expansion of branches with more information, thereby achieving high- accuracy predictions with reduced computation. Additionally, LightGBM
Prototype of a Safety Management Support Tool 49
utilizes Gradient-based One-Side Sampling (GOSS) to focus on learning from significant data and Exclusive Feature Bundling (EFB) to group low- correlation features, enabling efficient learning even with high-dimensional data.
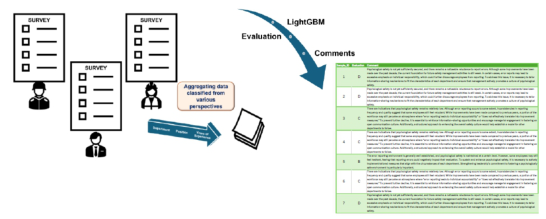
Figure 3: Examples from response results to evaluation and comment output.
As a result, compared to traditional decision tree algorithms, LightGBM achieves faster and more accurate classification while minimizing computational costs.
Leveraging these characteristics, we constructed a classification model that takes the feature quantities of each response pattern as input and outputs the corresponding evaluation hierarchy. The input data consists of normalized proportions of responses ranging from 1 to 5 for specific evaluation items within the departments under assessment. By applying this method, when new response data are input, the system automatically determines the hierarchy for each evaluation item and instantly generates corresponding feedback comments.
In this paper, we present an example of evaluation results obtained by inputting response data collected in 2024 (Figure 3).
Table 3: Presents the similarity between the generated comments and the actual comments.
Table available in the original PDF paper.
Sample_ID Evaluation Generated Comment Actual Expert Comment Similarity Score
1 D Psychological safety is not yet sufficiently
There is a tendency for
0.7713
psychological safety to be low. Although it has significantly improved compared to ten years ago, it is still weak as a foundation for future activities. However, it is important to foster an environment for information sharing (management) to ensure that supervisors do not hesitate to provide guidance.
secured, and there remains a noticeable reluctance to report errors. Although some improvements have been made over the past decade, the current foundation for future safety management activities is still weak. In certain cases, error reports may lead to excessive emphasis on individual responsibility, which could further discourage employees from reporting. To address this issue, it is necessary to tailor information-sharing mechanisms to fit the characteristics of each department and ensure that management actively promotes a culture of psychological safety.
Continued
50 Akita and Okada
Table 3: Continued Sample_ID Evaluation Generated Comment Actual Expert Comment Similarity
Table available in the original PDF paper.
Score
0.806
There is a tendency for
2 D Psychological safety is not yet sufficiently
psychological safety to be low. Although it has improved compared to ten years ago, it remains quite weak as a foundation for future activities. However, it is important to foster an environment for information sharing, tailored to the characteristics of each district, to ensure that supervisors do not hesitate to provide guidance (on-site management).
secured, and there remains a noticeable reluctance to report errors. Although some improvements have been made over the past decade, the current foundation for future safety management activities is still weak. In certain cases, error reports may lead to excessive emphasis on individual responsibility, which could further discourage employees from reporting. To address this issue, it is necessary to tailor information-sharing mechanisms to fit the characteristics of each department and ensure that management actively promotes a culture of psychological safety.
3 C There are indications that psychological safety
There is a tendency for
0.5801
psychological safety to be low. To prevent further deterioration, we hope that the appropriate implementation of psychological safety will be actively promoted in accordance with the situation of each department.
remains relatively low. Although error reporting occurs to some extent, inconsistencies in reporting frequency and quality suggest that some employees still feel reluctant. While improvements have been made compared to previous years, a portion of the workforce may still perceive an atmosphere where “error reporting leads to individual accountability” or “does not effectively translate into improvement measures.” To prevent further decline, it is essential to reinforce information-sharing opportunities and encourage managerial engagement in fostering an open.
4 C There are indications that psychological safety
Psychological safety is low. It is
0.758
important to foster an environment for information sharing (management) to ensure that supervisors do not hesitate to provide guidance.
remains relatively low. Although error reporting occurs to some extent, inconsistencies in reporting frequency and quality suggest that some employees still feel reluctant. While improvements have been made compared to previous years, a portion of the workforce may still perceive an atmosphere where “error reporting leads to individual accountability” or “does not effectively translate into improvement measures.” To prevent further decline, it is essential to reinforce information-sharing opportunities and encourage managerial engagement in fostering an open.
5 B The error reporting environment is generally
There is a tendency for
0.6629
psychological safety to be low. To prevent further deterioration, we hope that the appropriate implementation of psychological safety will be actively promoted in accordance with the situation of each department.
well established, and psychological safety is maintained at a certain level. However, some employees may still feel hesitant, fearing that reporting errors could negatively impact their evaluation. To sustain and enhance psychological safety, it is necessary to actively implement tailored measures that align with the circumstances of each department. Strengthening leadership’s commitment to fostering a psychologically safe environment is particularly important.
Continued
Prototype of a Safety Management Support Tool 51
Table 3: Continued Sample_ID Evaluation Generated Comment Actual Expert Comment Similarity
Table available in the original PDF paper.
Score
0.5663
There is a tendency for
6 C There are indications that psychological safety
psychological safety to be low. Although it has significantly improved compared to ten years ago, it remains quite weak considering its role as a central command center. We hope that the appropriate implementation of psychological safety will be actively promoted to serve as a leading example for other departments.
remains relatively low. Although error reporting occurs to some extent, inconsistencies in reporting frequency and quality suggest that some employees still feel reluctant. While improvements have been made compared to previous years, a portion of the workforce may still perceive an atmosphere where “error reporting leads to individual accountability” or “does not effectively translate into improvement measures.” To prevent further decline, it is essential to reinforce information-sharing opportunities and encourage managerial engagement in fostering an open communication culture. Additionally, a structured approach to enhancing the overall safety culture would.
7 D Psychological safety is not yet sufficiently
There is a tendency for
0.7713
psychological safety to be low. Although it has significantly improved compared to ten years ago, it is still weak as a foundation for future activities. However, it is important to foster an environment for information sharing (management) to ensure that supervisors do not hesitate to provide guidance.
secured, and there remains a noticeable reluctance to report errors. Although some improvements have been made over the past decade, the current foundation for future safety management activities is still weak. In certain cases, error reports may lead to excessive emphasis on individual responsibility, which could further discourage employees from reporting. To address this issue, it is necessary to tailor information-sharing mechanisms to fit the characteristics of each department and ensure that management actively promotes a culture of psychological safety.
The comments for each evaluation were organized and constructed based on existing human factories and expert opinions. In this study, we measured the semantic similarity between the generated comments and the assessment results provided by experts and safety managers from various organizations. To measure this similarity, we utilized the pre-trained Sentence-BERT (SBERT) model “sentence-transformers/paraphrase-multilingual-MiniLM- L12-v2”. This model maps sentences and paragraphs to a 384-dimensional dense vector space, facilitating tasks such as clustering and semantic search. We converted each text into embedding vectors and then calculated the cosine similarity between them. The resulting similarity scores ranged from 0.5663 to 0.7713, with all scores exceeding 0.5 (Table 3).
The measurement results indicate that the generated comments exhibit a certain degree of similarity to the actual comments, suggesting they are generally appropriate. Specifically, comments with scores above 0.75 imply expressions and content nearly identical to the actual comments. Conversely, comments with scores around 0.6 may reflect differences in expression or information content; however, no significant discrepancies were observed. To achieve higher similarity in the future, adjusting expressions to better reflect the characteristics of actual comments is considered effective.
52 Akita and Okada
CONCLUSON Much of the safety-related information, especially human error-related information, is obtained through reports from the workplace. In addition to the knowledge and experience of the field, the quality and quantity of the information collected can be enhanced by increasing the willingness to collect information.
Detailed analysis of the results of comprehension surveys can help to identify ways to motivate employees to participate in safety and human error response activities. If employees are motivated to participate, it is expected that this will lead to a revitalization of safety activities as a whole. Furthermore, if a mechanism can be introduced to accurately collect a variety of information while devising ways to increase the level of understanding of safety activities in the workplace, this will also promote DX in all aspects of work, including safety activities. We plan to enhance the predictive accuracy of LightGBM by optimizing feature selection and tuning hyperparameters. We also intend to compare this model with other approaches, such as deep learning, to construct a more precise evaluation model. Currently, evaluations are conducted on individual items like “atmosphere”; however, analyzing relationships with other evaluation items and developing an integrated evaluation model will improve the system’s versatility. Additionally, by collecting and training data from a broader range of organizations, we aim to strengthen the model’s adaptability, ensuring effective functionality across various industries and organizations. To verify the system’s effectiveness and practicality in real-world settings, we will collaborate with companies and organizations for system evaluation. Gathering feedback from actual users and continuously refining the system will help evolve it into a more user- friendly and practical tool. The automated evaluation system developed in this study has the potential to enhance the quality of human error prevention activities within organizations. Through ongoing improvements in practical applications, we strive to build an even more effective system.
REFERENCES
Boughaba, A., Hassane, C. and Roukia, O., 2014. Safety Culture Assessment in Petrochemical Industry: A Comparative Study of Two Algerian Plants. Safety and Health at Work, 5(2), pp. 60–65. Chen, H., Li, H. and Goh, Y. M., 2021. A review of construction safety climate:
Definitions, factors, relationship with safety behavior and research agenda. Safety Science, 142, p. 105391. Hantula, D. A., Rajala, A. K., Kellerman, E. G. B. and Bragger, J. L. D., 2001.
The value of workplace safety: A time-based utility analysis model. Journal of Organizational Behavior Management, 21(2), pp. 79–98. Johnson, S. E., 2007. The predictive validity of safety climate. Journal of Safety Research, 38(5), pp. 511–521. Kao, C.-S., Lai, W., Chuang, T. and Lee, J.-C., 2007. Safety culture factors,
group differences, and risk perception in five petrochemical plants. Process Safety Progress, 29, September. Kastenberg, W. E., 2015. Ethics, risk, and safety culture: Reflections on Fukushima and beyond. Journal of Risk Research, 18(3), pp. 304–316.
Prototype of a Safety Management Support Tool 53
Li, J. and Hale, A. R., 2016. Output distributions and topic maps of safety related journals. Safety Science, 82, pp. 236–244. Mearns, K. and Flin, R., 1999. Assessing the state of organizational safety—culture
or climate? Current Psychology, 18(1), pp. 5–17. Mearns, K., Whitaker, S. M. and Flin, R., 2003. Safety climate, safety management practice and safety performance in offshore environments. Safety Science, 41(8), pp. 641–680. Nakayama, Y., Okada, Y., 2006. Development of Human Error Management
Support Program. Proceedings of the 2006 International Ergonomics Association 16th World Congress on Ergonomics, pp. 22–29. Sutton, I., 2008. Use Root Cause Analysis to Understand and Improve Process Safety Culture. Process Safety Progress, 27, pp. 274–279. Van Nunen, K., Li, J., Reniers, G. and Ponnet, K., 2018. Bibliometric analysis of
safety culture research. Safety Science, 108, pp. 248–258. Vinodkumar, M. N. and Bhasi, M., 2010. Safety management practices and safety behaviour: Assessing the mediating role of safety knowledge and motivation. Accident Analysis & Prevention, 42(6), pp. 2082–2093. Wilpert, B. and Itoigawa, N., 2001. Safety Culture in Nuclear Power Operations.
NA. Willis, P. G., Brown, K. A. and Prussia, G. E., 2012. Does employee safety influence customer satisfaction? Evidence from the electric utility industry. Journal of Safety Research, 43(5–6), pp. 389–396. Yokomizo, A., Mori, Y., & Okada, Y., 2009. An Analysis of Human Error
Management Data on Organizations - Tendencies and Features of Organizational Human Error Management. Proceedings of the 2nd International Conference on Applied Human Factors and Ergonomics, pp. 1–8. Mori, Y., Yokomizo, A., & Okada, Y., 2006. Assessment of Human Error Management in Organizations. Proceedings of the 2006 International Ergonomics Association 16th World Congress on Ergonomics, pp. 15–22. Zohar, D., 1980. Safety Climate in Industrial Organizations: Theoretical and Applied
Implications. The Journal of Applied Psychology, 65, pp. 96–102. Zohar, D. and Luria, G., 2005. A Multilevel Model of Safety Climate: Cross-Level Relationships Between Organization and Group-Level Climates. The Journal of Applied Psychology, 90, pp. 616–628.
LISTED IN THE AHFE DIGITAL BOOKSTORE CATALOGUE
Explore the complete digital volume
Safety Management and Human Factors
Read this individual research paper free through the original publisher, or explore the full digital proceedings book.
ISBN 978-1-964867-65-6
Explore this ISBN in the AHFE Bookstore ↗Listed in the July 2026 bookstore catalogue; search by ISBN to confirm current availability · Digital book purchase optional