Xianchun Yang, Xiaojun Liu (2025). The Impact of Information Presentation Modes on Visual Search under Different Task Modalities. In: Human-Computer Interaction & Emerging Technologies. AHFE Open Access, vol. 195, pp. 123–131. https://doi.org/10.54941/ahfe1006230
In recent years, the effect of information presentation on visual exploration in industrial system application software has received much attention, but there is less research on the effect of information presentation on visual exploration in the context of different task modes. In this paper, the industrial operation tasks are classified into three modes: one is the unconscious viewing task, the second is the daily operation task, and the third is the emergency operation task; and the information presentation modes are classified into three categories: one is text only, the second is picture only, and the third is the combination of picture and text, so as to explore the impacts of the different information presentation modes on the performance under the three kinds of task intensities. At the same time, a platform was built for different tasks to simulate the real operating environment, and the behaviour was quantified by collecting the subjects' task completion time and correctness rate, etc. The experimental data showed that the combination of graphics and text in Tasks 1 and 2 was the best information presentation method. The lower the information complexity in task one, the smaller the gap between the three presentation methods, the higher the information complexity, the lower the correct rate of the pure picture presentation method; in task two, the higher the number of information, the heavier the processing load of the pure text display method. In Task 3, which requires users to react quickly, the combination of graphic and text increases the amount of information, and the display of too much information reduces the operation efficiency, and thus is not the best presentation method.
Current research on industrial system interfaces focuses on the presentation of information and data as a whole, with a notable shortcoming as little research has explored how various forms of information presentation affect operational performance and visual memory under different task modes. Many experts in data visualisation have concluded that the combination of graphics and text is the most intuitive and efficient way of presenting information in visualisation design and accordingly proposed that the design principle should be to reduce the cognitive cost and improve the clarity of information. However, none of them have been specifically analysed for different task modes. Brauner et al. (2022) reviewed the user-centred
design of industrial human-machine interfaces, emphasizing the importance of information presentation. Zhuang (2018) explored visual information design in complex industrial systems from a cognitive load perspective. However, in the design practice of actual industrial system interfaces, the task scenarios are diverse and complex, and different task scenarios face different operational tasks, thus the combination of graphic and text approach cannot satisfy all scenarios. This problem has been increasing in recent years. Schnotz et al. (2005) focuses on the diversity and personalisation of information presentation and emphasise the importance of selecting appropriate information presentation methods according to different users and task scenarios. These studies imply that the combination of graphics and text may not be suitable for all situations. In this paper, industrial operation tasks are firstly classified into three modes: unconscious browsing tasks, daily operation tasks, and emergency operation tasks, and then study which information presentation mode (text-only, picture-only, and combination of graphics and text) is the best information presentation mode for these three types of scenarios, and the results show that the combination of graphics and text does not apply to all task scenarios.
BACKGROUND AND RELATED WORK Text-Only Information Presentation
Text-only information presentation plays a crucial role in interface design. Nielsen (1994) states that clear and concise text-only enhances the usability of the user interface. Thus avoiding excessive graphics and animations that distract the user’s attention. Kernbach et al. (2015) further emphasised that presenting information using plain text and concise diagrams reduces cognitive load and improves the clarity of information. In addition, Hutton (2019) found through eye-tracking experiments that plain text information has a unique advantage in attracting users’ attention. Therefore, the reasonable use of text-only information presentation in interface design can provide users with a more efficient and intuitive information acquisition experience.
Picture-Only Information Presentation The presentation of picture-only information in interface design has a significant impact on the user’s visual experience and cognitive efficiency. In recent years, several scholars have conducted in-depth research on this. For example, Haoqiong (2011) discussed the connotation of information design in depth and pointed out that pure picture information has the advantage of being intuitive and easy to comprehend in interface design, which can quickly attract the attention of the user and convey key information. Meanwhile, Kim (2019), in his interdisciplinary study, further explored the application of pure picture information in UI design in terms of interaction design and information architecture, pointing out that a reasonable picture layout and presentation can enhance the efficiency of users’ navigation and information access. Together, these studies reveal the critical role of picture-
The Impact of Information Presentation Modes on Visual Search 125
only information in interface design, providing designers with valuable references and guidance.
Presentation of Information in a Combination of Text and Pictures In interface design, the combination of graphic and textual information presentation has been proven to be an important means of improving user experience and enhancing the effect of information delivery. For example, Wood (2014), by organically combining visual elements with textual information, the interface not only attracts the user’s attention but also improves the readability and comprehension of information. The design strategy of combining graphics and text can enable users to grasp the content of the interface more intuitively and reduce the cognitive burden, thus optimising the overall user experience. This view has been widely verified and supported in several related literatures, proving the irreplaceability of image-text combination in interface design.
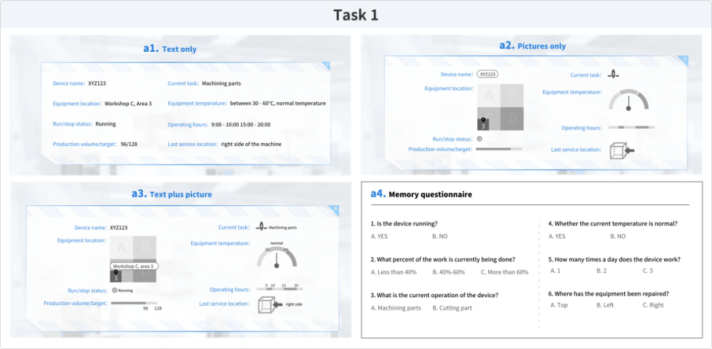
EXPERIMENTAL OVERVIEW This experiment explores the effect of information presentation style on visual search in different task modes. The task modes were divided into three categories: an unconscious viewing task, a daily operation task, and a forceful operation task; and the information presentation modes were divided into three categories: text-only, picture-only, and picture-text combination. Figure 1 below shows Task 1, which simulates the interface display under three information presentation situations (a1, a2, a3). Subjects were divided into three groups and were allowed to spend 30 s to freely browse one of the interfaces. After browsing, subjects were asked to fill out a memory questionnaire (a4), record the complete time and correct rate of the questionnaire, test which presentation method performs the best for the interface design under the unconscious viewing task, and fill out the post-experiment use feedback.
Figure 1: Unconscious viewing task (Task 1).
126 Yang and Liu
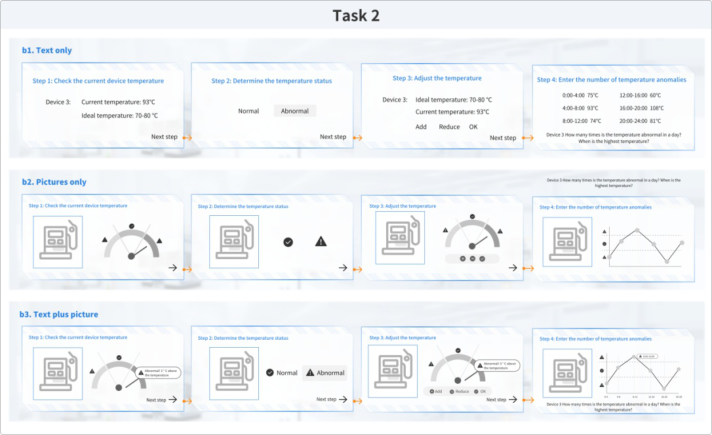
Figure 2 below shows Task 2, in which b1, b2, and b3 correspond to three forms of information presentation. The subjects were divided into three groups, and the task scenario was set as the daily checking and recording of equipment temperature by workshop employees. The subjects were required to operate four steps (checking the equipment temperature, judging the status, adjusting the temperature, and counting the temperature data). The time spent and the correctness rate were recorded after the completion of the task.
Figure 2: Daily operational task (Task 2).
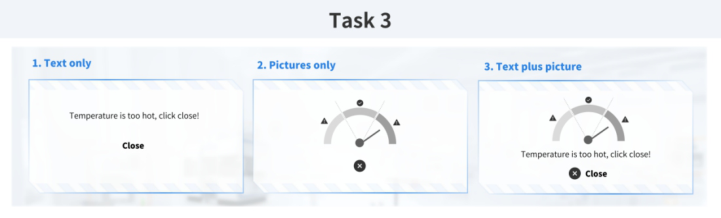
Figure 3 below shows Task 3, in which a scenario was set up for an employee to urgently switch off over-temperature equipment. The subjects were divided into three groups and presented with three information presentation interfaces (c1, c2, c3), and the time taken to close the window and the correct rate were recorded. After both experiments were completed, the subjects were asked to fill in the usage feedback.
Figure 3: Enforced operational task (Task 3).
The Impact of Information Presentation Modes on Visual Search 127
SUBJECTS A total of 12 subjects (4 males and 8 females) were recruited for this experiment. The age range of the subjects was 23–29 years old, with normal or corrected-to-normal vision, no colour blindness or colour weakness, and none of them had been exposed to the experimental materials used in this experiment before the experiment. In order to avoid mutual interference between the experimental materials, the subjects were divided equally into three groups, each group corresponding to one type of information presentation interface. The interfaces were created by Figma, ProtoPie and other software and could be clicked to interact with each other. The experiment was conducted in a quiet environment and subjects were asked to remain focused.
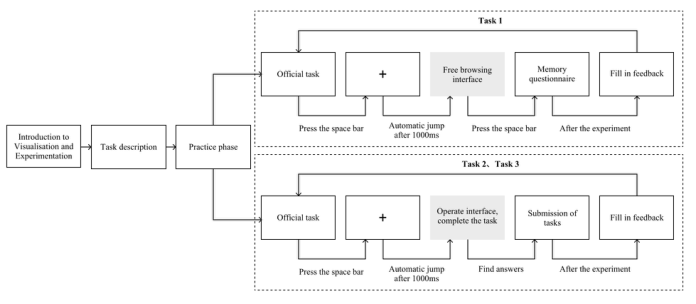
PROCESS This experiment explores the influence of three kinds of information presentation on visual search under three task modes. The researchers explained the rules of the experiment before the experiment began, and waited 10 seconds for the experiment to begin. In the first stage of the task, the subjects were told that they had no purpose and did not need any operation, and only needed to browse the interface freely, then fill in the memory questionnaire and record the filling time and accuracy of the questionnaire. After the experiment, the subjects were asked to fill in the reasons for errors and complete the experiment. Give the participants a chance to practice before tasks 2 and 3 begin. In the second stage of the task, the subjects were informed of the specific task and pressed the next button every time they completed an operation. Finally, the task completion time and accuracy rate were calculated. In the three stages of the task, the subjects were informed of the specific task, three information display interfaces were randomly presented, and the reaction time and accuracy rate were recorded after the pilot operation. The following figure 4 shows the complete experimental process.
Figure 4: Experimental operation process.
128 Yang and Liu
EXPERIMENTAL RESULTS
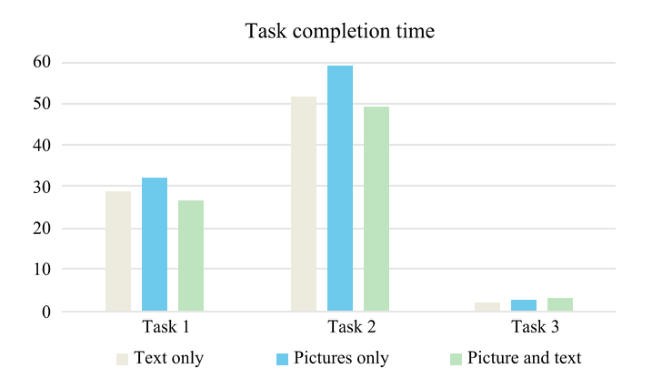
Figure 5 shows the completion time of the three task scenarios in which the subjects filled in the memory questionnaire. As shown in Figure 3, in task 1, the average filling time of the questionnaire was only for text interface (T = 29.03), only for pictures (T = 32.60), and the combination of text and pictures (T = 27.67). In task 2, the average completion time of text interface task only (T = 52.97), picture only (T = 59.81), picture and text combination (T = 49.31). In task 3, the average completion time of only text interface tasks (T = 2.325), only pictures (T = 2.610), and graphic combination (T = 3.121). It can be found that the combined form of task 1 and 2 makes the completion time of the task less than the other two ways of presentation, and task 3 takes the longest time. The experimental results show that task 1 and task 2 better reflect the improvement of the completion efficiency of the combination of text and text in terms of task completion time, but in task 3, the combination of text and text increases the number of interface elements, and the subjects need to spend more time to understand the reaction, which is not suitable for emergency handling.
Figure 5: Three task completion times for different information presentation styles.
Table 1 shows the average filling time and corresponding accuracy rates of the questions with the largest and smallest gaps in the memory questionnaire under Task 1 scenario, with the maximum accuracy being 1 and the minimum accuracy being 0. Question 3 is the one with the largest gap, in which pure picture takes the longest time and has the lowest accuracy rate. The reason for the error is that subjects cannot know the meaning of icon processing, which is very subjective. It follows that for unconscious browsing, pure images are not the best form of presentation for complex information. Topic 4 is the problem with the smallest gap, and topic 4 is the problem of judging the current state of the equipment. The subjects can correctly understand the current state of the equipment by relying on any information presentation
The Impact of Information Presentation Modes on Visual Search 129
mode without too much cognitive processing. It can be seen that in the context of this task, the simpler the information, the smaller the gap between the three information presentation modes, the more complex the information, and the least efficient the pure picture presentation mode. The combination of graphics and text can bring shorter task completion time and accuracy rate, that is, higher operation performance.
Table 1: Time to fill in different questions of the memory questionnaire and percentage of correct answers.
Table available in the original PDF paper.
Q3 Time Q3 Percentage
Q4 Time Q4 Percentage Correct Correct Text only 3.975 0.5 2.925 0.75 Picture only 5.850 0.25 3.425 0.75 Text and picture 3.225 1 2.775 0.75
In the last step of the operation in Task 2, i.e., selecting how many times the temperature was abnormal in a day, Table 2 shows the average completion time and correct rate of this operation. The table shows that plain text took the longest time and had the lowest rate of correctness. The text- only operation system requires the subjects to compare each specific piece of information back and forth, which causes the line of sight to sway back and forth. According to the feedback from the subjects, when there is too much information in the temperature data, extra effort is needed to memorise the number of abnormal temperatures, which requires more information processing load than the other two forms, resulting in a significantly higher completion time and lower rate of correctness than that of the picture-only and graphic-text combination forms.
Table 2: Task 2 step 4 operation completion time and correct rate.
Table available in the original PDF paper.
Completion
Correctness
Time
Rate Text only 16.08 0.75 Picture only 7.751 1 Text and picture 7.950 1
Table 3 shows the average response time and accuracy rate of Task 3 under three forms of information presentation. As shown in the table, the correct rate of the three states is close, but the reaction time is different. The shortest response time was for text mode (T = 2.325), and the longest reaction time was for graphic combination (T = 3.121). In the combination mode, the amount of information is large, and the subjects need to process the text and the picture twice, resulting in a long reaction time. At the same time, according to the collected feedback questionnaire, most subjects would not make a choice after reading the text and picture information at the same time but choose one to judge whether it is an abnormal temperature state. For example, in the experiment, subjects only need to rely on one type of
130 Yang and Liu
information, text or picture, to make a judgment. Too much information will reduce the efficiency of the operation.
Table 3: Mean response time and percentage correct for task 3.
Table available in the original PDF paper.
Completion
Correctness
Time
Rate Text only 2.325 1 Picture only 2.610 1 Text and picture 3.121 1
DISCUSSION OF RESULTS With the wide application of visual operating interfaces in industrial systems, researchers have studied the effects of different information presentation modes on operating performance in industrial systems, but have not distinguished between different task scenarios. In this paper, by classifying the work scenarios of worker operating systems into three categories, we target to study the role of information presentation modes on the efficiency improvement of operating systems. The experiment proves that the best information presentation mode is not consistent under different task modes. In Task 1, the graphic-text combination presentation has the least task completion time. Meanwhile, the simpler the information is, the smaller the gap is, and the more complex the information is, the graphic-text combination is more helpful for the subjects to understand. In task two, the graphic-text combination is the most efficient. Meanwhile, for the operation task with more information, plain text requires more processing load from the subjects and is the worst way to present information. In Task 3, the combination of graphic and text increased the amount of information, subjects had to complete cognitive processing twice, and most users only needed either text or pictures to make a judgement. Therefore, for tasks that require quick responses, too much information presentation may reduce the efficiency of the operation.
CONCLUSION
This paper discusses the effects of three kinds of information presentation on visual memory in different task scenarios by constructing the interface of an industrial operating system. The results show that the combination of graphics and text is the best information presentation method for unconscious viewing tasks and daily operation tasks. Pure images are not suitable for more complex or informative tasks. The combination of graphics and text increases the amount of information presented and is not suitable for operational tasks that require a quick response from the user. When designing the interface of industrial operating systems, designers need to first clarify the use scenarios of different system functions and then discuss the best way to present information for different task scenarios, so as to design an industrial operating system that is comfortable and efficient. There are
The Impact of Information Presentation Modes on Visual Search 131
still some shortcomings in this paper. The task scenario of the experiment is relatively broad, and the number of participants in the experiment is not large. Hope to improve in future research.
REFERENCES
Brauner, P., Schaar, A. K., & Ziefle, M. (2022). Interfaces, interactions, and industry 4.0: A framework for the user-centered design of industrial user interfaces in the internet of production. In Human-Technology Interaction: Shaping the Future of Industrial User Interfaces (pp. 361–388). Cham: Springer International Publishing. Haoqiong Sun. (2011). Dialogue with Graphics: What is Information Design?
Tsinghua University Press. Hutton, S. B. (2019). Eye tracking methodology. Eye movement research: An introduction to its scientific foundations and applications, 277–308. Kernbach, S., Bresciani, S., & Eppler, M. J. (2015). Slip-sliding-away: A review of the
literature on the constraining qualities of PowerPoint. Business and Professional Communication Quarterly, 78(3), 292–313. Kim, S. (2019). Why Should GUI Designers Create Visual Novelties?: The Mechanisms of First Impression Formation in User Experience: The Mechanisms of First Impression Formation in User Experience. Archives of Design Research, 32(2), 31–43. Nielsen, J. (1994). Usability engineering. Morgan Kaufmann. Schnotz, W., & Rasch, T. (2005). Enabling, facilitating, and inhibiting effects of animations in multimedia learning: Why reduction of cognitive load can have negative results on learning. Educational Technology Research and Development, 53(3), 47–58. Wood, D. (2014). Basics Interactive Design: Interface Design: An introduction to
visual communication in UI design. A&C Black. Zhuang, K. L. (2018). Cognitive Load and Decision Accuracy: A Study of Visual Complexity in Data Presentation. International Journal of Business Management and Visuals, ISSN: 3006-2705, 1(2), 6–9.
Read this individual research paper free through the original publisher, or explore the full digital proceedings book.
ISBN 978-1-964867-71-7
Explore this ISBN in the AHFE Bookstore ↗Listed in the July 2026 bookstore catalogue; search by ISBN to confirm current availability · Digital book purchase optional