Yiwei Xie, Xiaojun Liu (2025). The Impact of Color Combinations on Recognition Efficiency and Visual Fatigue in Industrial Alarm Systems. In: Human-Computer Interaction & Emerging Technologies. AHFE Open Access, vol. 195, pp. 353–362. https://doi.org/10.54941/ahfe1006254
This study delved deeply into the influence of foreground and background color combinations on recognition efficiency and visual load in industrial alarm systems. By conducting experiments with 15 participants and 54 color combinations, descriptive statistical analysis indicated that color combinations significantly affected the reaction time of visual recognition. Foreground colors, particularly those with higher saturation and luminance, played a crucial role in promoting visual recognition, while the impact of background colors was relatively less pronounced. A two - way ANOVA was performed, revealing that foreground color was a dominant factor influencing reaction time, while the background color and their interaction had relatively minor significant effects. The research findings can be applied to optimize the color design of industrial alarm systems, thus enhancing information recognition efficiency and reducing the probability of operator errors. Moreover, these results have implications for other visual - information - based fields. Future research could explore long - term effects and more complex color - related factors.
Industrial alarm systems, as a fundamental and integral component within the realm of modern industrial automation and intelligent manufacturing, assume a primary responsibility for facilitating the rapid identification of critical information and enabling operators to make precise decisions through the real - time dissemination of alarm information (Mustafa et al., 2023). Nevertheless, with the progressive augmentation in the complexity of industrial systems and the density of information, both the volume and intricacy of alarm information have escalated substantially. This development subjects operators to an increasingly acute problem of information overload (Wang et al., 2015). Evidenced by research, information overload not only substantially elevates the cognitive burden borne by operators but also has the potential to result in a decline in task - completion efficiency and decision - making inaccuracies, thereby endangering the operational safety of the system (Goel et al., 2017). Against this backdrop, the optimization of the visual representation of alarm information through rational interface design,
particularly the refinement of color - combination design, has emerged as a crucial issue demanding immediate resolution.
In alarm system interface design, color significantly affects the salience of information, visual load, and operator comfort during extended tasks. High- contrast color combinations improve visibility, while moderate saturation and brightness reduce visual fatigue and enhance recognition efficiency (Ojanpää & Näsänen, 2003). Moreover, adjusting foreground-background color contrast is crucial in complex task environments (Zuffi, Beretta & Brambilla, 2006), but the interaction between foreground color saturation, brightness, and background grayscale brightness remains underexplored (Yu & Ouyang, 2023).
The issues of information overload and visual load have become one of the major challenges in the design of industrial alarm systems. Although existing research has revealed the potential of color design in reducing cognitive load and enhancing identification efficiency (Guo et al., 2022), it is often restricted to the laboratory environment and lacks in - depth exploration in the context of complex multi - task industrial settings (Lagomarsino et al., 2022). For instance, in a dynamic industrial environment, operators need to handle high - priority alarm information during long - term tasks, and their demand for the balance between color saliency and visual comfort is particularly prominent. Although some research has started to focus on the relationship between color combinations and visual load, there is still a lack of systematic analysis of the comprehensive effects of multi - dimensional color combinations in different task scenarios.
This study addresses these gaps by investigating the optimal design of foreground and background color combinations, focusing on how color saturation, brightness, and background grayscale interact to affect recognition efficiency and visual load. The findings will inform color design in industrial alarm systems and support operators in high- stakes tasks. This research extends color design theory and provides actionable design recommendations, particularly for balancing information salience and operator comfort, with potential applications in other fields such as traffic signaling, medical devices, and public safety systems.
PARTICIPANTS A total of 15 adults aged between 20 and 30 were recruited as experimental participants in this study. All participants were required to have normal or corrected - to - normal vision (abnormal color vision was excluded through the Ishihara color blindness test) and possess basic computer operation skills. The selection of this age range aimed to ensure that the participants were in a stage of high efficiency in visual and cognitive responses, while minimizing potential biases caused by age differences. Additionally, none of the participants had prior experience related to the experimental tasks, so as to avoid biases in the experimental results due to familiarity.
The Impact of Color Combinations on Recognition Efficiency and Visual Fatigue 355
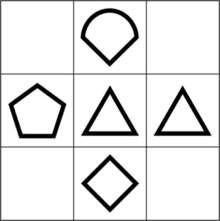
STIMULI The experimental materials consist of two parts: icons and the foreground- background color combinations. The target shapes are composed of four common geometric figures that are similar in form and have consistent complexity (see Figure 1). The stroke width is set to 7.5 pixels, the viewing angle is 2
, and the shapes are positioned within the central visual field between 1.5
and 3
for clear identification by participants. The stimulus materials for this study are designed based on color perception theory and visual salience research, aiming to systematically analyze the impact of foreground-background color combinations on visual recognition efficiency. Red, a commonly used color for high-priority signals in alarm systems, is selected as the foreground color due to its high salience and ability to rapidly attract attention (Shahriari, Shee & Örtengren, 2006). This choice is intended to simulate real-life scenarios for urgent information delivery while satisfying the need for salience and rapid recognition in alarm signal design.
Figure 1: The four shapes with consistent complexity used in the experiment.
For the background color selection, this study employs a non-chromatic background, fixed at a hue of N (neutral), with a saturation of 0%. The background brightness is adjusted through changes in luminance to create varying levels of background brightness. The choice of background luminance aims to reduce visual fatigue and enhance salience. Particularly in environments where alarm information needs to be quickly transmitted, a darker background helps alleviate visual strain and improves the salience of the target color.
The 15 color combinations in the experiment are made up of 9 red and 6 achromatic (gray) shades, with values from the HSV color model (see Figure 2). The 9 red colors are selected based on: 1 level of hue (0
), 3 levels of saturation (33%, 66%, 99%), and 3 levels of luminance (33%, 66%, 99%). The achromatic colors are selected with 1 level of hue (N), 1 level of saturation (0%), and 6 levels of luminance (0%, 10%, 20%, 30%, 40%, 50%). By combining the 9 red foreground colors with the 6 grayscale background colors, a total of 54 color combinations are generated. These combinations comprehensively cover a range of visual scenes with varying contrast and luminance differences, providing a reliable foundation
356 Xie and Liu
for further analysis of the interaction effects between color parameters, visual salience, and recognition efficiency in subsequent experiments.
Figure 2: Foreground colors R1-R9 and background colors A-F used in the experiment.
PROCEDURE The experiment process is divided into three stages: the practice stage, the formal experiment stage, and the questionnaire filling stage. The experiment uses a visual comparison task, primarily manipulating the parameters of the foreground and background colors of the patterns to examine how these variables affect the participants’ reaction times and accuracy. This will allow for an analysis of the impact of color combinations on the salience of target patterns and visual recognition efficiency.
In the practice stage, participants complete 10 practice tasks to familiarize themselves with the experiment interface and key operations. The color combinations for the practice tasks are randomly selected, and their data are not included in the formal experiment results. After completing the practice tasks, participants press the spacebar to enter the formal experiment stage.
At the beginning of the formal experiment stage, a 375 mm × 375 mm grid appears at the center of the screen, displaying the target and distractor patterns. A reference pattern is fixed in the center of the grid, and participants must quickly recognize and select the target pattern that matches the reference pattern’s shape. The target pattern appears randomly in one of the adjacent cells (up, down, left, or right) of the reference pattern. Participants press the corresponding keys (W for up, S for down, A for left, D for right) based on the position of the target pattern. This task requires participants to make a quick visual judgment and respond manually, simulating the information recognition and response speed demands of an alarm system.
In each round of the experiment, the target pattern randomly appears in one of the four adjacent cells (up, down, left, or right) of the reference pattern, with other positions filled by distractor patterns. The distractor patterns have different shapes from the target pattern, and the experiment may use shapes such as triangles, diamonds, squares, etc., as distractors, while the target pattern and reference pattern maintain the same shape. The color combinations for all patterns are randomly generated based on the experimental conditions, with 9 red foreground colors and 6 gray background colors, covering various combinations from dark to light.
To avoid memory effects and sequence bias, the presentation order of all color combinations is randomized. Each round of the experiment has a stimulus display time of 500 milliseconds, followed by a 1000-millisecond
The Impact of Color Combinations on Recognition Efficiency and Visual Fatigue 357
blank interval to reduce visual residual effects and increase the reliability of the experimental data. The experimental system records the reaction time from the presentation of the target pattern to the participant’s key press and immediately checks whether the key press is correct, calculating the accuracy.
During the formal test phase, participants must complete 54 color combinations ×2 repetitions = 108 experimental tasks to ensure the reproducibility of the experimental results and the reliability of statistical data.
After the experiment, participants fill out a questionnaire primarily used to collect basic information and subjective evaluations. The questionnaire aims to obtain feedback from participants regarding the comfort and visual load of the color combinations used in the task to further analyze the impact of color combinations.
RESULTS
According to the experimental results, the overall accuracy rate reached over 95%, indicating that the subjects were able to fully understand the tasks and execute them conscientiously during the experiment. However, given the high value of the accuracy rate itself, further analyzing the specific reasons behind it may be unnecessary, as this is already sufficient to demonstrate the degree of task completion and the subjects’ understanding of the tasks.
The overall mean reaction time of all data is 1080.95 milliseconds, with a standard deviation of 366.682 milliseconds. The relatively large standard deviation implies significant variability in participants’ reaction times, suggesting that different color combinations have varying impacts on visual recognition speed. This finding indicates that color combination selection could be a key factor influencing information recognition efficiency in industrial alarm systems.
The overall mean reaction times vary across different foreground colors (R01 - R09). For example, foreground color R03 has the longest overall mean reaction time of 1297.46 milliseconds, while R09 has the shortest at 945.52 milliseconds. This indicates that different shades of red as foreground colors lead to distinct differences in visual recognition speed. It can be speculated that certain red shades are more effective in attracting participants’ attention, enabling quicker responses.
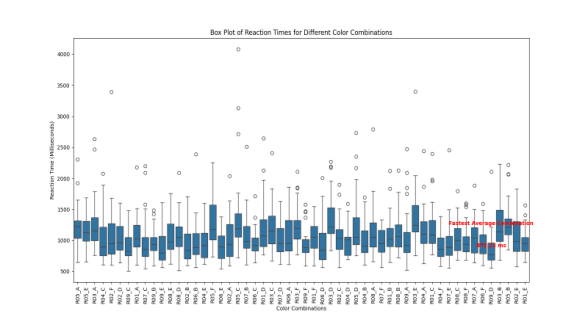
The overall mean reaction times also differ among different background colors (A - F). Background color A has a relatively long overall mean reaction time of 1121.55 milliseconds, while color E has a relatively short one of 1043.23 milliseconds. This suggests that background color attributes such as brightness may affect visual recognition, and a more suitable background color could improve reaction speed. Specific foreground - background color combinations exhibit unique characteristics in terms of mean reaction time and standard deviation. For instance, the combination of foreground color R05 and background color C has a mean reaction time of 1410.57 milliseconds and a standard deviation of 717.014 milliseconds, indicating a long reaction time and large inter - participant variability, potentially being an unfavorable combination. In contrast, the combination of foreground color
358 Xie and Liu
R09 and background color D has a relatively short mean reaction time of 872.23 milliseconds, suggesting it is more conducive to visual recognition (see Figure 3).
In summary, these descriptive statistics provide a basis for further in - depth analysis of the impact of color combinations on recognition efficiency in industrial alarm systems. More advanced statistical methods can be employed in subsequent research to verify the significance of differences between color combinations.
Figure 3: Rox plot of reaction times for different color combinations.
To identify the factors significantly affecting reaction time, a two-way analysis of variance (ANOVA) was conducted. As ANOVA assumes that the data meet the conditions of normality and homogeneity of variance, a normality test was first performed. The results of the normality test revealed a p-value of 0.014 < 0.05, indicating that the data followed a normal distribution. A logarithmic transformation was applied to preprocess the data. Following this, a homogeneity of variance test was conducted on the transformed data.
Levene’s test was conducted to evaluate the equality of error variances in the log-transformed reaction times across the different experimental groups. The research design incorporated factors including the intercept, foreground color, background color, and their interaction. The test was performed based on several measures of central tendency, and the results were as follows: first, when evaluated using the mean, the Levene statistic was 1.044 (df1 = 53, df2 = 1566) with a p-value of 0.389, indicating that there was no significant difference in variances across the groups. At the significance level of 0.05, there was insufficient evidence to reject the null hypothesis, thus supporting the assumption of equal variances. Similarly, when the test was based on the median, the Levene statistic was 0.814 (df1 = 53, df2 = 1566), with a p-value of 0.828, further reinforcing the conclusion that the variances across groups were equal. The result remained consistent when the median was adjusted with degrees of freedom, yielding a Levene statistic of 0.814 (df1 = 53, df2 = 1344.362) and a p-value of 0.828. Finally, when the trimmed mean
The Impact of Color Combinations on Recognition Efficiency and Visual Fatigue 359
was used, the Levene statistic was 0.982 (df1 = 53, df2 = 1566) with a p-value of 0.513, suggesting that the assumption of equal variances was valid across the groups. Given that all p-values exceeded 0.05, the null hypothesis of equal error variances was not rejected, indicating that the log-transformed data satisfied the homogeneity of variance assumption, which is essential for the subsequent two-way ANOVA analysis. The results are shown in Table 1.
Table 1: Reaction time levene test.
Table available in the original PDF paper.
p Levene Statistic Based on Mean 1.044 0.389 Based on Median 0.814 0.828 Based on Median with Adjusted df 0.814 0.828 Based on Trimmed Mean 0.982 0.513
In the two - way ANOVA with reaction time as the dependent variable, the Type III sum of squares of the foreground color is 3.445, the F-value is 28.560, and the p-value is less than 0.001, with a partial eta - squared of 0.127. This indicates that the foreground color has a significant effect on the reaction time and can explain 12.7% of the variance of this variable, showing a considerable impact. The background color has an F-value of 2.034 and a p-value of 0.071. At the conventional significance level of 0.05, its effect on the reaction time is not significant, but it can be considered significant at the 0.1 significance level. With a partial eta - squared of only 0.006, it shows that the background color has a weak effect on the reaction time and limited ability to explain the variance. The interaction term between the foreground color and the background color has an F-value of 1.105 and a p-value of 0.301, with a partial eta - squared of 0.027, suggesting that the interaction has no significant effect on the reaction time and a low degree of explanation for the variance. Overall, the foreground color is a key factor influencing the reaction time, while the background color and its interaction with the foreground color have relatively minor impacts. The results are shown in Table 2.
Table 2: Continued Source Type III df Mean F p Partial Sum of Squares
Table available in the original PDF paper.
Eta - Squared
Foreground
.667 40 .017 1.105 .301 .027
Color * Background Color Error 23.613 1566 .015 Total 14733.027 1620 Corrected
27.878 1619
Total a. R-squared =.153(Adjusted R-squared =.124)
DISCUSSION
This study investigated the impact of foreground and background color combinations on recognition efficiency and visual fatigue in industrial alarm systems. The results indicate that foreground colors with high saturation and brightness significantly enhance recognition efficiency, while the effect of background colors is less pronounced. Specifically, foreground colors such as R09, characterized by high saturation and brightness, led to faster reaction times and reduced visual fatigue, as confirmed by post - experiment interviews. In contrast, foreground colors with low brightness, like R03, resulted in slower reaction times and increased fatigue.
Although the effect of background colors was less significant, medium - brightness gray backgrounds were found to be conducive to reducing visual discomfort. Combinations with extreme contrast, whether too high or too low, had a negative impact on reaction times. Additionally, according to the post - experiment questionnaire survey, such extreme - contrast color combinations also had an adverse effect on visual comfort. This suggests that excessive contrast can cause visual fatigue and degrade performance.
These findings highlight the crucial role of foreground colors in optimizing recognition efficiency and minimizing visual fatigue. Future research could explore the long - term effects of specific color combinations on operator performance and visual fatigue in more dynamic and complex environments.
CONCLUSION
This study comprehensively explored the impact of foreground and background color combinations on recognition efficiency and visual fatigue in industrial alarm systems. By recruiting 15 participants for a series of experiments involving 54 color combinations and a well - designed visual comparison task, a wealth of data was collected.
Descriptive statistical analysis vividly illustrated that different color combinations had a remarkable influence on the reaction time of visual recognition. Notably, foreground colors played a crucial role. For instance, R03, with a high saturation level of 99
yet a low luminance level of 33
,
The Impact of Color Combinations on Recognition Efficiency and Visual Fatigue 361
led to the longest overall mean reaction time, and it was also likely to cause more severe visual fatigue. Conversely, R09, featuring a high saturation level of 99
and a high luminance level of 99
, had the shortest reaction time and was more effective in reducing visual fatigue, as verified by the experimental results. Background colors also had an impact, though relatively minor. Some specific combinations, like R05 - C, showed long reaction times, large variability, and potentially higher visual fatigue, while R09 - D was more beneficial for visual recognition and less likely to induce visual fatigue.
The two - way ANOVA results indicated that foreground color was a key determinant of reaction time, and it also had a significant impact on visual fatigue. The background color had a relatively weak effect on reaction time and visual fatigue, with marginal significance at the 0.05 level but approaching significance at the 0.1 level. The interaction between foreground and background colors had no significant influence on either reaction time or visual fatigue.
This research fills certain gaps in the study of color combinations in industrial alarm systems, especially in complex multi - task scenarios. The findings can be directly applied to optimize the color design of industrial alarm systems. By choosing appropriate color combinations considering saturation and luminance levels, it is possible to enhance information recognition efficiency, reduce visual fatigue, and minimize the risk of operator errors. This, in turn, improves the overall safety and reliability of industrial systems. Moreover, the research results have potential implications for other visual - information - dependent fields, such as traffic signaling, medical devices, and public safety systems. Future research could focus on the long - term effects of specific color combinations on operator performance and visual fatigue in more dynamic and complex industrial environments, as well as the impact of more complex color - related factors.
REFERENCES
Goel, P., Datta, A. & Mannan, M. S., 2017. Industrial alarm systems: Challenges and opportunities. Journal of Loss Prevention in the Process Industries, 50, pp. 23–36. Guo, H. et al., 2022. The Effect of Color Combinations on the Efficiency of
Text Recognition in Digital Devices. International Journal of Human–Computer Interaction, 40(5), pp. 1317–1326. Lagomarsino, M., Lorenzini, M., De Momi, E. & Ajoudani, A., 2022. An online framework for cognitive load assessment in industrial tasks. Robotics and Computer-Integrated Manufacturing, 78, 102380. Mustafa, F. E., Ahmed, I., Basit, A., Malik, S. H., Mahmood, A. & Ali, P. R., 2023.
A review on effective alarm management systems for industrial process control: Barriers and opportunities. International Journal of Critical Infrastructure Protection, 41, 100599. Ojanpää, H. & Näsänen, R., 2003. Effects of luminance and colour contrast on the search of information on display devices. Displays, 24, pp. 167–178. Shahriari, M., Shee, A. & Örtengren, R., 2006. The development of critical criteria to
improve the alarm system in the process industry. Human Factors and Ergonomics in Manufacturing & Service Industries, 16(3), pp. 321–337.
362 Xie and Liu
Wang, J., Yang, F., Chen, T. & Shah, S. L., 2015. An overview of industrial alarm systems: Main causes for alarm overloading, research status, and open problems. IEEE Transactions on Automation Science and Engineering, 13(2), pp. 1045–1061. Yu, N. and Ouyang, Z. (2023) ‘Effects of background colour, polarity, and saturation
on digital icon status recognition and visual search performance’, Ergonomics, 67(3), pp. 433–445. Zuffi, S., Beretta, G. & Brambilla, C., 2006. A color selection tool for the readability of textual information on Web pages. In Internet Imaging VII (Vol. 6061, pp. 63–71). SPIE.
Read this individual research paper free through the original publisher, or explore the full digital proceedings book.
ISBN 978-1-964867-71-7
Explore this ISBN in the AHFE Bookstore ↗Listed in the July 2026 bookstore catalogue; search by ISBN to confirm current availability · Digital book purchase optional