Kosuke Sato, Yusuke Osawa, Keiichi Watanuki (2025). Estimation of Work Productivity Using R–R Intervals and QRS Regions of Electrocardiograms during Computational Tasks under Cognitive Load. In: Human Factors in Design, Engineering, and Computing. AHFE Open Access, vol. 199, pp. 1863–1872. https://doi.org/10.54941/ahfe1006997
In recent years, advances in information technology have markedly increased the proportion of intellectual work across various occupations. In this study, intellectual work is defined as tasks that involve receiving and judging external information, performing knowledge processing such as analysis and numerical computation, and generating outputs. Such work demands cognitive resources that are essential for understanding, retaining, and manipulating information. However, prolonged engagement depletes these resources, leading to reduced productivity and extended working hours. Taking breaks has been recognized as an effective countermeasure, and systems capable of recommending optimal break timing are anticipated. To realize such systems, objective visualization of work productivity is required, and prior studies have investigated biological signals for assessing cognitive load during intellectual tasks. For example, Yamaguchi reported that heart rate variability analysis of electrocardiograms (ECGs) during continuous addition tasks showed increased LF and LF/HF ratios—indices of sympathetic activity—and decreased HF, an index of parasympathetic activity. These findings suggest that ECGs are effective for evaluating cognitive load. Nevertheless, no established method currently exists for quantitatively estimating work productivity in intellectual tasks using biological signals.In this study, we selected computational tasks with cognitive load as representative intellectual work and developed an estimation model (the baseline model) that predicts productivity from ECGs recorded during task performance. This model achieved an R² of approximately 0.67 and an individual error rate of about 7%. Despite these results, its accuracy was limited, and the physiological basis of estimation remained unclear. To address these limitations, SHAP analysis was applied to identify ECG waveform components contributing to the model’s predictions. The analysis revealed that the model captured overall waveform morphology and that certain heartbeats contributed more strongly than others. Specifically, high-contribution beats were characterized by shorter RR intervals (RRI), larger QRS power, and higher R-wave amplitudes compared with low-contribution beats. These findings led to the hypothesis that RRI, QRS regions, and R-wave amplitude are key features for productivity estimation. Building on this insight, participant-specific models were constructed using convolutional neural networks (CNNs) to extract morphological and temporal features from ECG waveforms. Training results demonstrated enhanced performance, with an average R² of about 0.85 and a mean absolute percentage error (MAPE) of approximately 4%, surpassing the accuracy of the baseline model. These results indicate that RRI, QRS regions, and R-wave amplitude are effective indicators for estimating work productivity during intellectual tasks.
In recent years, the development of information technology has increased the number of tasks that involve cognitive load in the workplace. As a result, issues such as decreased work productivity and long working hours have emerged. To address these problems, managing the cognitive resources used during task execution is essential. Cognitive resources are limited capacities required to understand, retain, and process information during task performance. The appropriate timing of breaks is considered effective in restoring these cognitive resources, and systems that can detect declines in work productivity and recommend breaks are required. Establishing an objective method to evaluate work productivity is indispensable to
realize such systems. However, the direct evaluation of work productivity is difficult in practice. Methods that utilize physiological signals have attracted increasing attention as alternatives. Among these, electrocardiograms (ECG) can be measured noninvasively in daily environments, suggesting their potential use in productivity evaluation. Yamaguchi analyzed heart rate variability during continuous-addition tasks and reported an increase in low-frequency (LF) power and the LF/high-frequency (HF) ratio, which are indices of sympathetic nervous activity, as well as a decrease in HF power, an index of parasympathetic activity (Yamaguchi, 2010). These findings suggest that ECG is effective for evaluating the cognitive load. However, methods using ECGs for quantitatively evaluating or estimating work productivity during tasks involving cognitive load have not yet been established.
In our previous study, we developed an ECG-based model to estimate work productivity during computational tasks with cognitive load. This model achieved an average R2 value of approximately 0.67 and an estimation error of approximately 7% for each individual. However, the estimation basis derived from ECG features remains unclear, and its prediction accuracy was only moderate. Therefore, this study developed a new model to clarify the ECG features related to work productivity estimation to improve prediction accuracy. Specifically, the SHapley Additive exPlanations (SHAP) analysis was applied to the existing model to identify key ECG features, and these findings were used to construct the proposed model.
Continuous-Addition Task Experiment for Estimating Intellectual Productivity To estimate work productivity during tasks involving cognitive load, it is necessary to select a task that not only imposes cognitive load but also induces fluctuations in work productivity. A decline in work productivity is caused by a reduction in cognitive resources available for task performance. Such a reduction can be attributed to three factors: (1) depletion of total cognitive resources through continuous intellectual activity, (2) misallocation of cognitive resources to the task due to internal interference, such as thinking about unrelated matters, and (3) decreased allocation of cognitive resources caused by fatigue or drowsiness. In this study, we assumed that these three factors occurred during the Uchida–Kraepelin test (Uchida, 1957), which is known to induce mental fatigue. We designed a computational task modeled after this test and measured ECG signals during task performance. Eight Japanese male participants (mean age: 23.0 ± 1.0 years) took part in the experiment, and each participant completed five sessions. This study was approved by the Ethics Committee for Human Research at Saitama University (R5-E-4). Written informed consent was obtained from all participants.
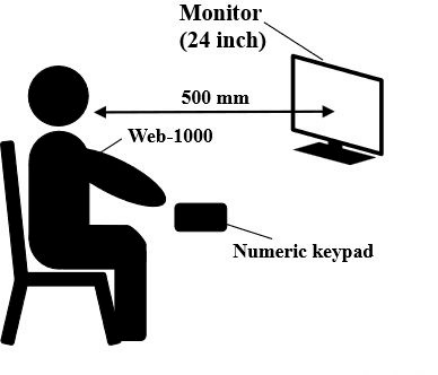
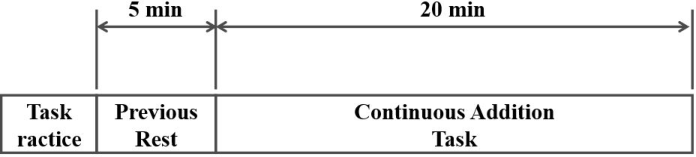
The experimental environment and protocol are shown in Figures 1 and 2, respectively. For the ECG measurements, a multichannel physiological measurement device, the Web-1000 (Nihon Koden Corporation), was used with a sampling frequency of 1 kHz. During the experiment, participants were seated 0.5 m away from the monitor, and task inputs were standardized
Estimation of Work Productivity Using R–R Intervals and QRS Regions 1865
so that responses were entered using only the dominant hand on a numeric keypad. The experiment consisted of three phases: task practice, a 5-min pre- rest period, and a 20-min task session. The task practice was conducted to eliminate the effects of familiarization with the keypad operation and task procedure. During the practice, participants were instructed to “continue until the task speed becomes stable” to ensure that they could perform the task at a consistent pace. After practice, a 5-min pre-rest period was provided, followed by a 20-min continuous-addition task. To prevent the participants from being aware of the elapsed time, the task duration was not disclosed.
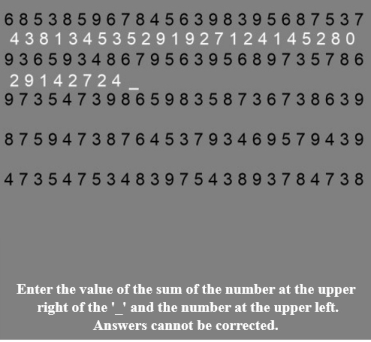
The continuous-addition task used in this experiment is shown in Figure 3. In this task, participants were required to calculate the sum of two adjacent numbers presented in a random sequence on the screen and enter the last digit of the sum using a numeric keypad. This task followed the format of the original Kraepelin test, and new sequences were presented every 1 min regardless of the number of answers provided. An instruction was displayed
at the bottom of the task screen: “Enter the sum of the numbers at the upper left and upper right of the ‘_’. Answers cannot be corrected.”
Figure 3: Task image.
Examination of the Basis for Estimating Work Productivity From ECG To clarify the ECG-based factors contributing to the estimation of work productivity, SHAP was applied to the existing model developed in our previous study.
In the existing model, the ECG signals measured in the experiment were resampled to 128 Hz and used as explanatory variables, while the number of correct answers in the continuous-addition task was set as the objective variable. Each variable was obtained using a 1-min time window with a 1-s sliding step, resulting in 5,705 data samples per participant. Both the input and output data were standardized prior to training. The model architecture was designed as a regression model that estimates work productivity by extracting subtle morphological features of ECG waveforms using a convolutional neural network (CNN), and feeding the extracted features into a neural network (NN). The rectified linear unit (ReLU) function was employed as the activation function in the convolutional and fully connected layers, and a linear function was used in the output layer. Batch normalization was applied after each convolutional and fully connected layer to stabilize and accelerate learning. In addition, a dropout layer with a probability of 0.4 was introduced after the fully connected layers to prevent overfitting and improve the generalization performance. The number of training epochs was set to 150. The model performance was evaluated using the R2 value and mean absolute percentage error (MAPE). A five-fold cross-validation (k = 5) was conducted to ensure stable evaluation of the generalization performance. The estimation model was constructed individually for each participant, resulting in an average R2 value of approximately 0.68 and an average MAPE of approximately 6.0%. The standard deviations of the R2 value and MAPE were approximately 0.11 and 2.2%, respectively, indicating relatively large variations in estimation accuracy among models.
Estimation of Work Productivity Using R–R Intervals and QRS Regions 1867
SHAP, an explainable AI method, is based on cooperative game theory and calculates Shapley values, which represent the contribution of each feature (Lundberg and Lee, 2017). This method enables the quantitative identification of features on which the model’s predictions are based. In the SHAP computation, background data are defined as a reference, and the contribution of each feature is evaluated by observing the change in prediction when the feature values from the test data are applied to the background data. In other words, the background data provides a “baseline prediction,” while the test data provides the “prediction to be explained.” Through this relationship, the predicted value can be decomposed feature- by-feature to interpret how it deviates from the baseline.
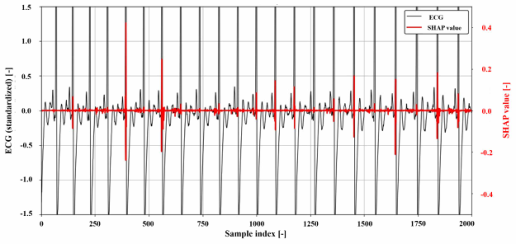
In this study, 100 samples for which the model produced average estimations were used as background data, and a combination of the top 50 and bottom 50 samples of predicted values was used as test data. This configuration enabled the analysis of feature contributions in predictions that deviated significantly from the average state. SHAP values were calculated for each of the eight participants, resulting in 100 test data samples per participant. Figure 4 shows an example of test data, illustrating the first 15 s of the results for one participant. The black line represents the ECG waveform, and the red line represents the SHAP values. The results indicate that the SHAP values exhibited time-series variations similar to those of the ECG waveform.
Figure 4: Relationship between ECG waveform and SHAP values.
These results confirmed that the degree of contribution varied across individual heartbeats. Therefore, it was hypothesized that heartbeats with high contributions may share common morphological characteristics. To examine this, heartbeats were divided into two groups according to their contribution levels. Specifically, the contribution of each heartbeat was defined as the sum of absolute SHAP values within a single heartbeat. The top 10% of heartbeats were classified as the high-contribution group, and the bottom 10% were classified as the low-contribution group. To compare the characteristics between the two groups, the R–R interval (RRI) length, QRS region power, and R-wave amplitude were used as indices, and the Wilcoxon signed-rank test was conducted with a significance level of 1%. The results showed that in seven out of eight participants, the
high-contribution heartbeats had significantly shorter RRI lengths than the low-contribution heartbeats. Similarly, in seven out of eight participants, the high-contribution heartbeats exhibited significantly higher QRS region power. For the R-wave amplitude, the high-contribution heartbeats showed significantly larger values in six participants, while the remaining two participants showed lower amplitudes for high-contribution heartbeats. These findings suggest that high-contribution heartbeats share common tendencies in RRI and QRS region features, and may also exhibit characteristic differences in R-wave amplitude depending on the individual participant.
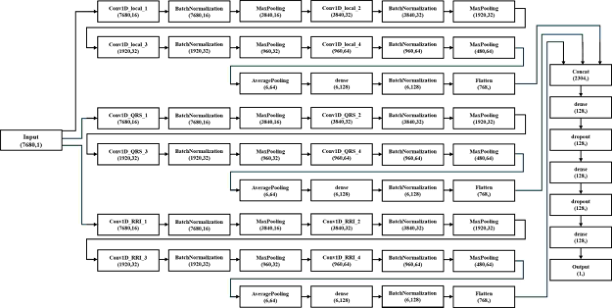
INTELLECTUAL PRODUCTIVITY ESTIMATION MODEL The SHAP values suggest that the RRI, QRS region power, and R-wave amplitude may contribute to the estimation of work productivity. Based on this finding, capturing these features could lead to a more accurate estimation. Therefore, the proposed model was developed in this study; its structure is shown in Figure 5.
Figure 5: Machine learning model shape.
The proposed model consisted of three branches corresponding to the RRI, QRS region, and R-wave amplitude. Each branch employed a CNN with different kernel sizes to extract distinct features. Each branch was trained using a four-layer CNN, followed by an average pooling layer that divided the time series into six segments and calculated the mean value of each segment for dimensionality reduction. A fully connected layer was then inserted into each branch to project features with different characteristics and scales into a common representation space. This process stabilized the joint learning after concatenation. The outputs were flattened into one-dimensional vectors and concatenated. In the RRI branch, the average RRI of each participant was calculated, and dilated convolution was applied using this value as a reference to extract features related to heartbeat intervals. In the QRS region branch, the average QRS width of each participant was calculated and used as the kernel size from the second layer onward. For the first layer, the same kernel size as that used in the local-feature branch was applied, allowing the model to capture progressively wider temporal features. The local-feature
Estimation of Work Productivity Using R–R Intervals and QRS Regions 1869
branch was designed to capture small morphological variations, including the R-wave amplitude, by employing a small kernel size. After concatenation, the combined features were passed through three fully connected layers to extract higher-level representations, and the output layer estimated the work productivity. The main output represented the final prediction of work productivity, while auxiliary outputs were added to each branch. These auxiliary outputs were only used during training to encourage each branch to extract useful features, thereby improving the performance of the main output. The ReLU activation function was used in all CNN and fully connected layers, and a linear activation function was applied to the output layer.
As training conditions, batch normalization was applied after the output of each convolutional and fully connected layer to stabilize and accelerate learning. In addition, dropout with a probability of 0.4 was introduced after the fully connected layers to prevent overfitting and improve the generalization performance. The number of training epochs was set to 150. The model performance was evaluated using the R2 value and MAPE. A five- fold cross-validation (k = 5) was employed to ensure the stable evaluation of the generalization performance. To verify the effectiveness of the proposed model, the Wilcoxon signed-rank test was performed at a 1% significance level on the R2 values, and MAPE was obtained from the proposed, existing, and baseline models.
RESULTS
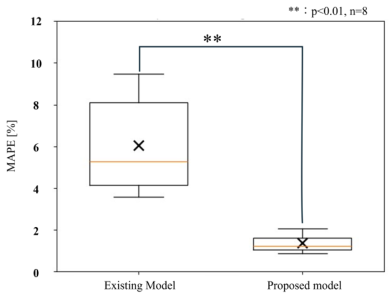
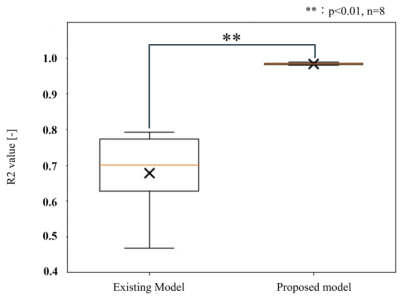
A statistical test was conducted on the MAPE and R2 values of the existing and proposed models, and significant differences were observed at the 1% significance level. The results are shown in Figures 6 and 7. The evaluation metrics of the proposed model are summarized in Table 1. The test results and evaluation metrics suggest that the proposed model can estimate work productivity with high accuracy. Compared with the existing model, the proposed model showed a smaller variation in estimation accuracy across individual models.
Figure 6: Results of the Wilcoxon signed-rank test for MAPE.Figure 7: Results of the Wilcoxon signed-rank test for R2 value.Table 1: Evaluation of the test data of the experimental participants.
Table available in the original PDF paper.
Participants MAPE [%] R2 value [-] A 1.071 0.987 B 1.291 0.989 C 0.929 0.984 D 1.174 0.983 E 2.076 0.980 F 1.995 0.985 G 0.844 0.985 H 1.484 0.981
Mean 1.356 0.984
DISCUSSION
The results suggest that the RRI, QRS, and local branches contribute to the high-accuracy estimation of work productivity. This section discusses why the features extracted from each branch contributed to the learning process.
The contribution of the RRI branch to the learning process is due to its ability to capture fluctuations in autonomic nervous activity through changes in the RRI. According to the Yerkes–Dodson law, task performance is associated with the level of arousal, and variations in RRI are believed to reflect fluctuations in arousal (Yerkes and Dodson, 1908). This law indicates that performance improves under an appropriate level of arousal, but decreases under low arousal caused by drowsiness or fatigue, as well as under excessive arousal resulting from overexcitement or tension. A high arousal level can lead to improved performance in simple tasks. In the proposed model, the application of dilated convolution to ECG signals enabled the extraction of long-term temporal variations. Furthermore, previous studies demonstrated that using CNN on ECG data allows the detection of R-wave positions (Zahid et al., 2021). Based on these findings, the proposed
Estimation of Work Productivity Using R–R Intervals and QRS Regions 1871
model can capture RRI and estimate work productivity by learning from its temporal variations.
The contribution of the QRS and local branches to the learning process is attributed to the ability of CNN to capture local morphological variations in the waveform. CNN can effectively detect local changes in waveform shapes, such as slope and sharpness. Because the QRS region and the area around the R-wave exhibit large gradients and curvatures, CNN were likely to capture their features more easily. Previous studies have shown that activation of the sympathetic nervous system increases myocardial contractility (Gordan et al., 2015), which may, in turn, increase the power of the QRS region and R-wave amplitude. Therefore, the morphological variations captured by CNN, such as the QRS region power and R-wave amplitude, may have been extracted as information reflecting changes in autonomic nervous activity. These findings suggest that the proposed model can estimate work productivity by capturing local morphological variations, including those in the QRS region and R-wave amplitude.
CONCLUSION
This study aimed to achieve a high-accuracy estimation of work productivity during computational tasks involving cognitive load by clarifying the ECG- based factors underlying the estimation and developing a model based on them. The SHAP values suggested that RRI, QRS region power, and R-wave amplitude contributed to the estimation of work productivity. Based on these findings, a model with a multibranch structure corresponding to the RRI, QRS region, and local waveform features was proposed. The proposed model achieved higher estimation accuracy and reduced inter-individual variation compared with the existing model. The high estimation accuracy is attributed to the RRI branch capturing temporal fluctuations in autonomic nervous activity, and the QRS and local branches capturing local morphological variations in the waveform. In future work, we plan to examine whether the proposed model can also estimate work productivity in other tasks involving cognitive load, and to develop and evaluate systems, such as rest-timing recommendation systems, that contribute to improving work productivity.
REFERENCES
Gordan, R., Gwathmey, J. K. and Xie, L. H. (2015). “Autonomic and endocrine control of cardiovascular function,” World Journal of Cardiology, Volume 7, No. 4, pp. 204–214. Lundberg, S. M. and Lee, S.-I. (2017) “A Unified Approach to Interpreting
Model Predictions,” Proceedings of the 31st International Conference on Neural Information Processing Systems, Long Beach, CA, 4–9 December 2017, pp. 4766–4777. Uchida, Y. (1957). “New aptitude test method - Uchida-Kraepelin mental test,” Nikkan Kogyo Shimbun. (in Japanese). Yamaguchi, K., (2010). “Analysis of Mental Load Stress by Heart Rate Variability,”
Research bulletin, Shigakukan University, Volume 31, No. 1, pp. 1–10 (in Japanese).
Yerkes, R. M. and Dodson, J. D. (1908). “The relation of strength of stimulus to rapidity of habit-formation,” Journal of Comparative Neurology and Psychology, Volume 18, No. 5, pp. 459–482. Zahid, M. U., Kiranyaz, S., Ince, T., Devecioglu, O. C., Chowdhury, M. E. H.,
Khandakar, A., Tahir, A. and Gabbouj, M. (2022). ”Robust R-Peak Detection in Low-Quality Holter ECGs Using 1D Convolutional Neural Network,” IEEE Transactions on Biomedical Engineering, Volume 69, No. 1, pp. 119–128.
LISTED IN THE AHFE DIGITAL BOOKSTORE CATALOGUE
Explore the complete digital volume
Human Factors in Design, Engineering, and Computing
Read this individual research paper free through the original publisher, or explore the full digital proceedings book.
ISBN 978-1-964867-75-5
Explore this ISBN in the AHFE Bookstore ↗Listed in the July 2026 bookstore catalogue; search by ISBN to confirm current availability · Digital book purchase optional