Hideyuki Nagashio, Yusuke Osawa, Keiichi Watanuki (2026). Estimating 3D Ground Reaction Forces During Gait Using a Deep Learning Model with IMU and Plantar Pressure Data. In: Affective and Pleasurable Design. AHFE Open Access, vol. 204, pp. 85–93. https://doi.org/10.54941/ahfe1007334
Approximately 40% of the long-term care requirements of the elderly are related to their declining walking ability, making early detection crucial. However, conventional ground reaction force (GRF) measurements are limited to laboratory environments, making daily measurements difficult. In this paper, we propose a method for estimating three-dimensional GRFs using deep learning with plantar pressure sensor and inertial measurement unit (IMU) data obtained from shoe-type devices. Gait data (13,542 strides) were collected from 12 healthy males (23.5 ± 1.2 years) under three speed conditions, and three models (1D-convolutional neural network, bidirectional long short-term memory, transformer) were compared. The transformer model achieved the highest estimation accuracy (average normalized root mean square error: 5.91%; average mean absolute error: 2.92%; body weight: average R²: 0.842). Furthermore, the introduction of a weighted loss function improved the overall accuracy, and we confirmed that the IMU data improved the estimation accuracy of the horizontal components (Fx, Fy). This method enables the continuous monitoring of walking ability in daily living environments.
In Japan, factors closely related to the decline in walking ability account for approximately 40% of the reasons why elderly people aged 65 and over require long-term care, including joint diseases (11.0%), fractures and falls (13.0%), and frailty owing to aging (13.3%) (Cabinet Office, Government of Japan, 2022). To prevent the need for long-term care owing to these factors, it is important to detect the decline in walking ability at an early stage and provide appropriate interventions.
Ground reaction forces (GRFs) and lower limb joint angles are important indicators of walking ability. GRFs provide essential mechanical information for assessing gait stability and joint loading (Osawa et al., 2018). Conventionally, specialized measurement equipment, such as force plates, have been used to measure GRFs; however, they are limited to laboratory environments and are difficult to use on a daily basis.
Furthermore, laboratory measurements suffer from the “Hawthorne effect,” a psychological phenomenon in which participants demonstrate better performance than usual when they are aware of being observed. Shah et al. (2020) reported that gait performance in the laboratory was superior to that in daily life, highlighting the importance of gait measurements in daily life settings. Moreover, gait characteristics obtained in the laboratory may not directly represent daily life (Fong et al., 2020).
Wrist-worn devices are widely used in daily life. However, there are two main challenges in using them for gait measurements. First, as the measurement location is far from the ground, it is difficult to capture subtle foot movements and obtain accurate contact timing. Second, it is not possible to directly measure mechanical information, such as GRF, which is essential for evaluating gait stability and joint loading. Therefore, obtaining information equivalent to GRFs in daily environments requires measurements close to the foot and a framework to estimate mechanical quantities from sensor signals.
Shoe-type devices have attracted attention because of their ability to address these challenges. They are equipped with plantar pressure sensors and inertial measurement units (IMUs), allowing the simultaneous measurement of load distribution and foot motion. However, it is difficult to obtain high- level mechanical information, such as three-dimensional GRFs (Fx, Fy, Fz) and joint angles, through physical conversion alone.
Therefore, this study aimed to establish a method for accurately estimating three-dimensional GRFs using deep learning with plantar pressure and IMU data obtained from shoe-type devices. In this study, we compared three deep- learning models with different characteristics (one-dimensional convolutional neural network (1D-CNN), bidirectional long short-term memory (BiLSTM), and transformer) to identify the optimal architecture. Furthermore, we aimed to improve the estimation accuracy by introducing a weighted loss function approach and quantitatively evaluating the contribution of the IMU data.
CONSTRUCTION OF 3D GROUND REACTION FORCE ESTIMATION MODEL Participants and Ethical Considerations
This experiment was conducted with the approval of the Ethics Committee for Research Involving Human Subjects at Saitama University (approval number: R6-E-15), and informed consent was obtained from all participants. The participants were 12 healthy males (age: 23.5 ± 1.2 years, average shoe size: 26.9 ± 0.5 cm) whose regular shoe sizes were within 26.0–28.0 cm to fit the shoe-type device size (27.0 cm).
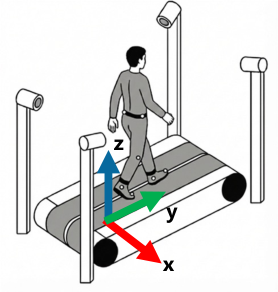
Experimental Protocol The participants were asked to walk for 300 s at three speed conditions: subjectively slow, comfortable, and fast. The average walking speed was 3.8 ± 1.0 km/h. Walking on a treadmill was used for the measurements (Figure 1a), and the following data were acquired simultaneously: The three-dimensional GRFs (Fx, Fy, and Fz) were measured on a treadmill using an integrated force plate. For the plantar pressure, the load distribution was
Estimating 3D Ground Reaction Forces During Gait Using a Deep-Learning Model 87 obtained using pressure sensors placed at eight locations on each shoe sole (16 locations in total; Figure 1b).
Y Z
z
X
y x
(a) Gait experiment on treadmill (b) 8 plantar pressure
(c) IMU placement
sensors
Figure 1: Overview of the experimental setup and measurement system.
Furthermore, three-axis acceleration and three-axis angular velocity data were measured using an IMU attached to each shoe (Figure 1c).
Data Preprocessing The following preprocessing steps were performed on the acquired data: First, a fourth-order low-pass Butterworth filter was applied to remove electrical noise. Next, the data were normalized. The GRFs were normalized by body weight (%BW), plantar pressure was min–max normalized, and IMU data were Z-score-standardized. Furthermore, mirror processing was applied to align the left-foot and right-foot data. In the segmentation, each stride from one heel strike to the next heel strike was divided, and each stride was time- normalized to 200 time steps, representing 100% of the gait cycle. Finally, a dataset of 13,542 strides was constructed with two participants for the test data and 10 participants for the training data (eight for training and two for validation).
Deep-Learning Models The three representative models with different characteristics were compared to capture the different features contained in GRFs during walking (Table 1).
First, the 1D-CNN excelled at local feature extraction and could capture instantaneous impacts and changes, such as abrupt changes in plantar pressure and the peak values of IMU data. We adopted a structure combining three convolutional layers (filters: 256, 512, and 512; kernel sizes: 5, 3, and 3) with batch normalization and dropout (0.30).
Second, BiLSTM was effective in capturing continuous changes in time- series data and learning the overall flow of walking strides. We adopted a structure that combined four layers of BiLSTM (hidden units: 512) with layer normalization and dropout (0.30).
Third, the transformer could capture the global correlations of temporally separated information within a step (e.g., the relationship between the heel- strike and toe-off) through the self-attention mechanism. We adopted a structure that projected the input dimensions to 128 dimensions and used three transformer encoder layers (heads: four, feedforward dimension: 256).
Table 1: Architecture summary of the three models.
Note: All models take 200 time steps × 14 variables as input and output 200 time steps × 3 variables (Fx, Fy, and Fz).
Training Conditions and Evaluation Metrics The mean squared error (MSE) was used as the loss function for training, and the Adam optimizer was employed. The batch size was 512, and the number of epochs was 200.
The models were evaluated using three metrics. The normalized root MSE (NRMSE) is a relative error metric that enables a comparison between axes with different force scales. Second, the mean absolute error (MAE) indicates the average difference between estimated and true values. Third, the coefficient of determination (R²) evaluates the goodness of fit of the time- series waveforms.
Weighted Loss Function As the GRF components of each axis have significantly different variances, conventional equal-weight loss functions prioritize the learning of the vertical component (Fz). To address this problem, the following weighted loss function is introduced:
L = 1 (ωx · MSEx + ωy · MSEy + ωz · MSEz), 3 where 𝜔x, 𝜔y, and 𝜔z are the weight parameters for the x-, y-, and z-axes, respectively, adjusted such that each component has an equal influence on learning.
RESULTS
Table 2 presents the estimation accuracies of the three models. The transformer model achieved the highest accuracy across all the evaluation metrics: an average NRMSE of 5.91%; an average MAE of 2.92%; an average R² of 0.842. When examined by component, the transformer showed the highest accuracy for both the mediolateral component (Fx) and anteroposterior component (Fy), whereas BiLSTM showed the highest accuracy for the vertical component (Fz).
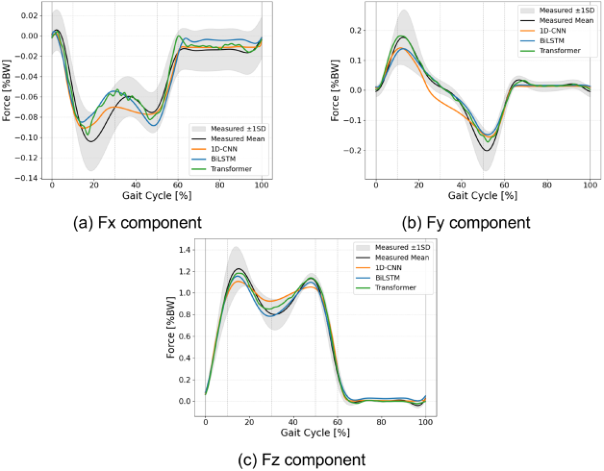
Figure 2 shows a comparison of the estimated GRF waveforms of the models. The transformer model demonstrated good agreement with the measured values across all three components (Fx, Fy, and Fz).
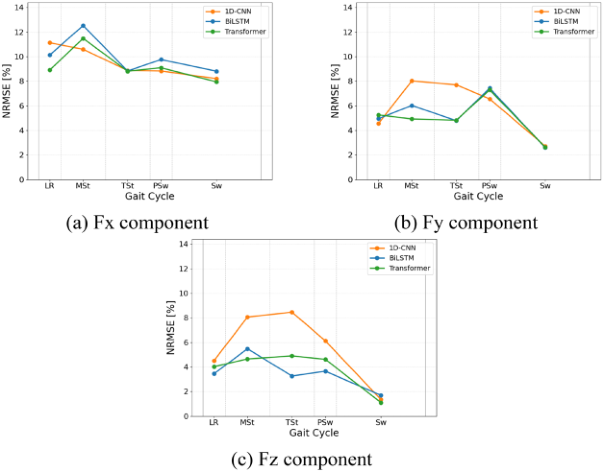
Figure 3 shows the estimation errors (NRMSE) for each gait phase. For the anteroposterior component (Fy), the transformer model achieved the lowest error during mid-stance (MSt). For the vertical component (Fz), BiLSTM exhibited the lowest error during the transition from the valley to the second peak (TSt to PSw).
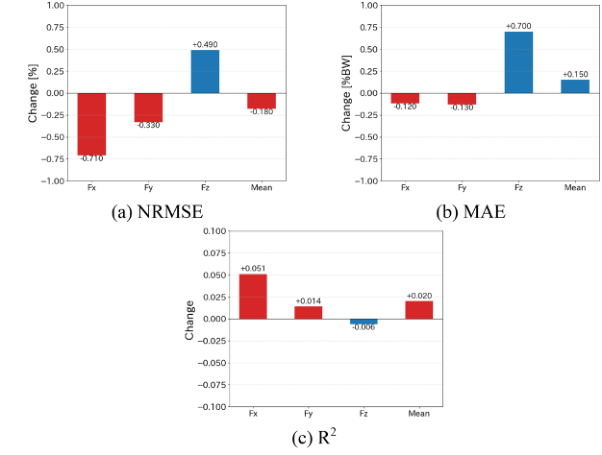
Figure 4 shows the effect of the weighted loss function on the estimation accuracy. The introduction of weighting reduced the average NRMSE from 5.91% to 5.73% and improves the average R² from 0.842 to 0.862. Although the accuracy of the horizontal components (Fx, Fy) improved, the accuracy of the vertical component (Fz) decreased slightly (R²: 0.981→0.975).
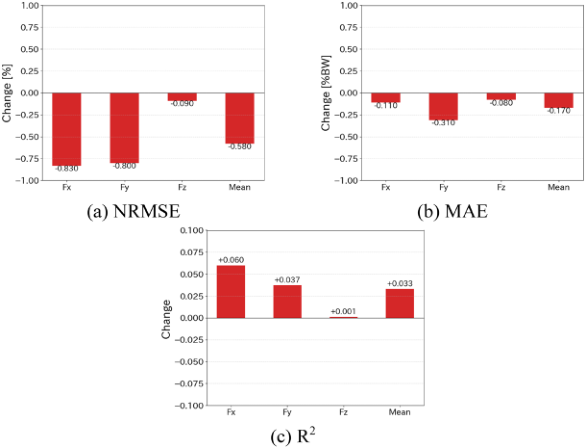
Figure 5 shows the effect of the IMU data on the estimation accuracy. The introduction of the IMU data reduced the average NRMSE from 6.31% to 5.73% and improved the average R² from 0.829 to 0.862. Particularly large improvements were observed in the horizontal components (Fx: R² 0.646→0.706, Fy: R² 0.868→0.905). The improvement in the vertical component (Fz) was limited (R²: 0.974→0.975).
Table 2: Comparison of estimation accuracy among the models (NRMSE, MAE, R²).
Figure 2: Comparison of the estimated GRF waveforms by each model. The gray bands indicate the standard deviation of the measured values.Figure 3: Estimation errors (NRMSE) by gait phase. LR: loading response, MSt: mid- stance, TSt: terminal stance, PSw: pre-swing, Sw: swing phase.Figure 4: Effect of weighted loss function (transformer model). The bars represent performance changes when introducing weighting (red: improved accuracy, blue: decreased accuracy).Figure 5: Effect of IMU data on estimation accuracy (transformer model). The bars represent performance changes when introducing weighting (red: improved accuracy, blue: decreased accuracy).
DISCUSSION
Superiority of the Transformer Model In this study, the transformer model achieved the highest estimation accuracy compared with the 1D-CNN and BiLSTM. This superior performance is attributed to its ability to learn global temporal dependencies through a self-attention mechanism. GRFs during walking exhibit strong correlations between temporally separated events, such as the braking force at heel strike and the propulsive force at toe-off. The transformer can efficiently learn long-term dependencies, resulting in excellent GRF estimation performance.
The high-precision estimation of the horizontal components contributed to the overall superiority of the transformer. For the mediolateral component (Fx), the body became most unstable during single-leg support with intense mediolateral balance control (the center of mass fluctuation). This suggests that the transformer could accurately capture behavior during this unstable single-leg support phase. For the anteroposterior component (Fy), the transformer effectively integrated and learned information from both the plantar pressure sensors and IMU to capture important temporally separated events, such as braking and propulsion.
In contrast, BiLSTM exhibited the highest accuracy for the vertical component (Fz). The vertical component exhibited a bimodal M-shaped curve, with continuous load transfer occurring during the transition from the valley to the second peak (mid-stance to terminal stance). BiLSTM excelled in learning continuous changes and smooth temporal transitions. However, the transformer also achieved sufficiently high accuracy and was superior in terms of the overall performance.
Although the 1D-CNN excelled at local feature extraction, its ability to capture the context of the entire gait cycle was limited, resulting in an overall accuracy that was inferior to that of the transformer.
Significance of Weighted Loss Function As the GRF components of each axis have significantly different variances, conventional equal-weight loss functions prioritize the learning of the vertical component (Fz). The weighted loss function introduced in this paper successfully addressed this problem and improved the estimation accuracy of all the components in a balanced manner.
Although weighting improved the accuracy of the horizontal components (Fx and Fy), which are difficult to estimate, the accuracy of the vertical component (Fz) decreased slightly. However, this decrease was within an acceptable range, and overall, the estimation accuracy improved, as all the components have an equal influence on learning. The benefit of improving the accuracy of the horizontal components, which are difficult to estimate, is significant and considered important for enhancing the practical applicability of gait analysis.
Importance of IMU Data This study quantitatively demonstrated that IMU data significantly contribute to improving the estimation accuracy of horizontal GRF components (Fx, Fy). As plantar pressure sensors primarily capture the vertical load distribution,
Estimating 3D Ground Reaction Forces During Gait Using a Deep-Learning Model 93 there are limitations in obtaining horizontal mechanical information. In contrast, IMU data provide dynamic information, such as acceleration and deceleration during walking and direction changes, by measuring foot acceleration and angular velocity.
For the vertical component (Fz), the contribution of the IMU was limited because of its strong correlation with the plantar pressure sensors. In contrast, the horizontal components (Fx and Fy) depend on acceleration and deceleration during walking, and the IMU significantly improved the estimation accuracy by complementing information that could not be captured by plantar pressure sensors alone. This result suggests that a complementary information integration of plantar pressure sensors and IMU is essential for GRF estimation using shoe-type devices.
CONCLUSION
In this paper, we proposed a method for estimating three-dimensional GRFs using deep learning with plantar pressure and IMU data obtained from shoe-type devices as inputs. The transformer model exhibited the highest performance. Furthermore, by introducing weighting to the loss function, the overall estimation accuracy was improved. In addition, we quantitatively clarified that the IMU data contribute significantly to improving the estimation accuracy of the horizontal GRF components (Fx, Fy). Based on these results, this method demonstrates the feasibility of three-dimensional GRF estimation using shoe-type devices and enables the continuous monitoring of walking ability in daily living environments.
REFERENCES
Cabinet Office, Government of Japan. (2021) Annual Report on the Ageing Society: 2021 Edition (Full Report). Website: https://www.stat.go.jp/data/topics/topi1420. html Fong, C., Doellinger, M., Patel, S., and Rinehart, N. (2020) “Age and environment-
related differences in gait in healthy adults using wearables”, NPJ Digital Medicine, Volume 3, No. 1. pp. 127. Osawa, Y., Watanuki, K., Kaede, K., and Muramatsu, K. (2018) “Factor analysis of stumblingby evaluation of lower limb gait trajectory and ground reaction force”, Proceeding of Mechanical Engineering Congress, Volume 2018. pp. S1210204. (in Jpanese). Shah, V.V., McNames, J., and Mancini, M. (2020) “Laboratory versus daily life
gait characteristics in patients with multiple sclerosis, Parkinson’s disease, and matched controls”, Journal of NeuroEngineering and Rehabilitation, Volume 17, No. 1. pp. 159.
LISTED IN THE AHFE DIGITAL BOOKSTORE CATALOGUE
Explore the complete digital volume
Affective and Pleasurable Design
Read this individual research paper free through the original publisher, or explore the full digital proceedings book.
ISBN 978-1-964867-80-9
Explore this ISBN in the AHFE Bookstore ↗Listed in the July 2026 bookstore catalogue; search by ISBN to confirm current availability · Digital book purchase optional