In recent years, user experience (UX) has become an important evaluation criterion in the development of products and services, in addition to the traditional emphasis on functionality and price competitiveness. In addition to practical aspects such as usability and convenience, “emotional value,” which affects the user’s emotions and senses, is also considered an element of UX. Emotional value is the positive feeling that a product or service elicits in the user, resulting in increased satisfaction and purchasing behavior. Thus, emotion is an important component of UX, and based on the “emotional information function theory” of psychology, emotion has been shown to act as the basis for decision-making in situations where judgment cues are scarce. Therefore, accurately understanding emotions and reflecting them in the UX design process is critical for increasing the value of products and services.However, measuring user emotions during UX evaluation remains a significant challenge. Conventional emotion evaluation methods, such as questionnaires and interviews, are primarily subjective; however, they have several limitations. For example, they may not accurately reflect actual emotional states because they are based on respondents’ memories and biases. Furthermore, it is difficult to obtain real-time emotion data because work must be interrupted during the evaluation process. Therefore, using biometric information to evaluate emotions has attracted considerable attention. Biometric information (e.g., heart rate variability, skin electrical response, and EEG ) may be related to users’ emotional responses, reducing subjective bias and allowing real-time evaluation.Furthermore, recent advancements in machine learning technology have stimulated research into emotion estimation using biometric information. In these studies, models have been developed to estimate psychological characteristics such as pleasantness–unpleasantness and arousal–non-arousal of emotions using biometric information, with efforts focusing on Russell’s emotional circle model. Thus, machine learning has shown the ability to connect biometric information with a psychological framework and quantitatively assess the emotional components of UX.This study aimed to build a machine learning model using biometric information, develop a mechanism for estimating user emotions based on Russell’s emotion circle model , and examine whether the model can be applied to UX evaluation. Specifically, we developed a model that uses biological information such as heart rate variability, skin electrical response, and cerebral blood flow as explanatory variables to estimate the emotional position (pleasant–unpleasant, arousal–non-arousal). The accuracy and reliability of the model were evaluated , and the effectiveness of objective UX evaluation using biometric information was determined by comparison with conventional subjective evaluation methods. Through this study , we aim to develop a new evaluation method that can identify emotional factors in UX evaluation in real time and objectively, thereby improving the product and service design process.
User experience (UX) refers to all experiences brought about by products and services. UX is based on the idea that it is important not only to provide devices with high usability and products and services with high work efficiency but also to provide users with valuable experiences, including satisfaction, comfort, and excitement. In recent years, with the spread of online shopping and increase in inexpensive and highly functional products, product choices have become more diverse. Consequently, UX is becoming increasingly important as a differentiating factor in addition to the traditional evaluation axes of price and functionality. However, current UX evaluations rely on subjective and intermittent methods that employ questionnaires
and interviews, which may lead to preconceptions about the product and deviations from the evaluation at the time of the experience. In addition, it is difficult to capture dynamic changes in UX in real time.
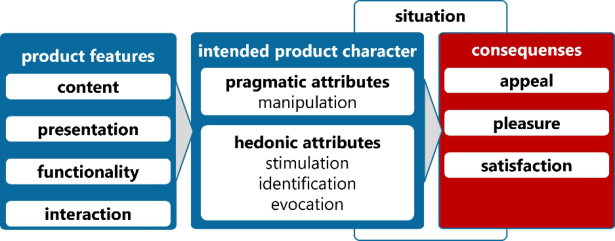
Hassenzahl, who proposed a UX model (Figure 1), stated that emotions are triggered by the product features that users receive via UX (Hassenzahl, 2010). This finding suggests that emotions are closely related to UX. Previous studies have attempted to use machine learning to estimate emotions from biometric information, which is expected to enable continuous and objective emotion estimations (Ikeda et al., 2016).
Therefore, this study aims to construct an objective and continuous UX evaluation system using emotions that are closely related to UX. To evaluate the relationship between UX and emotions as well as assess the accuracy of the machine learning model, we conducted an experiment to obtain emotions and UX ratings during advertisement and gameplay.
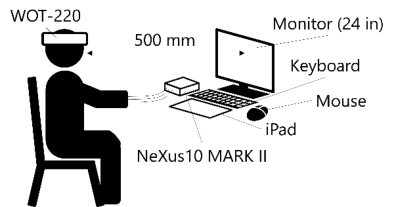
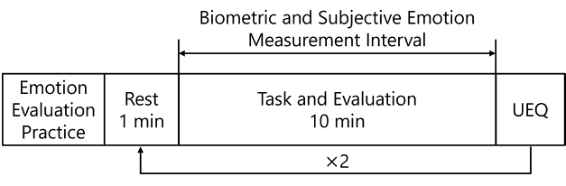
EXPERIMENT ON EMOTIONAL/UX EVALUATION DURING AD GAZING AND GAMEPLAY An experiment was conducted to evaluate the relationship between emotions and UX as well as collect data to evaluate a machine learning model. The experiment involved 10 male participants (24.3 ± 3.2 years old). The experimental setup is illustrated in Fig. 2. The participants were seated with their faces 500 mm away from a 24 in monitor. The experimental apparatus consisted of a near-infrared optical brain function device (WOT-220, Hitachi High-Technologies Corporation) that measured changes in oxygenated hemoglobin (oxy-Hb) and deoxygenated hemoglobin (deoxy-Hb) concentrations in the prefrontal cortex. This device was attached to the head, and a multi-sensor physiological measurement system (NeXus10 MARKII, MindMedia, Inc.) was attached to the non- dominant hand. Additionally, a tablet terminal (iPad, Apple) used for subjective emotion evaluation was placed near the dominant hand of the experimental collaborator. The experimental protocol is illustrated in Fig. 3. The experiment was conducted in the following order: participants first gazed at a screen displaying a cross for 1 min to clear thoughts and emotions, task and emotion evaluation, and completion of a questionnaire.
Figure 1: Hassenzahl UX model.
Evaluation of UX Using Biometric Emotion 87
EXPERIMENTAL TASKS UX is classified into four categories: anticipatory UX, which is the stage of creating the experience gained from a product; temporary UX, which is the emotional change felt during the interaction; episodic UX, which is obtained by reflecting on an experience after using a product; and cumulative UX, which is accumulated after using a specific system for a certain period. In this study, we focused on anticipatory and transient UX, assuming a short-term UX evaluation. Hence, we selected advertisements that are largely involved in anticipatory UX and games, which are considered to have large emotional changes in transient UX, as experimental tasks.
Examples of the advertisements and games used in the experiment are shown in Figs. 4 and 5. Each task had two conditions, pleasant and unpleasant, to obtain a variety of UX evaluations. Four sets of experiments were conducted. In the advertising task, 10 images were presented randomly over a 5 min period. The content targets products that are used daily, such as stationery products and detergents. To eliminate bias toward specific brands, advertisements for fictitious brands were created using generative artificial intelligence. Previous research has shown that high brightness and saturated colors, easy-to-read and concise messages, and eye-guiding placements are effective in advertisements, whereas information overload and low- contrast color schemes worsen impressions of advertisements (Nakamuta et al., 2017). Hence, a pleasant condition was created by incorporating the conditions of effective advertisements, and an unpleasant condition was created by reflecting conditions that worsened impressions. In the game task, participants were asked to play for 5 min under each condition. The
game consisted of a simple structure in which participants had to catch a ball falling from the sky by moving characters left and right. According to previous research, an appropriate level of difficulty, a sense of growth, and operability are considered elements of fun (Nakamura et al., 2018). Hence, we implemented difficulty level selection and ranking functions in the pleasant condition, whereas in the unpleasant condition, we intentionally set a delay in the loading time and low visibility owing to low contrast.
INFORMATION ACQUISITION AND ANALYTICAL METHODS In this study, oxy-Hb and deoxy-Hb, which are related to brain activation, were acquired at 5 Hz, whereas the fingertip volume pulse wave (BVP), which captures changes in blood volume, and skin conductance (SC), which captures changes in the electrical conductance of the skin, were acquired at 128 Hz. Each type of biometric data was preprocessed to remove noise caused by respiration and body movements. All biometric data were considered to be related to emotions. In this study, oxy-Hb and deoxy-Hb were selected to measure the activation state of the prefrontal cortex, which is related to emotional control (Etkin et al., 2015). Additionally, BVP, which is related to the pleasantness and unpleasantness of emotions (Ikeda et al., 2016), and SC, which is related to emotion and non-arousal (Lisetti et al., 2004), were selected.
Figure 4: Example of an advertisement.Figure 5: Example of a game.
Evaluation of UX Using Biometric Emotion 89
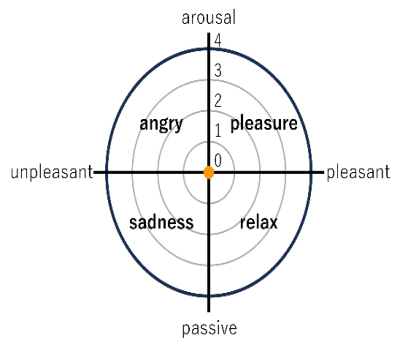
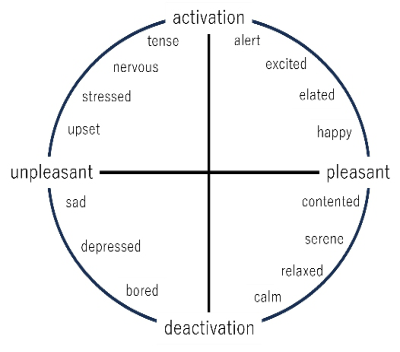
A real-time emotion subjective evaluation application was used to evaluate the emotions. The application screen is shown in Figure 6. The app displays a two-dimensional (2D) emotion model with arousal on the vertical axis and pleasantness on the horizontal axis. By moving the orange point to the appropriate position with a swipe operation, a subjective evaluation can be obtained at 1 Hz from the coordinate position. The 2D emotion model used in the application was created with reference to Russell’s circumplex model, as shown in Fig. 7 (Russell, 1980).
The information acquired represents the intensity of an emotion. The intensity is a continuous value ranging from 0 to 4. To ensure consistency among the experiment participants, 0 is defined as “not at all,” 1 is “slightly,” 2 is “a little,” 3 is “very much,” and 4 is “very strongly.” The participants were informed of these definitions prior to the experimental task. From the obtained data, we derived an emotion index for comparison with the UX index. The following three emotional indices were derived.
An index that considers the effect of time on the extent to which each emotion is aroused throughout the task.
2. Median intensity
An index that considers the intensity of each emotion throughout the task.
3. Emotion score
An index that considers both time and intensity throughout the task (product of emotion ratio and median intensity) Each index classifies emotions as pleasure/angry/sadness/relax/positive (pleasure and relaxation)/negative (anger and sadness)/arousal (pleasure and anger)/passive (relaxation and sadness).
The UX indices were evaluated using a questionnaire called the UEQ (Schrepp et al., 2017), which evaluates UX using six evaluation axes: attractiveness, perspicuity, efficiency, dependability, stimulation, and novelty. In addition to these six indices, pragmatic quality is derived from perspicuity, efficiency, and dependability, and hedonic quality is derived from stimulation and novelty.
EMOTION/INTENSITY ESTIMATION MACHINE LEARNING MODELS In this study, emotion estimation and intensity estimation machine learning models were used to estimate emotions and their intensities. Each model was created based on emotions elicited during video viewing and the corresponding biometric data, using 15 s biometric data as the input and emotions and their intensities as the outputs.
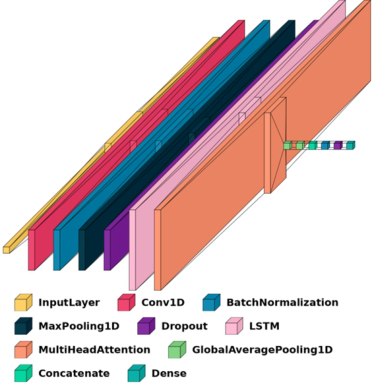
The structure of the machine learning model is shown in Fig. 8. The emotion estimation model applies Conv1D (32 filters, kernel size 3, ReLU) to each data type, and this is followed by max pooling (size 2) and dropout (0.3) to compress the features. Subsequently, a long short-term memory (LSTM) layer (64 units, tanh) was used to learn temporal dependencies, and multihead attention (4 heads, key_dim 64) was applied to highlight important features. The features from both data types were concatenated, and this was followed by batch normalization and dropout (0.4). A dense layer (softmax) was used for emotion classification. The model was optimized using Adam (learning rate of 0.0001), with categorical cross-entropy as the loss function and accuracy as the evaluation metric.
The intensity estimation model was designed to perform regression for continuous emotion intensity values. Therefore, the output layer was changed from a softmax classifier to a linear output (Dense(1, activation=“linear”)). Additionally, the loss function was changed from categorical cross-entropy to the mean squared error (MSE). The evaluation metrics included the mean absolute error (MAE), mean absolute percentage error (MAPE), and R2 score, making the model suitable for continuous intensity prediction.
Evaluation of UX Using Biometric Emotion 91
Figure 8: Machine learning model structure.
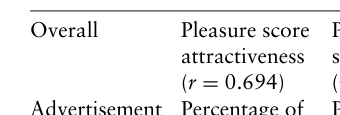
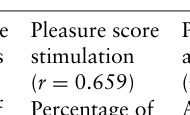
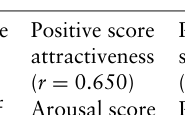
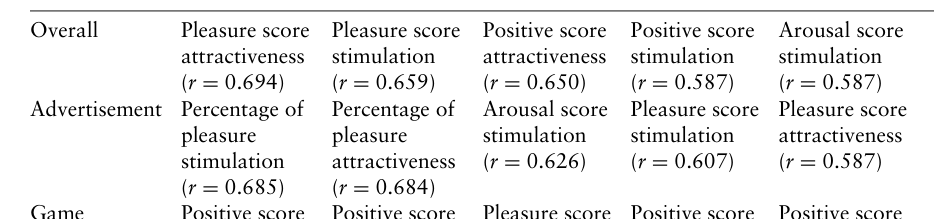
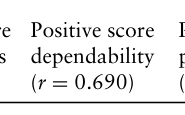
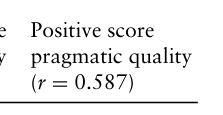
EXPERIMENTAL RESULTS Correlation coefficients between the emotion and UX indices were calculated for the overall tasks, advertisements, and games. The results are summarized in Table 1. Table 1 shows that there were many correlations with high values between emotion indices related to pleasure/positivity and UX indices related to attractiveness/stimulation. Focusing on the emotion indices, high correlations were observed between the emotion score, which considers the effects of time and intensity, and UX indices. In addition, in the upper-ranked correlations, there were relatively few indices related to negative and passive behavior.
The results of the evaluation indices for the machine learning model are presented in Tables 2 and 3. These results show that compared with using input data during video viewing, the evaluation indices significantly decreased for all indices when using input data during advertisement viewing and gameplay.
Table 1: Correlation coefficients between the emotion and UX indices.
Table available in the original PDF paper.
1 2 3 4 5
Equation reproduced from the original PDF.Equation reproduced from the original PDF.Equation reproduced from the original PDF.
Equation reproduced from the original PDF.Equation reproduced from the original PDF.Table 2: Evaluation metrics for the emotion estimation machine learning model.
Table 3: Evaluation metrics for the intensity estimation machine learning model.
Table available in the original PDF paper.
Video Advertisement Game R2 0.84 −0.90 −0.87 MAE 0.07 0.22 0.23
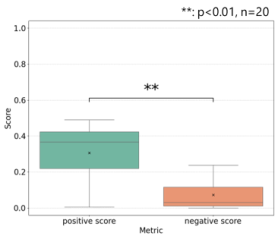
Figure 9: Scores of positive and negative (advertisement).
DISCUSSION
Regarding the relationship between emotion indices related to pleasure/positive and UX indices related to attractiveness/stimulation, Table 1 shows that attractiveness/stimulation had a positive correlation with pleasure/positive/arousal and a negative correlation with sadness/neg- ative/passive. Hence, attractiveness/stimulation is positioned on the pleasure-sadness axis in the 2D emotion model. Additionally, in Russell’s circumplex model of affect (Figure 7), on which this 2D emotion model is based, the axis corresponding to the pleasure-sadness axis is the alert/excited- bored axis. Therefore, attractiveness and stimulation are closely related to alertness and excitation.
Regarding the items that showed a correlation with the UX evaluation, the emotion score, emotion ratio, and median emotion intensity were most frequently correlated in that order. Hence, both time and intensity are important factors in UX evaluation, and the duration of emotions
Evaluation of UX Using Biometric Emotion 93
is particularly important. Therefore, maintaining a continuous positive impression and stable intensity can enhance UX evaluation.
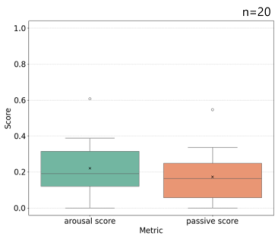
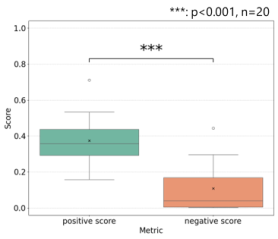
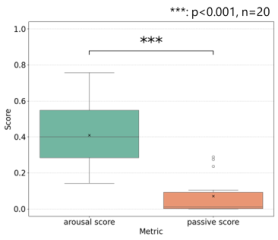
Regarding the relatively low correlation between emotion indices related to negative/passive and the UX indices, the influences of emotion indices related to negative/passive were smaller than those related to positive/arousal in the experimental tasks used in this study. Figures 9–12 and Table 4 show the results of calculating the magnitude and distribution (standard deviation) of the emotion scores for the positive/negative and arousal/passive conditions. The magnitudes and distribution of the scores were generally larger for positive/arousal than for negative/passive.
Figure 10: Scores of arousal and passive (advertisement).Figure 11: Scores of positive and negative (game).Figure 12: Scores of arousal and passive (game).
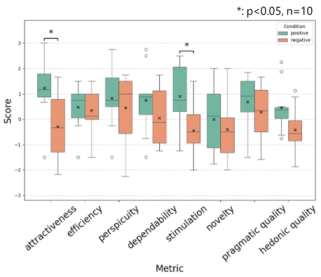
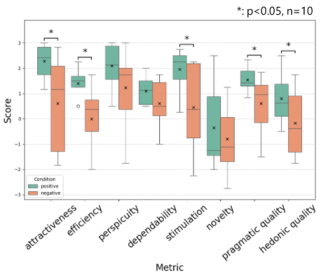
Figures 13 and 14 show the results of the UX indices in the positive and negative conditions for advertisements and games, respectively. Thus, although negative conditions tended to show lower scores than did positive conditions, the scores often did not take negative values, suggesting that the tasks did not fully induce unpleasant feelings.
Figure 13: Scores of UX indices (advertisement).Figure 14: Scores of UX indices (game).Table 4: Evaluation metrics for the intensity estimation machine learning model.
In this study, an experiment was conducted to evaluate emotions and UX during advertisement viewing and gameplay with the aims of evaluating the relationships between emotions and UX as well as collecting data with which
Evaluation of UX Using Biometric Emotion 95
to evaluate a machine learning model. Regarding the relationship between emotions and UX, many correlations were observed between emotion indices related to pleasure/positivity and UX indices related to attractiveness/ stimulation, suggesting that attractiveness/stimulation is associated with the alert/excited-bored axis. In addition, the correlations being more frequently observed in the order of emotion score, emotion ratio, and emotion intensity indicate that the maintenance of a continuous positive impression and stable intensity enhanced the UX evaluation.
Regarding the evaluation of the machine learning model, all evaluation indices decreased when using input data from advertisement viewing and gameplay compared with video viewing. Thus, the characteristics of emotions in different tasks influence the results, indicating the need to construct a model that integrates learning across various tasks. In the future, we aim to improve the accuracy of the machine learning model and develop a regression model to predict UX indices from emotion indices and thereby work toward the construction of a system for the objective and continuous evaluation of UX.
ACKNOWLEDGMENT
I also extend my sincere thanks to the laboratory members who offered a variety of insightful suggestions and to everyone who participated in the experiments.
REFERENCES
Etkin, A., Büchel, C. and Gross, J. J. (2015) ‘The neural bases of emotion regulation’, Nature Reviews Neuroscience, 16(11), pp. 693–700. Hassenzahl, M. (2005) ‘The thing and I: Understanding the relationship between user
and product’, in Funology: From Usability to Enjoyment, pp. 31–42. Ikeda, Y., Okada, K., Horie, R. and Sugaya, M. (2016) ‘A study on emotion estimation using facial expressions and biological information’, Proceedings of the Multimedia, Distributed, Cooperative, and Mobile Symposium, 2016, pp. 76–83. Lisetti, C. L. and Nasoz, F. (2004) ‘Using noninvasive wearable computers to
recognize human emotions from physiological signals’, EURASIP Journal on Advances in Signal Processing, 2004, pp. 1–16. Nakamura, M., Yokota, N. and Endo, M. (2018) ‘Qualitative analysis of elements that make games enjoyable for players’, Proceedings of the 2018 Summer Research Presentation Conference, Digital Games Research Association Japan, pp. 91–92. Nakamuta, M. and Sato, Y. (2017) ‘A study on design factors focusing on advertising
effects of outdoor advertising’, Design Research, 76, pp. 34–41. Russell, J. A. (1980) ‘A circumplex model of affect’, Journal of Personality and Social Psychology, 39(6), pp. 1161–1178. Schrepp, M., Hinderks, A. and Thomaschewski, J. (2017) ‘Construction of a
benchmark for the user experience questionnaire (UEQ)’, International Journal of Interactive Multimedia and Artificial Intelligence, 4(4), pp. 40–44.
LISTED IN THE AHFE DIGITAL BOOKSTORE CATALOGUE
Explore the complete digital volume
Affective and Pleasurable Design
Read this individual research paper free through the original publisher, or explore the full digital proceedings book.
ISBN 978-1-964867-40-3
Explore this ISBN in the AHFE Bookstore ↗Listed in the July 2026 bookstore catalogue; search by ISBN to confirm current availability · Digital book purchase optional