Masamitsu Nagayoshi, Keiichi Watanuki, Kazunori Kaede, Yusuke Osawa (2023). Effects of Different Alarm Methods of Minimum Risk Maneuver on Drivers of Following Vehicles in Automatic Driving. In: Affective and Pleasurable Design. AHFE Open Access, vol. 71, pp. 58–66. https://doi.org/10.54941/ahfe1003244
In recent years, the development of autonomous driving technology has been promoted all over the world from the viewpoint of safety and convenience. Autonomous vehicles are required to be equipped with Minimum Risk Maneuver (MRM), a function that automatically decelerates and stops while sounding a warning when the system determines that the driving behavior cannot be transferred to the driver. Although MRM protects the safety of the driver's own vehicle, the safety and security of surrounding vehicles must also be protected in order that autonomous vehicles are to be accepted by society. The development of MRMs that allow drivers to drive stress-free and with peace of mind is required. Therefore, the purpose of this study is to investigate the influence on the following drivers by the presence or absence of Alert Notification to the surroundings by using a Driving Simulator (DS) from questionnaires and motion data.As an experiment, autonomous car equipped with MRM was driving at 100 km/h on the first lane of a highway with a speed limit of 100 km/h and a road width of 3.5 m. followed the vehicle with a headway time of 2 seconds. Participants in the experiment were eight men (21.8 years ± 1.1 years old) who had a first-class driver's license for ordinary vehicles.In the experimental scene, After the Participant follow the Autonomous vehicle with a headway time of about 2 seconds, the MRM is activated and the self-driving car decelerates. This experiment was conducted under a total of 10 conditions, consisting of 5 conditions of 2.0 m/s2, 3.0 m/s2, 4.0 m/s2, 5.0 m/s2, and 6.0 m/s2, and the presence or absence of Alert Notification before deceleration. A horn was used as the notification, and the preceding vehicle continued to sound the horn while decelerating and turned on the hazard lamps.As a result, in the subjective evaluation questionnaire for the presence or absence of Alert Notification, significant differences were found at the 5 % significance level in the items of danger when the vehicle ahead braked and sense of anxiety when the vehicle ahead braked. In the comparison of the amount of brake application at different deceleration levels, significant differences were found at the 5 % level between deceleration levels of 2.0 m/s2 and 4.0 m/s2 and between deceleration levels of 2.0 m/s2 and 5.0 m/s2 in the case of no Alert Notification, but no significant differences were found when alert notification was provided. Significant differences were found in the subjective evaluation questionnaire, suggesting that the presence of Alert Notification can reduce the driver's subjective sense of danger and anxiety. In addition, the results also suggest that the presence of an ambient alert may allow the driver to brake with more time to spare.In the future, I am considering investigating the effect of the difference in Alert Notification method of the surrounding alert notification on the following driver.
Recently, the development of automatic driving technology is being promoted worldwide owing to its safety and convenience. According to the guidelines regarding Safety Technology for Automatic Vehicles in Japan, there are six levels of automatic driving, from Level 0 to Level 5, and Level 4 is already being put into practice.
The automatic driving system must be equipped with a minimum risk maneuver (MRM) function, which automatically decelerates and stops the vehicle while sounding a warning when the system determines that the driver cannot transfer the driving behavior to the system. The safety of MRM- equipped vehicles and their surrounding vehicles is ensured by the way MRM operates. However, the drivers in the vicinity may not respond to the MRM without anxiety. Therefore, there is a need to develop MRMs that allow other drivers to drive with peace of mind and without stress. The purpose of this study is to investigate the effects of stress and driving behavior on drivers of following vehicles using a driving simulator (DS), without and with MRM reminder alarm and different alarm sounds.
Effects of Different Alarm Methods of Minimum Risk Maneuver 59
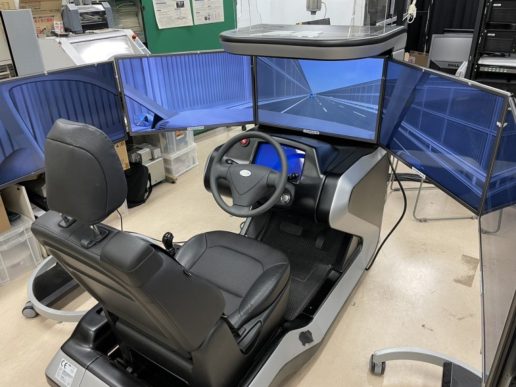
EXPERIMENT SET I: EFFECT ON DRIVERS OF CHANGES IN DECELERATION AND PRESENCE/ABSENCE OF REMINDER ALARMS A DS was used for this experiment (Figure 1). The participants included eight male subjects (21.8 ± 1.1 years old) with first grade Driver’s License. An MRM-equipped self-driving car was driving at 100 km/h in the first lane of an expressway consisting of straight lines and gentle curves, and with a speed limit of 100 km/h, three lanes in each direction, a road width of 3.5 m, and a shoulder width of 2.5 m. The participant, the driver of a manually driven car, was asked to follow the automatic car at a time interval of 2 s. The MRM operation scenario was a case in which the automatic car system detects an abnormality in the driver behavior and the driverand doesdid not respond to a request for authority transfer.
Experimental Methods The experimental DS setup consisted of the participants following the auto- matic vehicle for 2 s after which the MRM was activated, and the automatic vehicle decelerated. Five levels of deceleration (2.0 m/s2, 3.0 m/s2, 4.0 m/s2, 5.0 m/s2, and 6.0 m/s2) were considered for the experiments, and each was considered with and without the MRM reminder alarm before beginning eceleration. Thus, ten distinct conditions were created by each of these con- ditions. The reminder alarm was sounded 1.6 seconds before the start of the deceleration. A horn sounding continuously when deceleration was used to alert the drivers, and the brake light of the automatic vehicle was turned on. The deceleration rate was set based on the upper limit of 4.0 m/s2 of the dri- ver error response system (Ministry of Land, Infrastructure, Transport and Tourism Road Transport Bureau, 2018). The participants were familiarized with the experimental DS setup by practicing following of automatic car in front with an interval of 2 seconds and avoiding any accident when the car
Figure 1: Driving simulator.
in the front activates its MRM. The participants performed the experimental task after being familiarized with the setup.
In the actual experimental task, participants rested for one minute before driving and answered the two-dimensional mood scale-short-Term (TDMS- ST). The participants had to run one out of the ten conditions selected randomly. After running the test, the participants rested for one minute. Then, they again answered the TDMS-ST along with a subjective evalua- tion questionnaire. This was performed for all 10 conditions, in one trial round.
In the subjective evaluation questionnaire, participants answered the fol- lowing four items on a 7-point Likert scale: Q1: Impatience when the car ahead braked; Q2: Danger when the car ahead braked; Q3: Anxiety when the car ahead braked; and Q4: Surprise when the car ahead whistled. The questionnaire was designed such that the higher the score, the safer and less stressful the evaluation.
Results
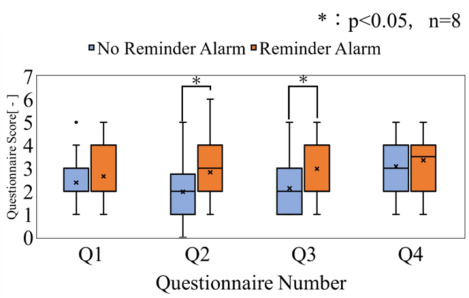
Seven of the eight participants in the experiment avoided the accident by bra- king and one by steering. Wilcoxon signed-rank test was conducted based on the results (Figure 2) of the subjective evaluation questionnaire, and signi- ficant differences were found in the responses to Q2 and Q3 at 5 % level of significance. However, no significant difference was observed between the responses to Q1 and Q4.
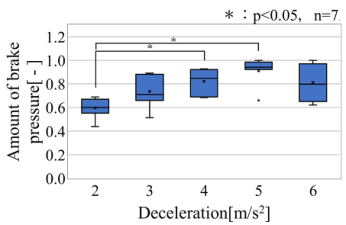
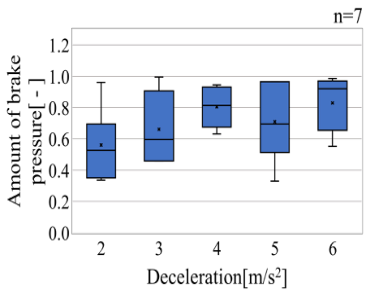
A comparison of the number of brake applications with and without the reminder alarm is shown for different deceleration rates (Figure 3, 4). The maximum amount of brake pedal pressure is set as 1. Steel–Dwass multiple comparison tests showed that there was a significant difference at the 5% level of significance between deceleration rates of 2.0 m/s2 and 4.0 m/s2 and between. deceleration rates of 2.0 m/s2 and 5.0 m/s2 in the case without reminder alarm. It also shows a significant difference between deceleration rates of 2.0 m/s2 and 6.0 m/s2 no reminder alarm. Howe- ver, no significant differences were observed when the reminder alarm was present.
Figure 2: Questionnaire evaluation.
Effects of Different Alarm Methods of Minimum Risk Maneuver 61
Figure 3: Amount of brake pressure (no reminder alarm).Figure 4: Amount of brake pressure (reminder alarm).
EXPERIMENT SET II: THE EFFECTS OF DIFFERENT WARNING TONES The results of the experiments on changes in deceleration and the presence or absence of the reminder alarm suggested that the presence of the reminder alarm reduces the driver’s subjective sense of danger and anxiety and allows the driver to come to a stop without braking suddenly. Next, we focused on the MRM sounds which can vary in different automobiles depending on the make and model of the car. We wanted to explore how the difference in sound signals can affect the driver stress and driving behavior. The purpose of this experiment was to investigate how the drivers respond to the different tones of the alarm.
Experimental Methods Twelve male subjects (22.3 ± 1.1 years old) with first grade Driver’s License participated in the experiment. The experimental setup was an expressway with a speed limit of 100 km/h, three lanes in each direction, road width of 3.5 m, and shoulder width of 2.5 m. The road consisted of straight lines and gentle curves. The participant drove at 100 km/h in a manually driven car. In the test scenario, the MRM of an automatic car traveling in front of the participant at an interval of 2 s was activated and the car slowed down.
Before the experimental task was performed, the participants were asked to listen to the four different alarms for 5 s each to familiarize them with the sounds and eliminate the effect of suddenly hearing a new sound each time the experiment is conducted. During the practice sessions on the experi- mental setup, the participants were asked to familiarize themselves with the operation of the DS and fully understand the behavior of the MRM.
When the MRM of the car in front was activated and a collision was to be avoided, the participants were instructed to decelerate by braking to avoid the collision. A questionnaire using the Temporary Mood Scale (TMS) (Tokuda, 1982) was given to them for answering, both before and after the experiment. After the experiment, they had to additionally answer a subjective evaluation questionnaire (Table 1).
Experimental Conditions The noise level inside the vehicle during driving was set to 65 dB based on a previous study (Tadaaki, 1982). In addition, for the reminder alarm con- dition, the frequency was set to 1000 Hz, and the loudness was set to 85 dB according to “The Safety Standards for Road Trucking Vehicles (Section 3), Article 219,” which sets the standard between 83 dB and 112 dB (inclusive of both values) at a vehicle position 7 m in front of the vehicle. The reminder alarm sounded 1.6 seconds before the automatic vehicle began decelerating. Under these conditions, the tone of the reminder alarm sound was changed to a sine, triangular, square, or sawtooth wave.
Results
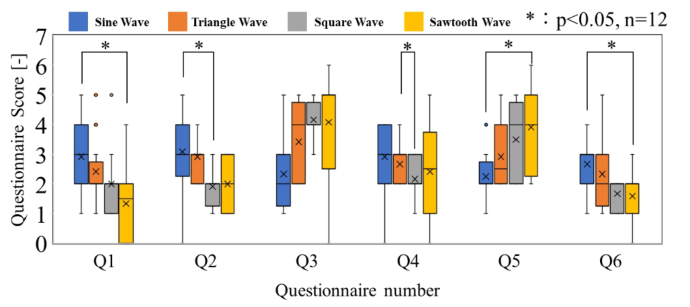
The results of the subjective evaluation questionnaire are shown in Table 2. The correlation ratio is a statistic that expresses the degree of correlation between two variables when one of the two variables is a quantitative variable and the other is a nominal measure. It takes values between 0 and 1, and the closer to 1, the stronger the correlation. Correlation ratios were calculated for each questionnaire (Table 1, Figure 5), and weak correlations were found for all questionnaire items, except Q4. A t-test was conducted, and the results were corrected using the Bonferroni method. The results showed that there was a significant difference between the conditions for each question at a 5% level of significance.
For the skin conductance (SC), SC is a measure of autonomic nervous system activity; an increase in SC indicates significant sympathetic nervous
Table 1. Questionnaire items.
Table available in the original PDF paper.
Questionnaire Q1 Surprised - Calmed down Q2 Uncomfortable - Comfortable Q3 With a sense of warning - Without a sense of warning Q4 Felt uneasy - Felt safe Q5 Not enough - Powerful Q6 Nervous - Relaxed
Effects of Different Alarm Methods of Minimum Risk Maneuver 63
Table 2. Correlation ratio results.
Table available in the original PDF paper.
Questionnaire Correlation ratio Q1 Surprised - Calmed down 0.196 Q2 Uncomfortable - Comfortable 0.245 Q3 With a sense of warning - Without a sense of warning 0.253 Q4 Felt uneasy - Felt safe 0.067 Q5 Not enough - Powerful 0.230 Q6 Nervous Relaxed 0.195
Figure 5: Section 3 questionnaire results.
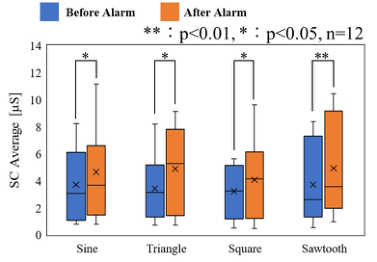
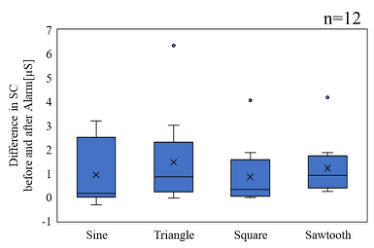
system activity and stress, while a decrease in SC indicates significant parasympathetic nervous system activity and relaxation. A t-test was con- ducted on the mean of SC of the 10-second periods immediately before and after the alarm, and the significant difference was found at the 1% level (Figure 6). Next, the difference between the means of SC of the 10-second periods immediately before the alarm and immediately after the start of the post-rest period was calculated. A t-test was conducted between the two con- ditions, and no significant differences were found after correction using the Bonferroni method.
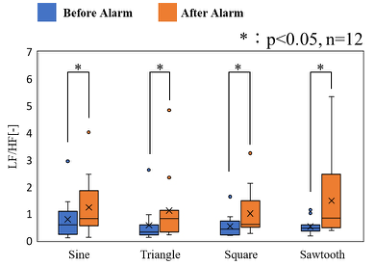
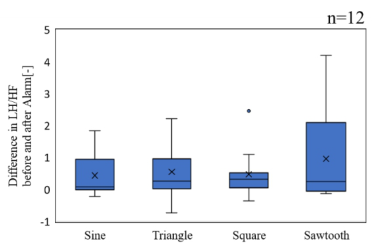
For the LF/HF, LF/HF is a measure of the autonomic nervous system; an increase in LF/HF indicates a significant sympathetic nervous system and stress, while a decrease in LF/HF indicates a significant parasympath- etic nervous system and relaxation. Figure 8 shows the results of t-tests for LF/HF for each tone in the 60 s immediately before and immediately after the alarm and in the rest periods, respectively. Significant differences were observed among all the tones. Next, for each tone, the difference in values between the 60-second period immediately before the alarm and immedia- tely after the start of post-rest was calculated. A t-test was also conducted between the tones, and the results corrected using the Bonferroni method are shown in Figure 9. No significant differences were found between the tones.
Figure 6: Comparison of SC average before and after alarm for all tones.Figure 7: Comparison of difference values of SC average before and after alarm between tones.Figure 8: Comparison of LF/HF average before and after alarm for all tones.Figure 9: Comparison of difference values of LF/HF before and after alarm between tones.
Effects of Different Alarm Methods of Minimum Risk Maneuver 65
DISCUSSION
In the Experiment Set I, significant differences were found in Q2 and Q3, suggesting that the presence of a reminder alarm reduced the subjective sense of danger and anxiety of the driver. Therefore, there was no difference in the questionnaire results based on the timing of braking by the car in front. In addition, a significant difference in the amount of braking applied was observed in the absence of reminder alarm. However, no significant difference was observed when the reminder alarm was present.
In the Experiment Set II, the subjective evaluation questionnaire given to the participants suggested that even if the frequency and loudness of the war- ning sound were similar and only the tone was different, it might have a significant effect on the driver’s emotions.
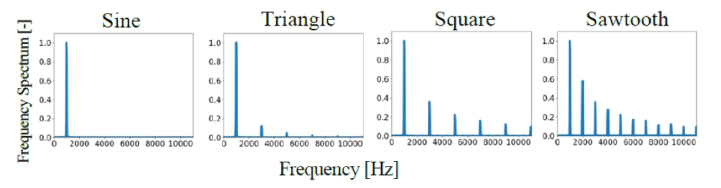
Each tone is characterized by the sine wave being rounded and inorganic, the triangular wave being slightly rounded and a little brighter, the square wave sounding like an old-fashioned game, and the sawtooth wave sounding rough and rough. Figure 10 shows the results of the fast Fourier transform (FFT) analysis of the tones used in this experiment. The sine wave had no high-frequency component, whereas the triangular, square, and sawtooth waves had more high-frequency components. From the results in Figure 5, The sine wave had little effect on the driver’s emotional responses such as “calm,” “no sense of warning,” and “not enough,” while the square wave and sawtooth wave had a significant effect on the driver’s emotional respon- ses such as “surprised,” “unpleasant,” and “powerful.” In other words, there may be a correlation between the perception of warning tones and number of high-frequency components.
The LF/HF and SC results in Figures 7 and 9 show no significant diffe- rences between the conditions. However, Figures 6 and 8 show that SC and LF/HF increased significantly before and after the sound alarm, suggesting that the drivers were stressed by the sound alarm. Therefore, it is necessary to examine the effects of differences in the loudness and frequency of sounds on driver stress, which was outside the scope of the current study.
Figure 10: Results of FFT analysis for each tone.
CONCLUSION
In this study, we investigated the influence of MRM activation on the dri- vers of following vehicles. The results suggest that the presence of an MRM alarm reduces the driver’s sense of anxiety compared with the absence of an MRM alarm. Furthermore, the outcomes also suggest that the difference in
the tone of the alarm sound has a significant effect on the driver’s emotions. In the future, we plan to examine the sensitivity of the driver to the sound by combining the tones used in this experiment.
REFERENCES
ASV (Advanced Safety Vehicle) Promotion Study Group, Road Transport Bureau, Ministry of Land, Infrastructure, Transport and Tourism (2016) Driver’s Abnor- mal Condition Response System (Deceleration Stop Type) Basic Design Document. Website: https://www.mlit.go.jp/jidosha/anzen/01asv/data/guideline_for_deadma n-system.pdf Kunieda, T., (1982), Car Interior Noise. The Journal of the INCE of Japan, Volume 6,
No. 2, pp. 59–63. Ministry of Land, Infrastructure, Transport and Tourism Road Transport Bureau (September 25, 2018) Guideline regarding Safety Technology for Automated Vehicles in Japan. Website: https://www.mlit.go.jp/common/001253665.pdf Tokuda, K., (1982). The Validity of Temporary Mood Scale, Institute of Human
Sciences, Ritsumeikan University, Volume. 22, pp. 1–6.
LISTED IN THE AHFE DIGITAL BOOKSTORE CATALOGUE
Explore the complete digital volume
Affective and Pleasurable Design
Read this individual research paper free through the original publisher, or explore the full digital proceedings book.
ISBN 978-1-958651-47-6
Explore this ISBN in the AHFE Bookstore ↗Listed in the July 2026 bookstore catalogue; search by ISBN to confirm current availability · Digital book purchase optional