In recent years, a stressful society wherein various stresses accumulate only by living has become a problem. This accumulation adversely affects our physical and mental health. In particular, psychosocial stress is considered to be related to the onset and pathology of lifestyle-related diseases such as diabetes and myocardial infarction. Recently, there has been a growing interest in the problems of increased daily mental stress and decreased productivity. Many studies have been conducted with the aim of alleviating mental stress and improving productivity. In particular, it is acknowledged that listening to music during work improves concentration and facilitates work. In addition, as the term "music therapy" indicates, it has been reported that listening to music can relieve mental stress. To further verify this effect, research is being conducted actively using various types of music. Furthermore, analysis is being performed based on a number of classification methods, such as classification based on genre, by instrument, and presence or absence of lyrics. However, the music used as representative music for these classifications also varies, and consistent observations have not been obtained. In addition, individual differences significantly impact the effectiveness of music listening. This problem has prevented the acquisition of consistent observations. Solving the above two problems, (complexity of classification and individual differences, will be very) is highly important for gaining new knowledge regarding music therapy and, beyond that, in relieving daily stress and improving productivity. Machine learning classification is effective in addressing the complexity of music. The structure of music has rules such as musical scales, chord structures, and chord progressions based on music theory. It is considered feasible to analyze the structure using methods such as machine learning. In addition, incorporating biometric information into the parameters is considered effective for solving the problem of individual differences. A previous study of emotion induction using music reported that the accuracy of the linear regression model was exceeded by incorporating EEG information into the parameters of the generative model. Therefore, in this study, we utilize "machine learning" (which is good at classification) and personalization by "biometric feedback" to construct a personalized music generation model for alleviating mental stress and improving productivity. The target tasks are VDT tasks. The demand for these has been increasing recently with the introduction of work-at-home, IoT, and DX, etc. VDT tasks are tasks performed on a PC or other devices on a display Although these enable working without time or place constraints, these are considered to be a cause of the progression of a stressful society because individuals cannot leave their work. Listening to music generated by the model constructed in this study is likely to alleviate daily mental stress and improve productivity.
In recent years, an interest in stress reduction and suppression has grown against the backdrop of a stressful society. It has been confirmed that the number of workers’ compensation cases for mental disorders is actually on the increase due to the progression of a stressful society (Mizushima and Honma, 2023). To consider countermeasures against stress, under- standing the level of stress is important; for this, stress estimation using machine learning has been used. In a previous study on stress estimation (Suzuki and Sato, 2020), a driver was assumed to be driving in the absence of external stimuli, such as listening to music, and the stress and relaxation states were estimated with an accuracy rate of ∼73% using an index based on the heart rate variability. However, in recent years, increasing number of people have started listening to music while working owing to the diversi- fication of work styles and spread of music players. In addition, the effects of listening to music on stress suppression (Kikuta, 2010) and motivation to work (Abe and Aragaki, 2010) have been confirmed, indicating that listening to music is closely related to stress changes among workers. Therefore, this study was aimed at estimating the increase or decrease in stress among people who listen to music while working. In this study, we focused on the “tempo”
of the music. Tempo is the most important factor affecting the impression of music (Ralph, 1935), and listening to “beat sounds” with a strong tempo component has been confirmed to have a stress suppression effect (Kamise, 2022). However, these previous studies did not take into account individual differences in music preference and music listening habits, and the large influ- ence of these individual differences is considered to be an issue. In this study, we considered the extraction of features that include individual differences to be effective for this issue, and we used machine learning to construct a model for estimating the increase or decrease in the stress of workers, while listening to beat sound.
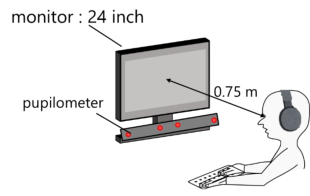
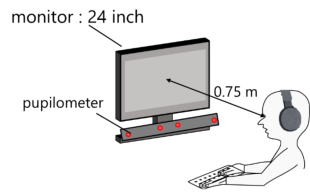
An Experiment to Obtain Biometric Information of Workers While Listening to a Beat Sound A dataset was created to construct a model for estimating the increase/de- crease in the stress of a worker while listening to sound. The experimental flow and setup are shown in Figures 1 and 2, respectively. Six male students in their 20s participated in the experiment. The participants were seated with their heads fixed 75 cm from the monitor while listening to beats through headphones. The experiment was explained to the participants and their con- sent was obtained prior to the experiment. No compensation was paid for participation in this study. During the experiment, the pupil diameter and heart rate of the participants were measured using a gaze meter (Tobii Pro Spectrum, manufactured by Tobii Technology) and a multiorganization mea- surement sensor (WEB-1000, manufactured by Nihon Kohden). The target task was a text input task, in which all the task sentences written in Japanese were typed in hiragana, as shown in Figure 3. The tempo of the beats was set as the experimental condition. A total of seven experimental conditions were set, where the participants were asked to listen to beats of 30–210 BPM with an increment of 30 BPM. The set BPM encompassed the BPM of commonly heard music.
Estimation of Worker Stress Considering Differences in Listening Tempo 39
Before the experiment, participants were asked to respond to a subjective questionnaire regarding their music preferences and music listening habits. The items were: frequency of “Do you usually listen to music in your daily life” five-point grading scale, frequency of “Do you usually listen to music while working” to five-point grading scale, and tempo of “Tempo of music you usually listen to” to six-point grading scale. The respondents were asked to respond to six-point grading scale “the tempo of the music I usually listen to.” The BPM condition set in this study was used as a boundary crite- rion for the tempo stage, where 30 BPM and ≥210 BPM were not used as a boundary for the stage owing to their rarity. The data on the question- naire results were converted into dummy variables (referred to as Q-results in this paper).
Analysis and Data Preprocessing Methods Pupil Diameter
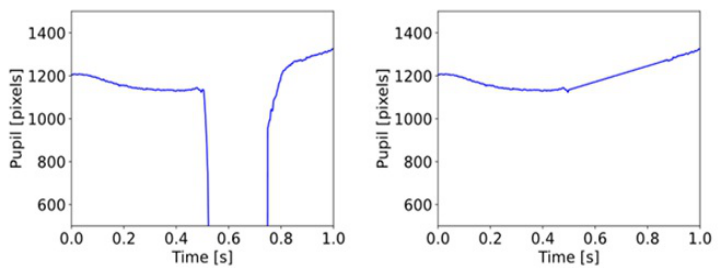
Pupil diameter is a biological parameter controlled by the autonomic nervous system (Hara, 2012). It was used as an index of stress in this study. Mydriatic pupils indicate a state of stress (tense state), and contracted pupils indicate a state of relaxation (restful state). In addition, pupil diameter data require processing of missing data due to blinking. In this study, we detected the blinking eye from the fluctuation before and after the missing pupil diameter data (Ronen, Avishai and Noga, 2018) and linearly interpolated the pupil diameter data during eye blinking, as shown in Figure 4. In this study, the stress value was defined as the pupil diameter during the task minus the pupil diameter at rest, and a negative value was classified as class 0 (low-stress group) and a positive value as class 1 (high-stress group).
Figure 3: Experimental tasks (problem statement and sample responses).
Figure available in the original PDF paper.
Figure 4: Blink interpolation processing image.
Electro-Cardiogram (ECG) An electrocardiogram is an index that records the electrical activity of the heart and can be expressed as heart rate or analyzed as heart rate variability to treat it as an index of autonomic nervous system activity. In this study, the noise caused by respiration and body movements was removed and used as the heart rate data.
Entire Data Set As the data scales were variable, standardization was performed to unify data scales.
Model Building and Performance Evaluation Methods We used neural networks to construct a model for estimating the increase or decrease in the stress of a worker while listening to sound. A two-class classification model was constructed to estimate whether stress increases or decreases. Neural networks are multilayered and can hierarchically extract features. A neural network can also model nonlinear functions and is a learn- ing method that excels in nonlinear relationships and pattern learning. The structure of the model is shown in Figure 5. The input and output layers are both one layer. We developed a two-class classification model; therefore, a sigmoid function was used as the activation function of the output layer. The hidden layer consisted of two fully-coupled layers, and the ReLu func- tion was used as the activation function for all bonded layers. The binary cross-entropy was used as a loss function, and the optimization method was Adaptive Moment Estimation (Adam), which combines the momentum and Root-Mean-Square Propagation (RMSProp). The confusion matrix, Receiver Operatorating Characteristic curve (ROC), and Area Under the Curve (AUC) were used to evaluate the performance of the model.
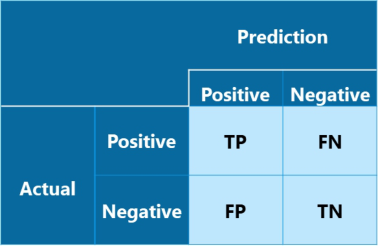
Confusion Matrix The confusion matrix is a square matrix, as shown in Figure 6, and is used to evaluate the model performance in machine-learning classification problems. For each element, we denote Positive if the actual value is positive, Negative if the actual value is negative, True if the prediction of the agrees with the actual value, and False otherwise. The outcome was TP if the model correctly pre- dicted the actual value as Positive. It was FP if the model incorrectly predicted the actual value as Positive. Conversely, it was FN if the model incorrectly pre- dicted the actual value as Negative, and TN if the model correctly predicted the actual value as Negative.
Figure 5: Model structure.
Figure available in the original PDF paper.
Estimation of Worker Stress Considering Differences in Listening Tempo 41
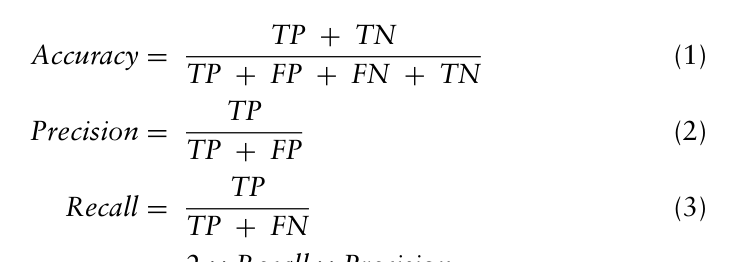
The confusion matrix summarizes the results in tabular form. Using this confusion matrix, the model performance can be evaluated in more detail by calculating the indices using formulae (1)–(4), where Accuracy is the percent- age of correct responses among all predictions, Precision is the percentage of correct responses among those predicted as Positive, and Recall is the per- centage of correct responses among the actual responses. F1 is the harmonic mean of Precision and Recall. For example, in the case of a model that esti- mates the presence of cancer based on a radiograph, a high Recall value is required because the risk of missing a cancer even though it is actually present is higher than the risk of incorrectly pointing out a cancer even though it is not present. Thus, the confusion matrix and the four values calculated from it indicate the relationship between the model predictions and actual class labels.
Equation reproduced from the original PDF.
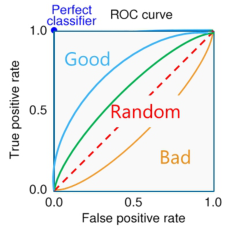
ROC Curve, AUC The ROC curve visualizes the relationship between the true positive rate (TPR) and false positive rate (FPR), as shown in Figure 7, where TPR is the percentage of correctly identified positives that were actually positive, and FPR is the percentage of incorrectly identified positives that were actually negative. FPR is the percentage of cases incorrectly judged as Positive when being actually Negative. Using these indices, the ROC curve evaluates the model performance at different thresholds and helps determine the correct balance. AUC stands for the area under the curve and represents the area under the ROC curve; AUC takes values from 0 to 1. AUC = 0.5, when the model randomly assigns data, and the closer the maximum value to 1, the
Figure 6: Confusion matrix.
better the classification ability of the model. As a rule of thumb, AUC ≥0.9 indicates a very good classifier, ≥0.8 a good classifier, ≥0.7 a satisfactory classifier, ≥0.5 a poor classifier, and <0.5 the opposite, showing lesser than random classification performance.
Result and Discussion
Among the two models constructed, in Model 1, the BPM of the sound heard (hereinafter referred to as Beat BPM) and the value obtained by subtracting the normal heart rate from the heart rate during the experiment (hereinafter referred to as heart rate (task-rest)) were set as explanatory variables. In Model 2, the Q-results were added to the explanatory variables in Model 1.
Model 1 (Explanatory Variables: Beat BPM, Heart Rate (Task-Rest))
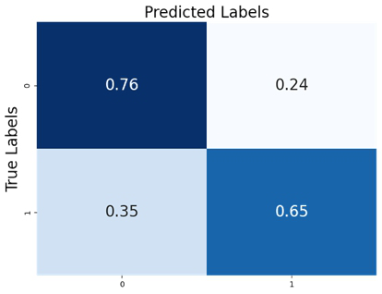
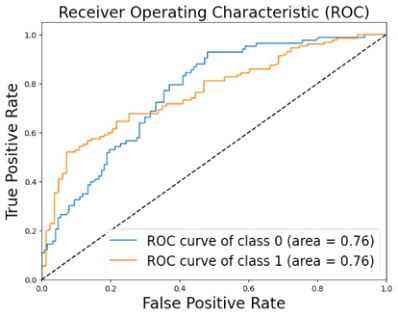
Figure 8, Table 1, and Figure 9 show the confusion matrix, four indices cal- culated using the confusion matrix, and ROC curve for Model 1, respectively. The lower-right panel in Figure 9 shows that the AUCs for class labels 0 and 1 were approximately 0.76. This indicated that the model could roughly esti- mate the increase or decrease in stress. However, according to the results in Table 1, data that should be class 1 (high-stress group) were often misclassi- fied as class 0 (low-stress group). In addition, the number of samples for each label was slightly skewed, indicating a room for improvement.
Figure 7: ROC curve.Figure 8: Confusion matrix of model1.
Estimation of Worker Stress Considering Differences in Listening Tempo 43
Table 1. Model1 performance evaluation metrics.
Table available in the original PDF paper.
Label Precision Recall F1 Number of samples
0 0.59 0.76 0.66 83 1 0.81 0.65 0.72 127
Figure 9: ROC curve of model1.
Model 2 (Explanatory Variables: Beat BPM, Heart Rate (Task-Rest), Q-Results)
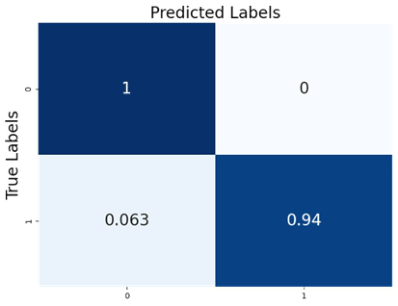
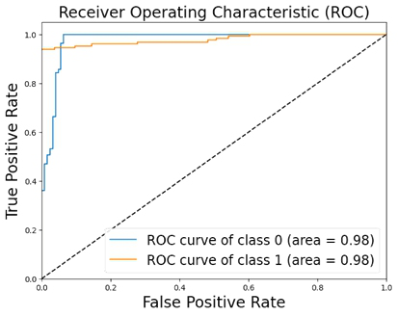
Figure 10, Table 2, and Figure 11 show the confusion matrix, four indices calculated from the confusion matrix, and ROC curve of Model 2, respec- tively. According to Table 2, all four indices calculated from the confusion matrix were high for both classes 0 and 1. The lower-right panel in Figure 11 indicates that the AUC for both class labels 0 and 1 was approximately 0.98. Therefore, this model could estimate an increase or decrease in stress with high probability. However, owing to the question of whether music prefer- ences and listening habits affected the results to this extent, we rechecked the details of the data. Consequently, we found a large amount of data of several individuals to correspond to one of the classes, suggesting the possi- bility of class individualization. Therefore, estimating increases or decreases in stress is possible by identifying individuals from the data. Model 1 with thin individual identifiers exhibited a medium level of classification perfor- mance, whereas Model 2 with strong individual identifiers exhibited very high performance. Issues related to class gerrymandering can be attributed to the small number of participants in Experiment (6) and the fact that music preferences and habits are important factors in explaining individual differ- ences and also strongly associated with individuals. To solve this problem, increasing the diversity of the dataset is necessary by increasing the num- ber of participants in the experiment rather than acquiring more data per participant.
In this study, we conducted an experiment to obtain biometric information of workers who listened to beats with headphones while typing sentences. The experiment was aimed at constructing a model to estimate the increase or decrease in stress in workers who listened to sounds. In addition, we admin- istered a questionnaire survey on music preferences and listening habits. Consequently, we constructed a model with AUC ≈0.76, which roughly esti- mated the increase or decrease in stress. However, the model can be improved further in terms of reducing the misclassification tendency and bias in the number of samples. The model with music preference and listening habits
Estimation of Worker Stress Considering Differences in Listening Tempo 45
added as explanatory variables showed a very high classification perfor- mance; however, the results indicated a possibility of class labeling, indicating the need to improve the diversity of the dataset. Expanding the dataset to increase diversity is expected to improve the validity and classification perfor- mance of the model. Although the two model we constructed could estimate the increase/decrease in stress for the most part, it could not evaluate the work performance. In the future, constructing an estimation model of work perfor- mance and combining it with the stress increase/decrease estimation model is expected to lead to the proposal of a BPM system that can reduce stress and improve performance. This model will contribute to the improvement of daily work productivity.
REFERENCES
Abe, Mami and Aragaki, Noriko. (2010). The Effect of the Tempo of background music on Work Efficiency, Proceedings of the Conference of the Cognitive Science Society of Japan Volume 27, No. 3. pp. 853–859. Hara, Naoto. (2012). Pupillary function as stress assessment, Science of Vision
Volume 33, No. 2. pp. 47–51. Kamise, Kana. (2022). Research on psychological and physiological effects of listening to sound tempo, Proceedings of the Chugoku-Shikoku Psychological Society Volume 51. Kikuta, Fumio. (2010). Effect of Background Music that Reduces Mental Stress in
Working with Computer, Minutes of St. Luke’s University of Nursing Volume 36. pp. 91–96. Mizushima, Yasuo and Honma, Kenji. (2023). Status of Workers’ Accident Compensation for Cases of Brain and Heart Disease, Ministry of Health, Labour and Welfare pp. 1–12. Ralph H, Gundlach. (1935). Factors determining the characterization of musical
phrases, The American Journal of Psychology Volume 47. pp. 624–643. Ronen, Hershman. Avishai, Henik and Noga, Cohen. (2018). A novel blink detection method based on pupillometry noise, Behavior Research Methods Volume 50, No. 1. pp. 107–114. Suzuki, Iori and Sato, Fumiaki. (2020). Stress estimation based on heart rate variabil-
ity detected by wearable devices, IPSJ SIG Technical Report Volume 88, No. 30. pp. 1–7.
LISTED IN THE AHFE DIGITAL BOOKSTORE CATALOGUE
Explore the complete digital volume
Affective and Pleasurable Design
Read this individual research paper free through the original publisher, or explore the full digital proceedings book.
ISBN 978-1-958651-99-5
Explore this ISBN in the AHFE Bookstore ↗Listed in the July 2026 bookstore catalogue; search by ISBN to confirm current availability · Digital book purchase optional