Ryoya Oba, Keiichi Watanuki, Kazunori Kaede, Yusuke Osawa (2023). Feature Selection for Machine Learning-Based Core Body Temperature Estimation Using Hand-Measurable Biological Information. In: Emerging Technologies in Healthcare and Medicine. AHFE Open Access, vol. 116, pp. 107–117. https://doi.org/10.54941/ahfe1004362
Core body temperature (CBT) is an important health indicator that denotes the temperature of the body core, and maintains brain and organ function. Invasive methods of CBT measurement pose challenges in assessing and monitoring human health. To address this, estimation of tympanic membrane temperature using multiple biological parameters often referenced for CBT has been attempted in previous studies. Our research focused on machine learning-based CBT estimation using hand-measurable biological data. Furthermore, while various studies have investigated machine learning models and the impact of information acquisition environments, few have compared the estimation accuracy of different biological parameters or assessed optimal feature combinations. Our proposed method entails the evaluation of indices in both normal scenarios with all variables and patterned scenarios with varying combinations of reduced explanatory variables. The comparison results reveal that when estimating the CBT based on skin conductance and pulse wave intervals excluding skin temperature, the mean absolute error, coefficient of determination, and root mean square error were 0.17 °C, 0.71, and 0.24 °C, respectively. This suggests that our approach is a feasible CBT estimation method that does not rely on skin temperature, although accuracy concerns persist. Furthermore, the estimation of the difference between CBT and skin temperature suggests that the estimation method may have accounted for individual variations within the data. Implementing the proposed method in increasingly popular smart rings and watches could facilitate the acquisition of CBT in daily life.
Core body temperature (CBT) is the temperature of the body core, includ- ing the brain and organs, and is an indicator of circadian rhythms. Recent research has revealed the correlation between CBT and daily biological rhythms, highlighting the importance of consistent CBT monitoring in our increasingly diverse modern lifestyles.
CBT is measured by inserting a thermometer into a body cavity, such as the rectum or sublingual cavity; however, this method is invasive and imposes a major physical burden on patients. Non-invasive methods for CBT mea- surement involve the use of sensors that operate via the heat flux method. Although these sensors can accurately measure fine fluctuations in the CBT, they are not widely used and are expensive and time-consuming to install.
To address these issues, numerous attempts have been made to estimate the tympanic membrane temperature, a CBT index, using multiple biomet- ric data. In a study on estimation using this method in a hot environment, the CBT was estimated by obtaining the metabolic rate based on the heart rate and skin temperature. Another study on CBT estimation using the same method was performed by obtaining biometric information from sensors worn during exercise, accounting for various exercise loads. In another study, thermal images obtained using an infrared thermography camera were used to build a machine learning estimation model. Using a simple thermal imaging camera as an example, a CBT estimation model was constructed by learn- ing a combination of the body surface temperatures of the forehead, cheeks, neck, and other facial regions, as well as the ambient temperature and body mass index. However, CBT estimation using models of heat transfer inside and outside the body involves many parameters and is often computationally time-consuming, making it impractical. Although thermal imaging cameras can make noncontact measurements and are becoming increasingly smaller, they remain uncommon and are not intended for everyday use by consumers.
Therefore, we believe that it is important to obtain biometric informa- tion without the need for complex calculations or large-scale equipment. The main objective of our research is to estimate CBT via machine learning using biometric information that can be measured from the hand. In the proposed method, the hand skin temperature (ST), skin conductance response (SCR), and blood volume pluse (BVP) measured by sensors attached to the fingers and palms were used as explanatory variables, and support vector regression (SVR), a machine learning method, was employed. During preprocessing, fea- tures were extracted based on the peak to peak interval (PPI) derived from the BVP. Furthermore, because the acquired biometric information showed temporal variations, lags were considered as explanatory variables. Although many studies have focused on machine learning models and environmen- tal changes in which biological data are collected for CBT estimation, few have compared the estimation accuracy of different biological parameters or evaluated the optimal combination of features. Therefore, in this study, we compared the estimation accuracy in the standard conditions using three explanatory variables and a pattern in which the number of features was reduced and the combination of features varied.
Feature Selection for Machine Learning-Based Core Body Temperature Estimation 109
MULTIVARIATE DATASETS OF A BIOLOGICAL INFORMATION IN PREDICTING CBT According to Gagge’s two-node model, many biological indicators can be used to obtain the CBT. Among them, skin blood volume, which changes based on perspiration and pulsation, is significantly related to the dissipa- tion and production of heat in the human body and can be easily obtained from the hand, as in our proposed method. In this study, ST, SCR, and BVP served as biometric information, constituting a multivariate dataset from the perspective of heat transfer in the human body.
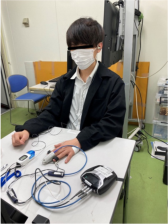
Figure 1 shows the environment used in the experiment. The experimental subjects were 10 healthy Japanese males in their twenties, and the training data for the proposed method were collected. The experiment was conducted in a room with an average temperature of 25
C and an average humidity of approximately 50%. The participants remained seated and at rest for 15 min, avoiding any activity that would cause a sudden change in CBT. The purpose of the experiment was explained to the participants and informed consent was obtained in advance. This study was approved by the Ethics Committee of Saitama University (approval number: R4-E-53).
ST, BVP, and SCR were measured using a multi-physiological measurement system (NeXus10 MARK II). The CBT, which is the true value, was measured using a continuous-measurement ear infrared thermometer (BioLog).
The acquired biological data was pre-processed based on BVP. Thermoreg- ulation of the human body is governed by the autonomic nervous system, which consists of sympathetic and parasympathetic nerves. The central ner- vous system, which regulates cardiac function, alters the heart rate and blood pressure via autonomic nerves to regulate body temperature according to the situation. Heart rate variability is one of the most frequently used biologi- cal metrics in autonomic nervous system analysis, and is based on the R-R Interval (RRI)—the interval between the R wave (the peak point on the elec- trocardiogram) and the next R wave. Because the autonomic nervous system is related to the body temperature regulation mechanism, feature extrac- tion based on the RRI is considered effective for CBT estimation. However, because it is difficult to obtain this information from a hand-worn sensor, we used the PPI calculated from the BVP instead of the RRI. Although the two are not strictly identical, examples of autonomic nervous system evalu- ation using pulse rate variability instead of heart rate variability have been reported.
Additionally, the peak wave (a-wave) value obtained from the BVP was used as a feature value for training. Because this is synonymous with the wave generated by the difference between systolic and diastolic blood pres- sure (pulse pressure), BVP can be paraphrased as a vascular propagating wave of pulse pressure.
Because the wave indicates the rising edge of the propagating wave, it is considered to have a high correlation not only with the timing of pulse pres- sure changes but also with the contractility of the heartbeat, which is related to fluctuations in the blood flow rate. As mentioned above, because body temperature is regulated via adjustment of the heart rate and blood pressure, the wave is expected to be a characteristic quantity that effectively explains CBT.
Figure 1: Example of measuring biological data.
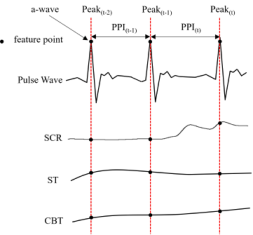
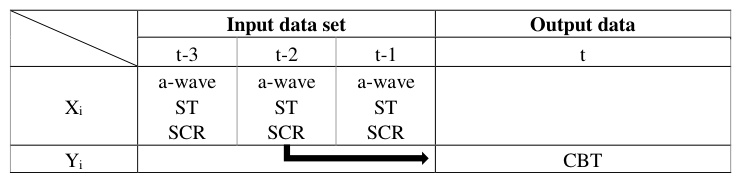
Therefore, in this study, three variables, a-wave, ST, and SCR, were used as feature values when the pulse-wave peak point occurred (Figure 2). Subse- quently, lags were considered as explanatory variables to reflect the temporal variability and patterns of the extracted biological data. Lagged features involve the use of historical data as input variables to consider the time-series characteristics. As shown in Table 1, we used time-series data from t-3, t-2, and t-1 for the predicted value of the t-th CBT for a total of nine features as input variables.
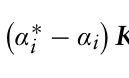
BUILDING THE MACHINE LEARNING MODEL USING HAND-MEASURABLE BIOLOGICAL INFORMATION Because the temperature of the deep layer, the region of the body where the CBT exists, is affected by temperature changes in multiple thermoregulatory mechanisms, the relationship between body surface temperature and CBT is nonlinear. Therefore, SVR was used as the machine learning method in this study. SVR is considered an effective learning method for estimating CBT because it can construct a nonlinear regression model using the ker- nel method. It is a machine learning method that applies a support vector machine, represented by the kernel method, to the regression problem. The SVR regression equation is shown in Equation (1).
Equations and mathematical formulas are available in the original paper PDF.
α∗
f(x) =
K(xi xj) + b (1)
Equation reproduced from the original PDF.Figure 2: Extraction of feature values.
Feature Selection for Machine Learning-Based Core Body Temperature Estimation 111
Table 1. Lag features.
where α∗
i and αi are Lagrange multipliers, which are trained to fall within the range 0 ≤α∗
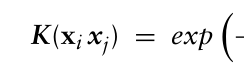
i ≤C and 0 ≤αi ≤C; C is the regularization factor, a hyperparameter to adjust the model complexity; and K(xi xj) is a kernel function representing the inner product, as shown in Equation (2).
T (2)
xj
K(xi xj) = φ (xi) φ
where φ represents a nonlinear mapping. The SVR learns by transforming explanatory variables into a linear problem through nonlinear mapping. In this case, an inner-product calculation for the transformed data is required. The higher the dimensionality of the space, the more complex the compu- tation becomes; however, learning can be facilitated by replacing Equation (2) with an arbitrary function that satisfies positive stationarity. Various functions can be substituted for the kernel function, with typical examples including linear, polynomial, and Gaussian kernels (RBF). In this study, the RBF shown in Equation (3) was used. RBF is a kernel function that excels in nonlinear data analysis, and γ is a hyperparameter.
−γ
(3)
Equation reproduced from the original PDF.
xi −xj
2
SVR reduces the error between the objective variable y and regres- sion model f(x) for the training data using the loss function rε shown in Equation (4).
y −f (x) −ε
ε ≤y −f (x)
Equations and mathematical formulas are available in the original paper PDF.
0
−ε ≤y −f (x) < ε
Equations and mathematical formulas are available in the original paper PDF.
(4)
−ε
y −f (x)
y −f (x) < −ε
[Equation or mathematical symbol available in the original paper PDF]
The ε is the sensitivity coefficient. Equation (4) reduces the amplitude of the loss value compared to the least-squares method, which uses the squared error as the loss function, and thus prevents the overestimation of out- liers. Moreover, because there is no penalty for errors below ε, a nonlinear regression model that considers random noise in the data can be constructed.
EVALUATION METHODS AND METRICS Many studies on CBT estimation have compared estimation accuracy when the environment in which biological data are collected varies, and many studies have examined learning model methods. However, few studies have evaluated combinations of features and compared the estimation accuracy for each feature. Therefore, to evaluate the estimation accuracy, we com- pared the evaluation indices when one of the explanatory variables (ST, SCR,
or a-wave) was reduced. The timing of feature extraction was based on PPI, and the features were lagged. The explanatory variables ST and CBT repre- sent temperature, and because of their numerical proximity, the correlation between them is considered to be significantly high. Therefore, to consider the possibility that CBT is learned based on ST, we used the difference between CBT and ST as the objective variable rather than CBT alone and examined patterns in which the influence of ST was eliminated.
The dataset used in this study was 11814, 80% of which was training data and 20% was test data to check accuracy. The three hyperparameters, C, γ , ε were cross-validated in 5 parts from {10−2, 10−1, 100, 101, 102} and the optimal parameters were selected by grid researching the hyperparame- ters. The model with the lowest mean absolute error (MAE) among the five validated models was selected. The MAE, root mean square error (RMSE), and coefficient of determination (R2) were used as indices to evaluate the CBT estimation results. Smaller MAE and RMSE values indicated a more accurate model.
RESULTS
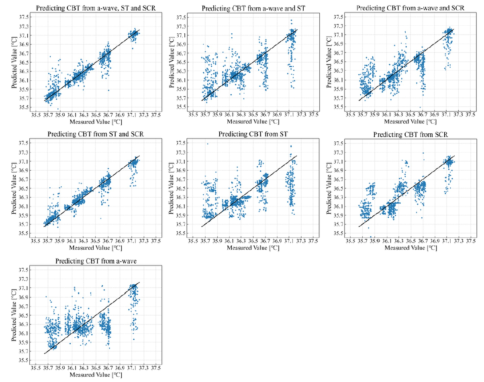
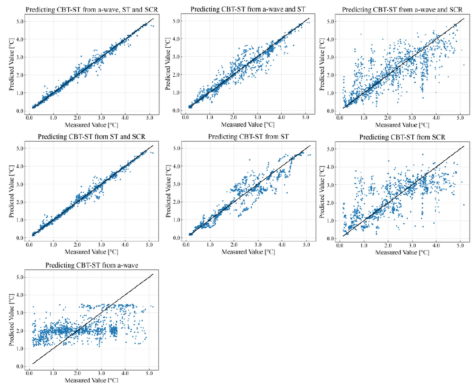
The learning results of the CBT estimation model were calculated based on the test data. Tables 2 and 3 show the evaluation indices for each feature and objective variable. Figure 3 shows the scatter plot when CBT is the objective variable, and Figure 4 shows the scatter plot when the difference between CBT and ST is the objective variable.
Regardless of the target variable, the results when all features were used showed the highest estimation accuracy, whereas the combination of ST and SCR showed the second highest estimation accuracy after learning with all features. Overall, the estimation models with a-wave features exhibited higher accuracy. However, learning with only the a-wave as a feature showed significantly lower accuracy.
When CBT was used as the objective variable, all feature combina- tions with SCR yielded robust evaluation results. Estimation from sin- gle features had the lowest accuracy for ST, whereas estimation from other features also had a low overall coefficient of determination. How- ever, when the difference between CBT and ST was used as the objective variable, all feature combinations using ST showed excellent evaluation results.
Table 2. Evaluation results of the CBT estimation model for each feature.
Table available in the original PDF paper.
Feature Object Variable Hyperparameter Evaluation Function C γ ε MAE [
Figure 3: CBT estimation results for each feature.Figure 4: CBT-ST estimation results for each feature.
DISCUSSION
According to the learning results, the highest estimation accuracy was obtained when ST, SCR, and a-waves were used, suggesting that feature extraction based on PPI and datasets using a-waves related to myocardial contractility may be useful for CBT estimation. As CBT is typically 0.5–1
C higher than ST, it is practically acceptable to be able to estimate it with MAE less than 0.1.
Furthermore, the estimation accuracy was high when ST and SCR were used as explanatory variables. Because the accuracy of both variables cannot be said to be good when they are used alone as explanatory variables, the information necessary for the estimation is extracted as features when the two are combined.
Moreover, when the CBT is estimated from the SCR and a-waves, the MAE is 0.17
C. Although accuracy remains an issue, CBT can be estimated with- out using ST. This experiment was conducted under steady-state conditions, and it was assumed that the priority of features based on temperature change was low. Therefore, the applicability of this study is likely to be limited; how- ever, estimation from information excluding ST is also considered effective under steady-state conditions.
Table 4 shows the MAEs of previous studies that estimated the same tympanic membrane temperature as that used in this study using the CBT.
As shown in Table 4, estimations using the proposed model had smaller error than those reported in previous studies. However, the environment in which the biometric information was obtained differed from that of the present study, and we need to prove the effectiveness of the model in all environments in the future.
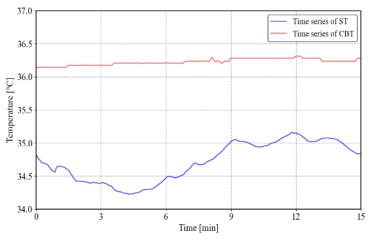
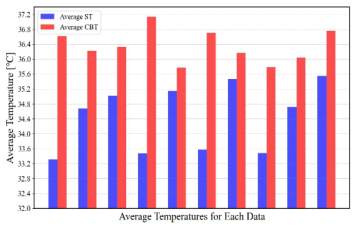
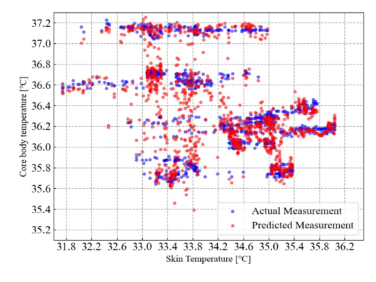
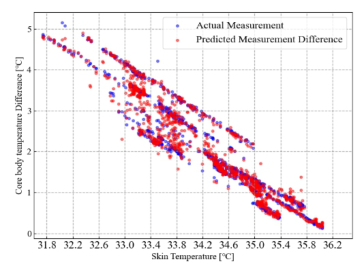
Finally, based on the results with the best estimation accuracy for each objective variable, we verified whether the model was linearly learned with respect to ST. Figure 5 shows the 15-min change in ST and CBT for one exper- imental collaborator, and Figure 6 shows the average ST and CBT for each of the 10 collaborators. Figures 7 and 8 show the scatter plots of the estimated and measured values of ST and each objective variable during learning, with all features as explanatory variables.
Table 4. Comparison with previous studies.
Table available in the original PDF paper.
MAE [
C] Biological information Acquisition environment Estimation method
0.13
Facial skin temperature, BMI, Ambient temperature
Linear multiple regression
Daily environment (when in the same place for more than 30 minutes)
0.18
Sensitivity analysis, SVR
Facial skin temperature Laboratory (Data acquired over a period of one year)
0.24
Diverse exercise load conditions
Gagge’s 2-node model
Skin temperature, heartbeat count, ambient temperature, humidity, environmental information (sunlight, wind, effect of hydration)
Feature Selection for Machine Learning-Based Core Body Temperature Estimation 115
Figures 5 and 6 show that CBT was almost constant in relation to ST fluctuations and that the difference between ST and CBT showed significant individual differences.
Figure 7 shows that CBT distribution was constant over the ST distribution range, and clusters were observed at the plot points. These clusters were likely to be plots for the same person. Furthermore, according to the estimation results shown in Table 2, the accuracy of CBT estimated from ST alone was low, suggesting that the features for identifying clusters were extracted from explanatory variables other than ST to estimate CBT.
Figure 8 shows that the difference between CBT and ST was estimated from the distribution range of ST, and the tendency of the variables ST and stationary CBT was more pronounced. ST and the difference (CBT-ST) were correlated, and clusters such as those identified in Figure 7 were no longer present. Therefore, it is possible that in the difference estimation, the ST features became larger and that features other than those related to the iden- tification of clusters were also extracted in the learning process. Furthermore, as the estimation varied within the range of ST from 33.0 to 34.2
C in both cases, and that the stationarity of CBT may have affected the learning results, further study is needed in environments where large CBT temperature fluctuations occur.
CONCLUSION
In this study, CBT was estimated via machine learning using biometric data acquired from a hand-worn device. ST, SCR, and a-wave were used as explanatory variables and features were extracted based on PPI and lagged. The machine-learning method used was SVR, which accounts for nonlinear- ities in the data. To verify the accuracy of CBT estimation for each feature, we reduced one of the explanatory variables and compared each evaluation index. Furthermore, by focusing on the linearity between ST and CBT, we verified the use of CBT as the objective variable and the estimation of the difference between CBT and ST. Differences were found in the extraction of features for estimation in both cases. In both cases, good estimation accuracy was achieved when all explanatory variables were used, and the estimation accuracy of the model using only ST and SCR was high.
Figure 5: Time series of ST and CBT.Figure 6: Each average of ST and CBT.Figure 7: Relationship between ST and CBT.Figure 8: Relationship between ST and CBT difference.
When CBT was used as the objective variable, the estimation results, excluding ST as the explanatory variable, suggested the applicability of the model, although some accuracy issues remained. This is thought to be because the features for identifying clusters were extracted from explanatory variables other than ST, and the CBT was estimated.
Feature Selection for Machine Learning-Based Core Body Temperature Estimation 117
This method can be used to easily obtain CBT from the hand and can be implemented in smartwatches and smart rings. However, because the appli- cability of this model is limited, it must be validated by measuring biometric data under different acquisition environments, such as hot environments or during exercise.
REFERENCES
Cagnacci, A., Elliott, J. A., and Yen, S. S. (1922). “A major regular of the circadian rhythm of core temperature in humans”, Journal of Clin Endocrinol Metab, Vol. 75, No. 2, pp. 447–452. Constant I., Laude D., Murat I., Elghozi J. L. (1999). “Pulse rate variability is not a
surrogate for heart rate variability”, Cli. Sci. 97(4), pp. 391–397. Gagge, A. P. (1971). “An effective temperature scale based on a simple model of human physiological regulatory response”, ASHRAE Transactions, Vol. 77, No. 2192, pp. 247–262. Hamatani T., Uchiyama A., Higashino T. (2017). “On-line Core Temperature Esti-
mation Using Wearable Sensors During Sport with Variable Exercise Intensity”, IPSJ Journal, Vol. 58, No. 11, pp. 1818–1831. Ito A., Takahashi H., Nagumo K., Oiwa K., Nozawa A. (2022). “Application of Support Vector Regression to Estimating Body Core Temperature Based on Facial Skin Temperature”, The 84th National Convention of IPSJ, Vol. 2022, No. 1, pp. 161–162. Matsunaga, D., Tanaka, Y., Seyama, M., Nagashima, K. (2020). “Non-invasive and
wearable thermometer for continuous monitoring of core body temperature under various convective conditions”, Proc. of EMBC, pp. 4377–4380. Uchiyama A., T Hamatani., Higashino T. (2015). “Estimation of Core Temperature Based on a Human Thermal Model Using a Wearable Sensor”, in Proceed- ings of IEEE 4th Global Conference on Consumer Electronics (GCCE 2015), pp. 605–609. Yoshikawa H., Hamatani T., Uchiyama A., Higashino T. (2017). “Proposal the
estimation of Core Temperature using a simplified thermography for daily use based on machine learning”, Multimedia, Distributed, Cooperative, and Mobile Symposium, pp. 1396–1403.
LISTED IN THE AHFE DIGITAL BOOKSTORE CATALOGUE
Explore the complete digital volume
Emerging Technologies in Healthcare and Medicine
Read this individual research paper free through the original publisher, or explore the full digital proceedings book.
ISBN 978-1-958651-92-6
Explore this ISBN in the AHFE Bookstore ↗Listed in the July 2026 bookstore catalogue; search by ISBN to confirm current availability · Digital book purchase optional