Kuno Takumi, Kazunori Kaede, Keiichi Watanuki (2025). Evaluation of Driver Overconfidence in Automotive Driving Using Physiological Data. In: Affective and Pleasurable Design. AHFE Open Access, vol. 164, pp. 12–23. https://doi.org/10.54941/ahfe1006056
Graduate School of Science and Engineering, Saitama University, 255 Shimo-okubo Sakura-ku, Saitama-shi, Saitama 338-8570, Japan; Advanced Institute of Innovative Technology, Saitama University, 255 Shimo-okubo Sakura-ku, Saitama-shi, Saitama 338-8570, Japan ↗
This research aims to explore a method for the real-time evaluation of overconfidence during car driving. Overconfidence can lead to dangerous driving behaviors, making real-time detection crucial to reduce traffic accidents. In this study, a driving simulation environment was created using virtual reality (VR), and a right-turning scenario was used to encourage overconfidence during the experiment. The driving behavior data (accelerator, brake, and steering), physiological data (skin conductance and electrocardiogram (ECG)), and driving footage were recorded simultaneously. Overconfidence was measured by having participants watch the driving footage they created, obtaining both self-assessment from their own perspective and from an external perspective, as well as the difference between the two. The relationship between the measured overconfidence and the feature-extracted driving behavior and physiological data was analyzed. The results show that, when considering the period from the pedestrian crossing before the right turn until the increase in speed as the "pre-turn phase," and from the increase in speed until passing the pedestrian crossing on the turning side as the "turning phase," all subjects completed the turn and exhibited similar driving behavior during the turning phase. A feature-based analysis of the time-series data showed strong correlations between overconfidence and several features. In the driving behavior data, a significant negative correlation was observed between the minimum accelerator value during the turning phase (r = –0.718, p = 0.013). Furthermore, significant negative correlations were found between the average change in accelerator data in the turning phase (r = –0.676, p = 0.022), minimum slope of the accelerator in the turning phase (r = –0.644, p = 0.032), and minimum steering angle during the pre-turn phase (r = –0.622, p = 0.041). For physiological data, a significant negative correlation was found with the standard deviation of skin conductance (r = –0.662, p = 0.027). These results suggest the possibility of using driving behavior and physiological data to evaluate overconfidence in real time.
Evaluation of Driver Overconfidence in Automotive Driving Using Physiological Data 13
INTRODUCTION
In recent years, the number of traffic accidents in Japan has remained constant (Cabinet Office, 2024), highlighting the importance of new approaches to reduce traffic accidents. Traffic accidents can be classified into three main causes: human, vehicle, and environmental factors. Among these, human factors cause the most accidents. Accidents caused by human factors occur when an error occurs in the basic driving process of “perception, judgment, or operation” (Yoshimura, 2022). Specifically, accidents related to overconfidence are a major concern, as overestimating one’s driving skills or safety can lead to reckless driving behaviors (Matsuura, 2017). To date, evaluations of overconfidence while driving have largely relied on subjective methods using questionnaires, and real-time objective evaluation methods have not yet been sufficiently established. In psychology, overconfidence is considered a type of cognitive bias that refers to the tendency for individuals to overestimate their abilities or knowledge when making decisions or judgments. This overconfidence bias is influenced by emotional, cognitive, and environmental factors. Research on overconfidence has been conducted in various fields, including studies on investors’ overestimation of their judgment abilities (Kahneman, 2011). In driving, overconfidence is influenced by emotional factors, such as pressure from passengers; cognitive factors like relying only on visible information, such as leading vehicles or traffic signals, while neglecting other dangers; and environmental factors such as driving assistance systems, which make the driver believe that their abilities are enhanced.
Currently, few studies have addressed the relationship between overconfidence and physiological information at the appropriate level. Numerous studies have investigated stress, which is often influenced by environmental factors. Research by Tateno et al. (2020) showed that physiological responses, including heart rate, skin conductance, and electromyography, can be used to measure physical and psychological stress.
This study aims to contribute to the development of driver assistance systems and accident prevention measures by detecting overconfidence in real-time while driving. The ultimate goal is to clarify the relationship between physiological information measurable while driving and overconfidence. Overconfidence is considered a primary factor that causes traffic accidents, but objective evaluation methods have not yet been established. Therefore, we aimed to simulate the factors that contribute to overconfidence using virtual reality (VR)-based driving scenarios and collect physiological data (such as skin conductance and electrocardiogram (ECG)) and driving behavior data. Skin conductance reflects the psychological and physiological arousal state of a person, while an ECG reflects autonomic nervous system activity, both of which are thought to be related to emotional factors. Additionally, overconfidence was quantified using self- assessments from the participants’ perspectives and objective evaluations. The relationships among these quantified values, physiological data, and
driving behavior data are analyzed to examine objective indicators of overconfidence.
EXPERIMENT This study investigates the relationship between physiological information, driving behavior data, and overconfidence. The participants included 13 male drivers, aged 23 ± 2, who held a valid driving license. The experiment was conducted using VR, and a driving simulation environment was constructed using Unity. This study was approved by the Ethics Committee for Human Research at Saitama University (R5-E-4), and written informed consent was obtained from all participants.
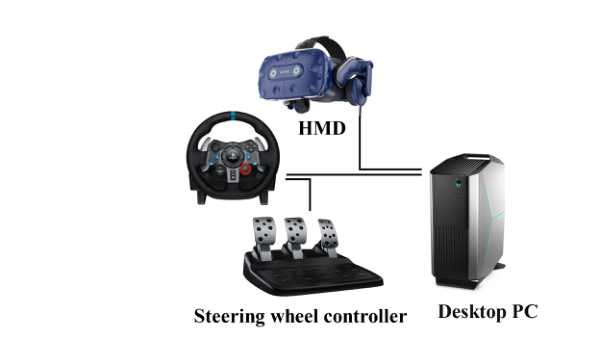
EQUIPMENT USED The experiment involved measuring various types of physiological information, including ECG to predict stress levels, skin conductance to measure physiological arousal, and pupil diameter to assess attention. ECG measurements were performed using the Web-1000 multichannel physiological measurement device (Nihon Kohden Corporation), and skin conductance was measured using the Nexus device by Kissei Comtec Corporation. The VR environment was projected using a Vive Pro Eye from TC NIPPON. The driving controller was a Logitech G29 Racing Wheel, and the simulation environment was powered by a Dell PC. The simulation software used was UC-win/Roadver.15 by Forum8, and data analysis was conducted using Python (Figure 1).
OVERCONFIDENCE EVALUATION METHOD The term “overconfidence” is used in various fields, and one definition of overconfidence is “the tendency to unconsciously overestimate one’s own abilities or knowledge when making decisions or judgments” (Kahneman, 2011). As this definition suggests, it is crucial to accurately assess one’s own abilities in overconfidence. In the field of driving, the term “overconfidence”
Figure 1: System configuration.
Evaluation of Driver Overconfidence in Automotive Driving Using Physiological Data 15
is used in relation to both drivers’ own skills and driver assistance systems. In this study, however, overconfidence is defined specifically as “overconfidence in driving skills,” and it refers to “the tendency for drivers to unconsciously overestimate their driving abilities when making decisions or judgments.” To assess “overconfidence in driving skills,” the authors referred to the self-assessment of driving behavior used in the research of Nakamura and Shimazaki (2013). The participants were asked to answer a questionnaire that included self-assessments from their own and external perspectives. Based on these evaluations, overconfidence in driving skills was quantified. For the self-assessment of their own driving, the participants viewed video footage of their driving from an overhead perspective. The assessment used a 10 cm line with a scale indicating “safe” at the left end and “dangerous” at the right end, similar to the Visual Analog Scale (VAS). “Safe” was defined as “a state where all hazards are avoided and predictive driving is thoroughly executed, that is, a state where the road conditions are appropriately understood,” and “dangerous” was defined as “a state with a high risk of accidents, involving reckless driving, that is, a state where the road conditions are not properly understood.” Figure 2 shows the scale used for the evaluation. Following the evaluation, the participants were interviewed regarding their impressions and advice regarding their right-turn behavior. The participants were allowed to answer freely. For the self-assessment from an external perspective, three video clips were shown: the driving footage of the participant, and then the footage of two other participants in sequence. This was performed to prevent changes in the external self-assessment due to comparisons. The footage of the other participants was used only as camouflage to prevent the participant from recognizing their own driving video. Upon evaluating the three videos, the participants were asked to imagine their own right-turn behavior at the intersection while feeling anxious and then assess it on the scale. The evaluation when participants recognized their own footage was not used because when participants recognize their own footage, there exists a risk of unconscious positive or negative bias, which can distort subjective evaluations. On the other hand, evaluating without recognizing their own footage enables a more objective judgment. Therefore, this study adopted a method in which participants were asked to imagine their driving behavior and assess it in the context of their own perspective.
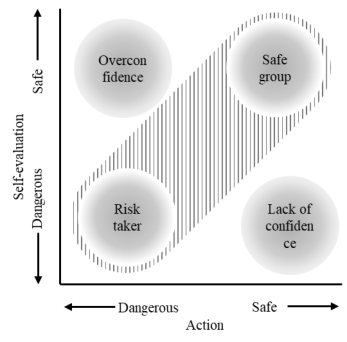
The relationship between behavior and self-assessment was used to quantitatively assess driver overconfidence. This relationship can be represented by the model shown in Figure 3. When participants assessed their own behavior, it was desirable for their behavior and self-assessment to align. If the behavior and self-assessment align, two possibilities are considered: one is the “safe group,” where the driver is performing safe behaviors as they imagined, and the other is the “risk-taker” group, where the driver knowingly performs risky behaviors. On the other hand, when behavior and self-assessment do not align, two possibilities exist: overconfidence, where the driver believes they are behaving safely while engaging in risky behavior, and lack of confidence, where the driver believes they are not performing safely even though they are. In this study, the self-assessment in
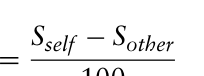
the model was considered to be the self-assessment from the perspective of the participant, denoted as Sself, and the behavior was considered to be the self-assessment from an external perspective, denoted as Sother. The difference between the two values was used as an indicator. The overconfidence level O was calculated using the following formula:
Equation reproduced from the original PDF.
100
Behavior was considered as a self-assessment from an external perspective because behavior is difficult to quantify, and if a third-party evaluation is used, it may vary based on the criteria of the evaluator or subjective judgments. The experiment was conducted with one participant at a time in a laboratory. The environment was such that only the experimenter and participant were in the room. With this indicator, the overconfidence level ranges from –1 to 1. A larger value indicates a greater discrepancy between the subjective and objective assessments, indicating a stronger state of overconfidence. By quantifying the difference between the subjective and objective evaluations, it is possible to objectively assess the degree of overconfidence, making it an effective method to reveal the cognitive characteristics and risk perception tendencies of drivers.
Figure 2: Visual analog scale (VAS).
Figure available in the original PDF paper.
Figure 3: Relationship between behavior and self-evaluation.
Evaluation of Driver Overconfidence in Automotive Driving Using Physiological Data 17
MACHINE CONFIGURATION AND VR ENVIRONMENT THAT PROMOTES OVERCONFIDENCE
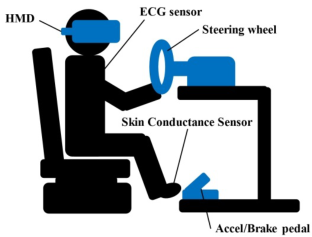
Figure 4 shows the experimental setup. The room temperature was set to 25 ± 2
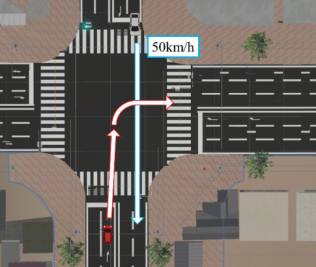
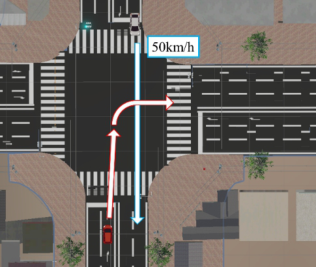
C, and the room was windless. A circular steering wheel was installed as the control component. The participants were asked to wear a head- mounted display, and the VR environment was projected onto their field of view using a PC. The positions of the pedals and steering wheels were fixed, whereas the seat position was adjustable. The devices for measuring biological information were as follows: an ECG sensor was attached to the chest and a skin conductance sensor was attached to the toes. In this experiment, to promote overconfidence, a VR environment was created using the factors of overconfidence bias explained in the Introduction. Emotional factors were created by setting a time limit that increases pressure to avoid an accident. Cognitive factors were introduced by instructing the participants to focus only on oncoming traffic, preventing them from paying attention to other potential dangers. A driving simulator was used to create an environment without causing real harm. It results in a tendency for participants to underestimate danger, which creates an environmental factor that promotes overconfidence. Figure 5 shows the VR environment. This study referenced an actual accident case (ITARDA Report No. 151), and based on the environmental factors of overconfidence, a right-turn driving simulation was conducted using the VR environment. The VR environment includes a road with an intersection, and based on the cognitive factors of overconfidence, the intersection was designed to have a good line of sight with oncoming traffic approaching. There was no right-turn signal at the intersection, and several cars passed at a constant speed of 50 km/h while maintaining a safe distance. Additionally, the vehicles in the VR environment were designed to reflect the movements of the steering wheel controlled by the participant to simulate a driving experience as close to reality as possible. During the experiment, all participants were given unified instructions and a time limit was set to apply pressure based on the emotional factors of overconfidence. The time limit was set to 50 s, based on the typical signal timing of traffic lights. Participants were instructed to work under the assumption of a pressurized mental state. The participants began driving from a stationary position located a certain distance before the intersection.
Figure 4: Experimental environment.
QUESTIONNAIRE USED IN THE EXPERIMENT A questionnaire on the participants’ sense of urgency was used as a subjective indicator to measure their “sense of urgency” during the experiment. It contains the following five items rated on a 5-point Likert scale (see Figure 6):
(1) Sense of Urgency: Did you feel a sense of urgency during the task? (2) Time Pressure: Were you aware of the time limit and feel pressurized by it? (3) Perceived Urgency: Did you feel that you needed to operate quickly while driving? (4) Demand for Quick Judgment: Did you feel that you were required to make faster decisions than usual to achieve your goals? (5) Time to Spare: Did you feel that without the time limit, you would have been able to operate more calmly?
This questionnaire assessed the psychological load and time constraints imposed by the task or driving on the participants, particularly in terms of urgency, time pressure, perceived urgency, and the need for quick judgment. The “Time to Spare” question was designed to measure how the presence or absence of the time limit influenced the participants’ calmness during operation. During the questionnaire, the intent behind each question was fully explained to the participants, who were asked to evaluate the items using the same criteria for all conditions.
EXPERIMENTAL PROCEDURE
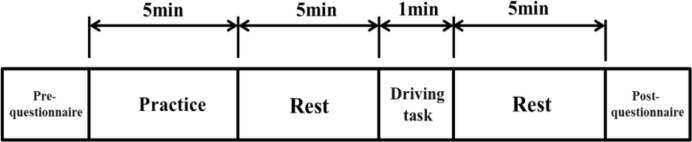
Figure 7 shows the flow of the experiment. First, the details of the experiment were explained to the participants and their consent was obtained. Subsequently, biometric measurement devices were attached to each participant. The participants drove in Environment 1 for practice and get accustomed to driving in the VR environment, which was followed by a
Evaluation of Driver Overconfidence in Automotive Driving Using Physiological Data 19
5-min break. Thereafter, they performed the driving task in Environment 2, the experimental environment, and then they took another 5-min break. Upon completing the driving task, the participants were asked to complete a questionnaire to assess their subjective overconfidence. Additionally, the participants were shown a video of their own driving performance without being told that it was their own and were asked to evaluate it. Subsequently, they were informed that the video was indeed of their own driving and were asked to reassess the evaluation.
EXPERIMENTAL CONSTRAINTS AND LIMITATIONS As the experiment was conducted in a VR environment, there may be differences from real driving conditions, such as a lack of vibration. Additionally, while efforts were made to consider and reduce the participants’ mental states and the effects of familiarity, it is difficult to completely eliminate the influence of individual differences. Furthermore, in subjective overconfidence evaluations, responses may show variability; therefore, caution is required when interpreting the results.
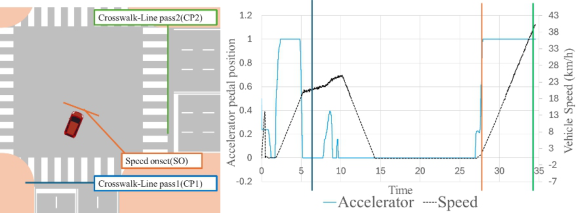
DATA COLLECTION AND ANALYSIS METHODS Driving behavior data were recorded in CSV format at 50 Hz (every 0.02 s), with each trial saved in an individual file. ECG data were recorded at 1 kHz, and skin conductance data were obtained at 32 Hz. Driving behavior data were recorded at 50 Hz and all data were synchronized. Features were extracted from the collected data to analyze their relationship with overconfidence. In terms of feature selection, driving behavior data were divided into two phases: the “pre-turn phase,” which covers the period before the vehicle speed increases (from the pedestrian crossing, when the vehicle speed is zero, the accelerator input exceeds 0.1, and the accelerator input is gradually increasing), and the “turn phase,” which includes the period after the vehicle speed increases until the vehicle crosses the next pedestrian crossing (see Figure 8). Features such as maximum, minimum, average, standard deviation, changes, and change rates were extracted from both the driving behavior and biometric data, and their correlations with overconfidence were evaluated.
Figure 7: Experimental protocol.
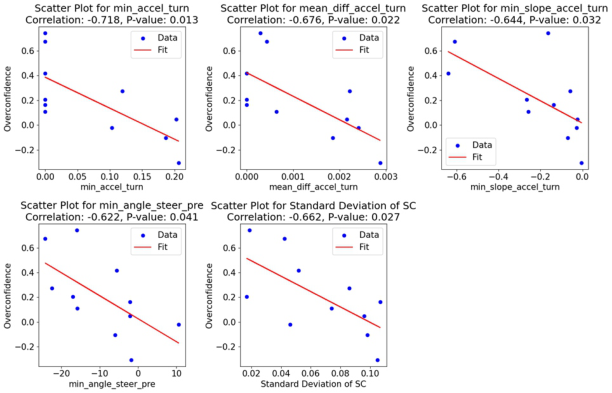
EXPERIMENTAL RESULTS As a result of analyzing the data collected through the Likert scale questionnaire, the average score of the participants was 4.3 (SD = 0.7), with many participants reporting that they felt “more anxious than usual.” A correlation analysis between the average score on the anxiety questionnaire and the overconfidence score was performed using Pearson’s correlation coefficient. The correlation coefficient was 0.52532 and the p-value was 0.0652, which was not statistically significant (p > 0.05). Subsequently, for all participants in this study, we collected time-series data on driving behavior and physiological data during the right-turn process within the time limit, and there were no collisions with the oncoming vehicle. Table 1 lists the mean values and standard deviations of the driving behavior data for the 13 participants. During the right-turn preparation phase, the time taken shows a large variation, but during the actual right-turn phase, the variation is small, and little variation is observed in the time-to-collision (TTC). The average speed during the right-turn phase shows little variation, and the driving behavior is similar across the participants. Correlation analysis was conducted between the features extracted from the driving behavior and physiological data and the overconfidence score using Pearson’s correlation coefficient. Strong correlations were found between the following features, and the p-values were statistically significant. The level of statistical significance was set at p < 0.05.
Table 2 lists the features with a correlation coefficient of 0.6 or higher and a p-value of less than 0.05. The following parameters show strong correlations with overconfidence, and their p-values are less than 0.05, indicating statistical significance: min_accel_turn (minimum acceleration during the right-turn phase), mean_diff_accel_turn (average change in acceleration during the right-turn phase), min_slope_accel_turn (minimum slope of acceleration during the right-turn phase), min_angle_steer_pre (minimum steering angle during the right-turn preparation phase), and standard deviation of SC (standard deviation of skin conductance response).
Figure 8: Boundary line of driving behavior.
Evaluation of Driver Overconfidence in Automotive Driving Using Physiological Data 21
Table 1: Mean and standard deviation of the subject’s driving data.
Table available in the original PDF paper.
Name Mean ± SD Pre-Turn Phase Time 20.70 ± 11.18 (s) Turn Phase Time 6.64 ± 1.04 (s) TTC 0.59 ± 0.22 (s) Average Speed 14.80 ± 1.50 (km/h)
Table 2: Correlations between confidence level and features.
Table available in the original PDF paper.
Feature Name Correlation P-value Min_accel_turn −0.718 0.013* Mean_diff_accel_turn −0.676 0.022* Min_slope_accel_turn −0.644 0.032* Min_angle_steer_pre −0.622 0.041* Standard Deviation of SC −0.662 0.027*
Figure 9: Scatter plots of overconfidence and features.
DISCUSSION
From the above results, the large variation in the time taken during the right- turn preparation phase between participants was considered to be caused by differences in their driving skills. Furthermore, during the right-turn phase, because right-turn initiation was based on the participants’ own timing, many participants drove cautiously, which may have led to a smaller variation. The driving behavior data suggest that a relationship exists between right- turn preparation phase steering, right-turn phase acceleration behavior, and overconfidence score. Regarding the steering behavior during the right- turn preparation phase, the scatter plot shows a negative correlation,
suggesting that drivers with higher overconfidence are more likely to make large steering corrections in the opposite direction, indicating that they may not have been performing the steering operation properly. Regarding the acceleration behavior during the right-turn phase, the scatter plot of the minimum acceleration value shows a negative correlation, suggesting that drivers with higher overconfidence may have been releasing their foot from the accelerator, indicating difficulty in properly adjusting acceleration. Furthermore, the scatter plots of the average acceleration change and the minimum slope of the acceleration change show that with higher overconfidence, the acceleration changes are smaller and more abrupt, suggesting that the driver was unable to control acceleration and deceleration effectively. Regarding skin conductance, the scatter plot shows a negative correlation, suggesting that drivers with higher overconfidence may have been either becoming too cautious or not concentrating properly on driving.
CONCLUSION
In this study, the relationship between overconfidence while driving and physiological information was clarified, and a method for objectively evaluating overconfidence was examined. In a driving simulation using a VR environment, the physiological information of the participants (ECG, skin conductance, and pupil diameter) and driving behavior data were collected, and the impact of overconfidence was analyzed by inducing stress and pressure.
The experimental results showed that the phase before the right turn, from crossing the pedestrian crossing to the increase in vehicle speed before starting the right turn, was defined as the right-turn preparation phase. The phase from the increase in speed to crossing the pedestrian crossing at the right turn was defined as the right-turn phase. All participants completed the right turn and similar driving behaviors were observed during the right-turn phase. In analyzing time-series data as features, strong correlations were found between overconfidence scores and several features. In the driving behavior data, a significant negative correlation was observed with the minimum acceleration during the right-turn phase (r = −0.718, p = 0.013). Significant negative correlations were also found with the mean change in acceleration during the right-turn phase (r = −0.676, p = 0.022), the minimum acceleration slope during the right-turn phase (r = −0.644, p = 0.032), and the minimum steering angle during the right-turn preparation phase (r = −0.622, p = 0.041). Additionally, in the physiological information, a significant negative correlation was observed with the standard deviation of skin conductance (r = −0.662, p = 0.027).
These findings suggest potential applications for driving assistance systems and accident prevention measures and contribute to the development of technologies that can detect overconfidence in real time. In future research, improving models that consider individual differences and conducting experiments with a larger number of participants can enhance the accuracy of the overconfidence evaluation.
Evaluation of Driver Overconfidence in Automotive Driving Using Physiological Data 23
REFERENCES
Cabinet Office, Government of Japan. (2024). “Chapter 1, Section 1: Long-term trends in road traffic accidents.” In White Paper on Traffic Safety 2024. Traffic Policy Division. Institute for Traffic Accident Research and Data Analysis. (2021). Right-turn
accidents at intersections between light commercial vehicles and passenger cars (ITARDA Report No. 151). ITARDA. Kahneman, D. (2011). “Thinking, Fast and Slow, Penguin,” 496 ISBN 978-
0141033570. Book Review, Published: 25 May 2013, Volume 55, page 915. Matsuura, T. (2017). “The Safety Psychology of Elderly Drivers,” pp. 125–127. Yoshimura, T. (2022). “Mechanism of Accident Occurrence: An Example of Organization and Explanation Related to Human Error,” Japanese Society of Traffic Psychology, Corporate Division.
LISTED IN THE AHFE DIGITAL BOOKSTORE CATALOGUE
Explore the complete digital volume
Affective and Pleasurable Design
Read this individual research paper free through the original publisher, or explore the full digital proceedings book.
ISBN 978-1-964867-40-3
Explore this ISBN in the AHFE Bookstore ↗Listed in the July 2026 bookstore catalogue; search by ISBN to confirm current availability · Digital book purchase optional