Tamaki Ueda, Daisuke Suzuki, Chizuru Nakagawa, Tomoyuki Ogawa, Hiroyuki Sako, Yuuta Yamamoto (2025). Analysis of Energy-efficient Operation Characteristics of Express Trains using Global Navigation Satellite System Data. In: Human Factors in Design, Engineering, and Computing. AHFE Open Access, vol. 199, pp. 2055–2060. https://doi.org/10.54941/ahfe1007017
To reduce railway energy consumption, optimizing driving techniques is an effective approach, along with enhancing energy-efficient rolling stock and infrastructure. To identify operation characteristics associated with lower energy consumption and to investigate the relationship between driving speeds and energy consumption, this study analyzes operation performance data.Data were gathered over one year from GNSS-equipped tablets. Analysis focused on one segment between two scheduled stops of the same limited express train. After excluding data reflecting deceleration due to signal aspects or departure delays of ≥1 min, 95 out of 331 data points were used. Excluding outliers, two groups were formed based on estimated energy consumption: the lowest 25% classified as the "low group" and the highest 25% as the "high group." Energy consumption was estimated using GNSS data by considering running resistance and track gradient. T-tests were conducted to assess significant differences between the two groups for mean estimated energy consumption, travel time, and driving speeds at three locations: (1) before the speed restriction zone in a downhill section, (2) before the speed restriction zone in a flat section, and (3) before the station stop. The locations chosen for comparing driving speeds were characterized by remarkable speed variability, situated before the speed restriction zones and the station stop requiring deceleration. This was based on the premise that shortening acceleration time and lower speeds prior to braking generally enhance energy efficiency and greater speed variability may reflect differences arising from driving techniques.T-test results indicated that the mean estimated energy consumption of the "low group" (136.1 kWh) was significantly lower than that of the "high group" (150.0 kWh). By contrast, the mean travel time of the "low group" was significantly longer (low: 13 min 34 s, high: 13 min 3 s). Regarding driving speeds at the locations, the "low group" displayed significantly lower speeds: (1) before the speed restriction zone in a downhill section (low: 102.2 km/h, high: 108.5 km/h); (2) before the speed restriction zone in a flat section (low: 114.5 km/h, high: 120.9 km/h); and (3) before the station stop (low: 111.0 km/h, high: 122.2 km/h). The reduced speeds prior to the onset of braking during low-energy-consumption runs corroborated theoretical expectations. Despite the "low group" having a longer mean travel time, it remained within the scheduled travel time (13 min 45 s). Regarding energy-efficient operation characteristics, the "low group" exhibited greater variability in driving speeds at locations (2) before the speed restriction zone in a flat section and (3) before the station stop. Accordingly, train performance graphs illustrating driving speed versus travel distance for the "low group" were examined. Two energy-efficient operation patterns emerged: (A) increasing speed during the midsection and coasting after the speed restriction zone before the station stop and (B) coasting during the midsection and accelerating after the speed restriction zone before the station stop. Pattern A was frequently observed among train drivers who were conscious of energy-saving practices. Interviews with train drivers indicated that pattern B was favored to prevent deceleration caused by signal aspects.
In addition to enhancing energy-efficient rolling stock and infrastructure, optimizing driving techniques is effective in reducing train energy consumption. Several mathematical models have been proposed to explore operational strategies that minimize energy consumption of trains. Watanabe et al. (2020) investigated the energy efficiency of automatic train operation (ATO) systems and reported that longer travel time between stations reduces energy consumption. Gunselmann et al. (2005) reported that extending travel time by 10% can reduce energy consumption by up to 25%. Zhou et al. (2018) developed an optimization model to minimize energy
consumption in subways. This model uses coasting on downhill gradients in subways and reduces energy consumption by 20%. Experimental studies on driver behavior have been conducted using driver advisory systems. Kuwahara et al. (2015) reported an eco-driving assistant system designed to reduce acceleration and extend coasting time, thereby reducing total energy consumption. Koizumi et al. (2018) conducted a field study on commuter trains to analyze eco-driving advisory systems. The study reported that an eco-driving advisory system that recommends operations such as reducing the speed before braking reduced energy consumption by 9.4%. However, only a few studies have addressed actual energy-saving driving practices based on operational log data collected from real-world operations. In this study, we aim to investigate the relationship between driving speed and energy consumption by analyzing operational log data and identify the characteristics of energy-efficient driving.
METHODS
Data for Analysis Operational log data were collected over a one-year period using tablets equipped with global navigation satellite systems (GNSSs). The data analysis was conducted on a single segment between two consecutive scheduled station stops of the same limited express train. Runs involving deceleration caused by signal aspects were excluded. Braking caused by signal aspects requires energy for subsequent acceleration, which may increase overall energy consumption regardless of the driver’s intent to drive in an energy- efficient manner. In addition, runs that experienced a departure delay exceeding one minute were excluded from the analysis, as such delays eliminate the margin for energy-efficient driving and may necessitate recovery driving. After applying these exclusion criteria, 95 of the 331 runs were retained.
In this study, the estimated energy consumption calculated from the GNSS data was used for grouping because direct measurement from trains was not feasible. Using position and speed information obtained from the GNSS data, the energy consumption required for acceleration and deceleration was estimated based on driving theory (Japan Train Operation Association, 2010), considering factors such as vehicle running resistance and track gradient. Using the estimated energy consumption, the data were classified into two groups: the “low group,” i.e., those at or below the 25th percentile, and the “high group,” i.e., those at or above the 75th percentile.
Evaluation Metrics Estimated energy consumption was used as an evaluation metric. As reducing acceleration time reduces the maximum speed and consequently increases travel time, travel time was also used as an evaluation metric.
Additionally, driving speed was analyzed because increasing the proportion of coasting throughout the trip and reducing the driving speed before braking can contribute to energy savings. Locations with greater
Analysis of Energy-Efficient Operation Characteristics of Express Trains 2057
variability in driving speed are assumed to be more likely to indicate the application of energy-efficient driving strategies. Therefore, three key locations where speed variability was high and deceleration was required before speed restrictions or station stops were selected as potential points of energy-saving operation: (1) before the speed restriction zone in a downhill section, (2) before the speed restriction zone in a flat section, and (3) before the station stop.
Analysis Method A Welch’s t-test was performed to examine the mean differences in estimated energy consumption, travel time, and driving speed between the low and high groups. The significance level was set at 5%. The effect size—a standardized measure that is independent of sample size—was calculated using Cohen’s d index (d). Effect sizes of 0.2, 0.5, and 0.8 were interpreted as small, medium, and large, respectively. Analyses were performed using Python 3.12.4.
RESULTS
Table 1 shows the t-test results, which revealed that the mean estimated energy consumption of the low group (136.1 kWh) was significantly lower than that of the high group (150.0 kWh), and the effect size was large [t (45) = 17.32, p < 0.05, d = 5.16]. The mean travel time of the low group (13 min 34 s) was significantly longer than that of the high group (13 min 3 s), and the effect size was large [t (45) = 7.76, p < 0.05, d = 2.33]. However, the mean travel times of both groups were less than the scheduled travel time (13 min 45 s). Furthermore, the low group exhibited significantly lower mean driving speed at the three selected locations: (1) before the speed restriction zone in a downhill section (low: 102.2 km/h, high: 108.5 km/h) [t(45) = 3.52, p < 0.05, d = 1.02]; (2) before the speed restriction zone in a flat section (low: 114.5 km/h, high: 120.9 km/h) [t(45) = 3.14, p < 0.05, d = 0.92]; and (3) before the station stop (low: 111.0 km/h, high: 122.2 km/h) [t (45) = 4.41, p < 0.05, d = 1.29].
Table 1: Welch’s t-test results.
Table available in the original PDF paper.
Metrics Low Group High Group p Value Cohen’s d 136.1 ± 2.5 150.0 ± 2.9 <0.05 5.16 Estimated energy consumption (kWh)
<0.05 2.33
Travel time 13 min 34 s ± 16 s
13 min 3 s ± 10 s 102.2 ± 5.0 108.5 ± 11.1 <0.05 1.02
Driving speed (1) (km/h)
114.5 ± 12.9 120.9 ± 5.5 <0.05 0.92
Driving speed (2) (km/h)
111.0 ± 15.2 122.2 ± 8.7 <0.05 1.29
Driving speed (3) (km/h)
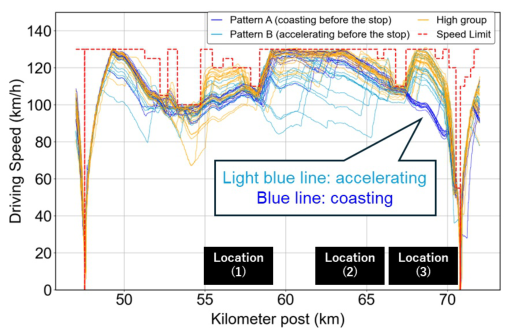
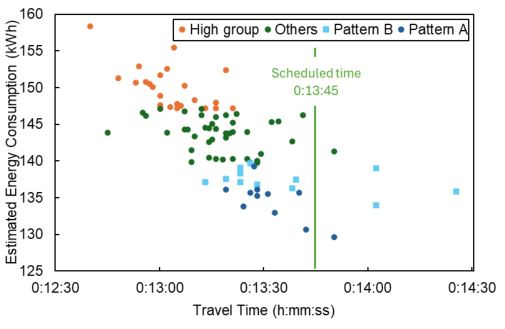
The low group exhibited greater variability in driving speed at Locations (2) and (3). Accordingly, as shown in Figure 1, the speed profile for the low group demonstrated two distinct operational patterns, depending on whether coasting or acceleration occurred after the speed restriction zone and before the station stop: Pattern A (coasting before the stop) and Pattern B (accelerating before the stop). In Pattern A, trains increased their speed between 60 and 65 km and subsequently coasted after the speed restriction zone and before the station stop. In Pattern B, trains maintained low speed between 60 and 65 km and then accelerated after the speed restriction zone and before the station stop. Figure 2 shows the relationship between the travel times for each group and the estimated energy consumption. The results indicate a general trend: lower energy consumption is associated with longer travel time. Even for Pattern B, more than 70% runs remained within the scheduled travel time.
Figure 1: Speed profile of each group.Figure 2: Relationship between travel time and estimated energy consumption.
Analysis of Energy-Efficient Operation Characteristics of Express Trains 2059
DISCUSSION
Herein, the estimated energy consumption was significantly lower in the low group than in the high group, with a large effect size. The mean travel time was significantly longer in the low group than in the high group, with a large effect size. These findings, in which energy-efficient operations were associated with longer travel time, are consistent with the findings of Watanabe et al. (2020) and Gunselmann et al. (2005). Although the mean travel time was longer in the low group than in the high group, it remained within the scheduled travel time, suggesting virtually no operational issue. The mean travel time of the high group was more than 40 seconds shorter than the scheduled travel time. In addition, the mean arrival times of both groups were earlier than the scheduled arrival time, indicating that both groups traveled faster than required. When a train operates on schedule, incorporating coasting and extending travel time may be an effective strategy for energy-efficient driving.
At Location (1), the mean driving speed was significantly lower in the low group than in the high group, with a large effect size. This result is consistent with the findings of Zhou et al. (2018) indicating that coasting on downhill gradients reduces energy consumption. At Location (2), the mean driving speed was significantly lower in the low group than in the high group, with a large effect size. This finding suggests that energy-efficient driving is characterized by lower speeds achieved by limiting acceleration and increasing coasting time, which is consistent with the findings of Kuwahara et al. (2015). Similarly, at Location (3), the mean driving speed was significantly lower in the low group than in the high group, with a large effect size. This finding—that energy-efficient driving involves coasting before braking at the station stops and driving at lower speeds—is consistent with Koizumi et al. (2018).
Two energy-efficient operation patterns emerged. In Pattern A, reducing acceleration before the station stop reduces energy consumption by minimizing braking. Pattern A tended to yield the lowest mean estimated energy consumption and was frequently observed among drivers who were conscious of energy-saving practices. Pattern B involved lower speed in the middle section between stops; however, the travel times were mostly within the scheduled travel time. Thus, Pattern B can be also effective for energy conservation. For the train and the segment targeted in this study, we interviewed drivers who adopted Pattern B driving, enquiring their usual driving practices and their awareness of preceding trains. The interviews indicated that Pattern B was tended to be preferred to avoid unnecessary deceleration because of signal aspects.
This study has some limitations. Although two energy-efficient operation strategies emerged, further research is required to determine their appropriate application. This study analyzed data unaffected by signal aspects; however, energy-efficient driving strategies that can account for the influence of signal aspects remain unexplored. Furthermore, adjusting the timetable to mitigate the influence of signal aspects may also contribute to energy savings. In addition, although this study clarified the characteristics of the low group,
further research is required to develop support methods that leverage these characteristics to reduce energy consumption in the high group. Based on the characteristics of energy-efficient operations identified in this research, a driving advisory system will be developed as future work.
CONCLUSION
In this study, we analyzed the train operational log data to investigate the low energy consumption characteristics. The mean estimated energy consumption was significantly lower in the “low group” than in the “high group.” The mean travel time was significantly longer in the low group than in the high group; however, it was less than the scheduled travel time. At three selected locations, the mean driving speed was significantly lower in the low group than in the high group. This supports the hypothesis that reducing the driving speed before braking conserves energy. Two energy-efficient operation patterns were observed in the low group: Pattern A—increasing speed during the midsection and coasting after the speed restriction zone before the station stop and Pattern B—coasting during the midsection and accelerating after the speed restriction zone before the station stop. The findings of this study reveal that both patterns are effective energy-saving driving strategies.
REFERENCES
Gunselmann, W. (2005). “Technologies for increased energy efficiency in railway systems”, in: 2005 European Conference on Power Electronics and Applications, 10, pp. 10. Japan Train Operation Association. (2010). “Driving Theory (Revised Edition)”. Koizumi, Y., Tonosaki, Y., Aoki, T., Franco, A., Ribeiro, H., Faria, R., Mendes,
C. M. L., Machado, C. E., Carvalho, C., Lopes, A. J. M. (2018). “Four Months Field Evaluation and the Refinement of Energy-Efficient Driver Advisory System toward Commercial Operation”, Proceedings of the 1st International Railway Symposium Aachen 2017, pp. 116–131. Kuwahara, R., Aoki, T., Kamo, Y. (2015). “Eco-Driving Trial Runs in European Railway Environment and Energy”, Proceedings of International Symposium on Speed-up and Service Technology for Railway and Maglev Systems, Paper ID 1E15–1. Watanabe, S., Sato, Y., Koseki, T., Mizuma, T., Tanaka, R., Miyaji, Y., Isobe,
E. (2020). “Verification of Optimized Energy-Saving Train Scheduling Utilizing Automatic Train Operation System”, IEEJ Journal of Industry Applications 9, pp. 193–200. Zhou, Y., Bai, Y., Li, J., Mao, B., Li, T. (2018). “Integrated Optimization on Train Control and Timetable to Minimize Net Energy Consumption of Metro Lines”, Journal of Advanced Transportation 2018, Article ID 7905820.
LISTED IN THE AHFE DIGITAL BOOKSTORE CATALOGUE
Explore the complete digital volume
Human Factors in Design, Engineering, and Computing
Read this individual research paper free through the original publisher, or explore the full digital proceedings book.
ISBN 978-1-964867-75-5
Explore this ISBN in the AHFE Bookstore ↗Listed in the July 2026 bookstore catalogue; search by ISBN to confirm current availability · Digital book purchase optional