Makoto Oka, Hirohiko Mori (2025). Development of Children's Cognitive Maps Before and After Fieldwork: Focusing on Qualitative Changes in Spatial Cognition. In: Human Factors in Design, Engineering, and Computing. AHFE Open Access, vol. 199, pp. 2453–2461. https://doi.org/10.54941/ahfe1007057
This study investigates the developmental changes in elementary school students' cognitive maps, focusing particularly on qualitative aspects such as the structuring of spatial information and the understanding of spatial relationships, as a result of local-area fieldwork. Clarifying how children's mental maps evolve through exploration is crucial for enhancing disaster risk reduction education, which must equip children with the ability to make instantaneous spatial judgments and select safe evacuation routes when adults are absent during a disaster. Traditional disaster education often focuses on specific scenarios like "at school" or "at home," leaving children vulnerable during solitary activities like commuting or playing. Given that communication failures in actual disasters may render navigation systems useless, the reliance on an accurate "map in their heads"—the cognitive map—is paramount for effective evacuation behavior. Children's cognitive maps are generally less developed than those of adults, progressing from landmark-centered to route-based, and eventually to bird's-eye view survey maps. This research, guided by Montello's framework, uses a comparative analysis of hand-drawn maps to reveal the cues children use to construct local space.
In recent years, natural disasters such as earthquakes, typhoons, and floods have occurred frequently worldwide, and Japan continues to face various disaster risks, including massive earthquakes. Consequently, disaster risk reduction education centered on evacuation drills and hazard map learning is implemented in elementary schools to help children acquire appropriate coping behaviors. Furthermore, families often discuss disaster preparation, such as confirming evacuation sites and communication methods. However, it has been pointed out that these educational efforts are often focused on specific scenarios such as "at school" or "at home."
In Japan, children frequently act without the presence of teachers or guardians, such as walking to school or playing in local parks after school. Actual disasters are highly likely to occur when children are acting alone or with friends, such as during their commute or in local playgrounds and shopping streets. In such situations, the ability of children to make independent judgments and select safe evacuation routes is indispensable. From the perspective of cognitive psychology and disaster research, evacuation behavior requires "instantaneous spatial
judgment," the success of which is closely related to an individual's spatial cognition and environmental understanding.
Moreover, in actual disaster situations, communication failures often render smartphone navigation systems dysfunctional, and few children carry paper maps. Therefore, evacuation behavior is likely to depend on the "map in their heads"— the cognitive map—based on experience and memory. The concept of the cognitive map was first systematically presented by Tolman (1948), and Lynch (1960) later clarified the structure of urban residents' spatial images. Spatial cognition research has shown that the cognitive map is a subjective spatial representation based on personal experience, attention, and knowledge, differing from objective coordinate systems like survey maps.
Children's cognitive maps are less developed than those of adults and are known to progress through developmental stages: from landmark-centered representations to route maps, and finally to bird's-eye view survey maps. Ishikawa & Montello (2006) noted significant individual differences in spatial learning ability and pointed out that cognitive maps can be distorted without sufficient training. Given the complex topography of Japanese urban environments, characterized by narrow streets and features like slopes and rivers, understanding spatial structure is challenging for children.
Based on the above, clarifying the structure and characteristics of children's cognitive maps and how they change through local exploration is crucial for forming the foundation of disaster risk reduction education. While fieldwork is known to contribute to improving spatial knowledge, research capturing these changes through the comparison of hand-drawn maps remains insufficient
RESEARCH OBJECTIVES For children to independently choose safe evacuation behaviours without adult assistance, a cognitive map that accurately grasps the local space plays an important role. It is believed that as the cognitive map develops, children gain an overview of their living space and can determine optimal evacuation routes. Therefore, clarifying the composition and developmental changes of children's cognitive maps is a key challenge for disaster risk reduction education.
Based on Montello's framework (Montello 1998), this study distinguishes cognitive map development into "quantitative aspects" (e.g., expansion of range) and "qualitative aspects" (e.g., changes in understanding spatial relationships and component arrangement). This study focuses specifically on the qualitative aspects to clarify how children's cognitive maps change with local exploration experience. Specifically, by having fifth-grade students (10-11 years old) create and compare hand-drawn maps before and after fieldwork, we examine: (1) The qualitative characteristics of children's cognitive maps. (2) The developmental changes in cognitive maps due to local exploration.
The aim is to clarify the cues (e.g., paths, major roads, intersections) children use to construct local space and to contribute to the improvement of spatial learning and exploration activities in disaster education.
2455 Development of Children's Cognitive Maps Before and After Fieldwork
RELATED WORK
Conception and Development of the Cognitive Map A major challenge in cognitive map research is externalizing the internal psychological map into an analyzable form. Since direct observation is impossible, indirect inference through representation is necessary. The most common method is the hand-drawn map method, where participants draw a local area from memory without reference maps.
When using this method, one must distinguish between the development of the cognitive map and drawing ability. Hart et al. noted that a child's cognitive map might be misjudged as insufficient due to undeveloped drawing skills, even if the map itself is developed. Since basic map learning (map symbols, orientation) is introduced in the third grade in Japan, the fifth-grade subjects in this study are expected to produce representations sufficient for analysis.
Research has also focused on map distortion. Siegel stated that forming accurate cognitive maps in complex urban spaces is difficult, leading to distortions relative to survey maps. Distortions such as orthogonalization (drawing diagonal roads as right angles) are common. However, as this study deals with a limited area around an elementary school, large-scale distortions of wide-area space are excluded.
Structure and Classification of Cognitive Maps Lynch presented five elements constituting urban space understanding: Paths, Edges, Districts, Nodes, and Landmarks. These concepts are frequently used in analysis. Golledge (1992) systematically organized spatial knowledge acquisition into three types: landmark knowledge, route knowledge, and survey (map-like) knowledge.
Regarding developmental stages, Downs et.al (1973) distinguished between the path-dependent "Route Map" and the bird's-eye "Survey Map." Cognitive maps are generally considered to develop from Route Maps to Survey Maps. In Japan, Iwamoto (1981) classified drawing ranges based on landmark density centered on the home. Furthermore, based on maps from home to school, he organized development into four stages, showing that survey-like representations increase with grade level.
While conventional research has widely used quantitative indicators (drawing area, number of landmarks), Montello argued that quantitative changes alone are insufficient to explain development and that qualitative aspects, such as the meaning and structuring of spatial information, should be considered separately.
METHODOLOGY
In 2023 and 2024, fifth-grade students (10-11 years old) at Aijitsu Elementary School in Shinjuku, Tokyo, participated in disaster risk reduction classes, fieldwork, and hazard map creation. Participants included 67 students in 2023 and 58 in 2024. Previous experiments showed that when children were asked to draw a route between two points (e.g., home to school), they produced linear Route Maps with little information, making analysis difficult. Therefore, to ensure sufficient information, we instructed children to draw a specific area (details below).
2456 Oka and Mori
Analysis was performed using hand-drawn maps created from memory without referring to Google Maps. During fieldwork, children collected information on dangerous places. Groups of 4–5 children were accompanied by a university student for safety, who was instructed not to offer advice.
Analysis 1 uses data from 2023, and Analysis 2 uses data from 2024.
2023 Data Acquisition
To control for the variance in information due to the location of students' homes (as home-centered maps are developed early), the area within an 800m radius of the school was divided into nine fan-shaped sectors (40-degree angles). Children performed the map drawing, fieldwork, and second map drawing for a sector that did not include their home.
2024 Data Acquisition
The route was assumed to be the daily path between home and the nearest station. Children were instructed to draw the area enclosed by their home and their two nearest stations (chosen from four stations within an 800m radius: Kagurazaka, Ichigaya, Iidabashi, and Ushigome-Yanagicho). The process followed the same order: map drawing, fieldwork, map drawing.
ANALYSIS 1 Changes in Cognitive Maps (Pre vs. Post Drawing)
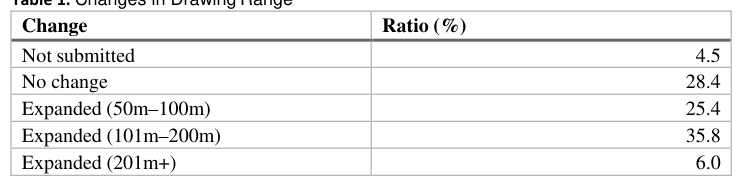
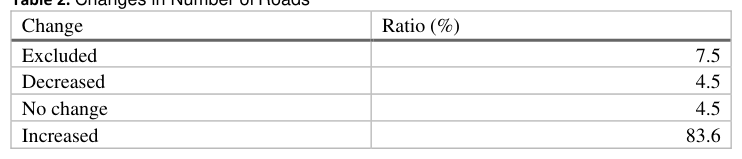
Comparing the pre- and post-fieldwork maps with Google Maps, 67% of children showed an expanded drawing range (Table 1), and 83.6% showed an increase in the number of drawn roads (Table 2). This confirms that fieldwork developed the cognitive maps of many children.
Table 1. Changes in Drawing Range Change Ratio (%) Not submitted 4.5 No change 28.4 Expanded (50m–100m) 25.4 Expanded (101m–200m) 35.8 Expanded (201m+) 6.0Table 2. Changes in Number of Roads Change Ratio (%) Excluded 7.5 Decreased 4.5 No change 4.5 Increased 83.6
Classification of Cognitive Maps Cognitive maps were classified into four types (Figure 1): [Equation or mathematical symbol available in the original paper PDF] Non map: Does not constitute a map.
2457 Development of Children's Cognitive Maps Before and After Fieldwork
[Equation or mathematical symbol available in the original paper PDF] Sketch map: Low information, not reaching Route map level. [Equation or mathematical symbol available in the original paper PDF] Route map: Roads connecting specific points are drawn, but few landmarks. [Equation or mathematical symbol available in the original paper PDF] Survey map: Many roads within the area are drawn, including landmarks. A transition to the right in Figure 1 was defined as Map refinement, and a transition to the left as Map simplification.
Tables 3–6 summarize changes in drawn elements. The vertical axis represents map refinement, and the horizontal axis represents the change in element inclusion. No deterioration of information (from included to excluded) was observed. When maps were refined, 51.85% of children increased intersection drawings (Table 3). Of those, 25.93% added traffic signals (Table 4). 11% added slopes (Table 5), and 40.74% added rivers (Table 6). Children with unchanged map refinement ("Map stasis") largely showed no change in elements. Since only one child showed map simplification, supporting the view that simplification after fieldwork is rare, this case was excluded from the analysis in Tables 3–6.
1. Non map 2.Sketch map 3.Route map 4.Survey map Figure 1: Classification of Cognitive Maps
Table 3. Intersections rendering rate (%) Typological transition No Included Shift to Included Included Map refinement 40.7 51.9 7.4 Map stasis 72.2 13.9 13.9Table 4. Traffic Signals rendering rate (%) Typological transition No Included Shift to Included Included Map refinement 66.7 25.9 7.4 Map stasis 63.9 13.9 22.2Table 5. Sloping Streets (%) Typological transition No Included Shift to Included Included Map refinement 88.9 11.1 0.0 Map stasis 91.7 5.6 2.8Table 6. Natural Features rendering rate (%) Typological transition No Included Shift to Included Included Map refinement 59.3 40.7 0.0 Map stasis 69.4 25.0 5.6
2458 Oka and Mori
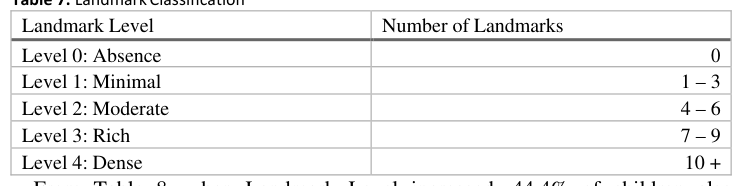
Classification of Cognitive Maps Cognitive maps were classified into five levels based on the number of landmarks understandable to a third party (Table 7). Personal landmarks (e.g., "friend's house") were excluded. An increase in level indicates an increase in landmarks.
Table 7. Landmark Classification Landmark Level Number of Landmarks Level 0: Absence 0 Level 1: Minimal 1 – 3 Level 2: Moderate 4 – 6 Level 3: Rich 7 – 9 Level 4: Dense 10 + From Table 8, when Landmark Level increased, 44.4% of children also increased intersection drawings. Similarly, increases were seen in traffic signals (22.22%, Table 9), slopes (11.1%, Table 10), and rivers (33.3%, Table 11).Table 8. Intersections rendering rate (%) (by Landmark Level) Typological transition No Included Shift to Included Included Level increases 33.3 44.4 22.2 Level Unchanged 57.1 25.0 17.9 Level decreases 66.7 0.0 33.3Table 9. Traffic signals rendering rate (%) (by Landmark Level) Typological transition No Included Shift to Included Included Level increases 59.3 22.2 18.5 Level Unchanged 60.7 21.4 17.9 Level decreases 88.9 0.0 11.1Table 10. Sloping street rendering rate (%) (by Landmark Level) Typological transition No Included Shift to Included Included Level increases 88.9 11.1 0.0 Level Unchanged 89.3 7.1 3.6 Level decreases 100.0 0.0 0.0Table 11. Natural features rendering rate (%) (by Landmark Level) Typological transition No Included Shift to Included Included Level increases 63.0 33.3 3.7 Level Unchanged 64.3 35.7 0.0 Level decreases 77.7 11.1 11.1
ANALYSIS 2 Changes in Cognitive Maps (Pre vs. Post)
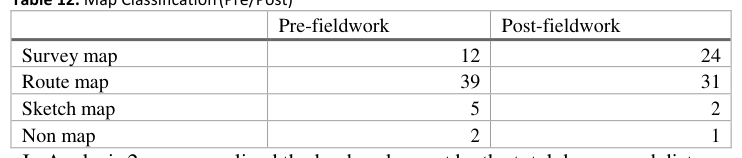
Cognitive maps were obtained from 58 children (Table 12). After fieldwork, 34.5% showed Map refinement, 58.6% showed No change, and 6.9% showed Map simplification.
2459 Development of Children's Cognitive Maps Before and After Fieldwork
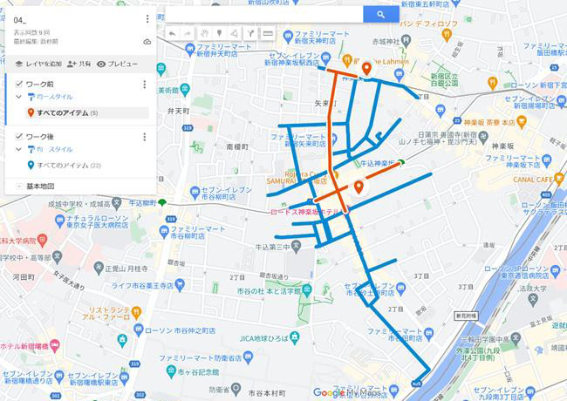
Table 12. Map Classification (Pre/Post) Pre-fieldwork Post-fieldwork Survey map 12 24 Route map 39 31 Sketch map 5 2 Non map 2 1 In Analysis 2, we normalized the landmark count by the total drawn road distance to account for drawing range differences (Figure 2 shows an example of digitizing maps to Google Maps).Figure 2: Example of transferring a cognitive map to Google Maps Comparison Per Unit Distance
Table 13 shows changes in landmarks per unit distance. Even though refined maps had longer road distances (which could dilute the ratio), many children still showed an increase in landmarks per unit distance.
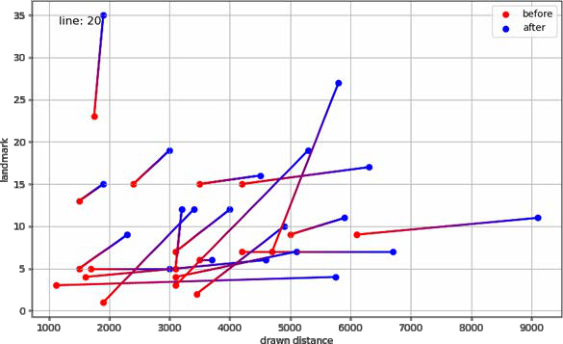
Figure 3: Changes in Road Length and Number of Landmarks Before and After Fieldwork
2460 Oka and Mori
Table 13. Changes in Landmarks Per Unit Distance Typological transition Increased landmarks Decreased landmarks Map refinement 10 8 Map stasis 10 15 Map simplification 1 2 Figure 3 plots the changes for 20 children whose road distance and landmark counts both increased. The total drawn distance increased by a factor of 1.46, while the number of landmarks increased by a factor of 1.65. This indicates that when cognitive maps refine, both roads and landmarks increase.
Relationship Between Roads and Landmarks We distinguished between known information (drawn pre-fieldwork) and new information (drawn only post-fieldwork). Among the 20 children in Figure 3, 61.9% had a higher landmark density in the known area than in the new area. Notably, 38.1% of children drew zero landmarks in the new area. This suggests that roads develop preferentially over landmarks in the cognitive map.
Relationship Between Major Roads and Alleys Roads were classified into Major Roads (one or more lanes each way with a center line) and Alleys (narrow roads). For Major Roads, 82.6% of children showed an increase in drawn distance or ratio (Refinement). Conversely, only 17.4% showed a decrease. For Alleys, 63.0% showed refinement, while 37.0% showed a decrease. The decrease rate for Alleys (37.0%) is double that of Major Roads (17.4%), suggesting that children acquire Major Roads as new information preferentially over Alleys.
CONCLUSION
Qualitative Characteristics of Children's Cognitive Maps Approximately 50% of the maps were Route Maps, 40% were Survey Maps, and 10% were below Route Map level, indicating that fifth-graders' cognitive maps are generally immature. Specific landmarks such as intersections and traffic signals were frequently drawn. While detailed analysis by facility type was not possible due to the low number of specific landmarks understandable to third parties, quantitative analysis using total count and density was possible.
Developmental Changes Due to Local Exploration Both analyses confirmed a tendency for cognitive maps to refine after fieldwork. Analysis 1 showed an increase in intersections, signifying a shift from Route Maps to Survey Maps (roads recognized as connected networks). Children whose maps did not change failed to recognize intersections, suggesting an inability to grasp the area as a continuous surface. The increase in the depiction of slopes (Analysis 1) suggests that the disaster class instruction ("water gathers in low places") successfully directed children's attention to previously unrecognized topography. Analysis 2 revealed that while landmark counts grew faster than road distance overall, newly acquired road sections had very few landmarks. This supports the conclusion that cognitive maps do not refine roads and landmarks simultaneously;
2461 Development of Children's Cognitive Maps Before and After Fieldwork
rather, roads refine first. This suggests a staged process in spatial cognitive development where the skeleton of the space (road network connectivity) is constructed first, and attribute information (landmarks) is added later. Regarding roads, Major Roads are refined preferentially over Alleys. Further analysis is needed to determine if this is due to road size or the specific paths taken during fieldwork. Additional research is also required to understand the timing and factors involved in the later refinement of landmarks.
SUMMARY Through two analyses, it was confirmed that fieldwork promotes the development of cognitive maps from Route Maps to Survey Maps. Within Survey Maps, road refinement precedes landmark refinement. In children's cognitive maps, the relationship between roads is easily refined, while landmark refinement tends to be delayed. From a disaster risk reduction perspective, prioritizing the "Survey Map-ization" of the local area by raising awareness of roads and intersections is effective for facilitating evacuation route selection. Furthermore, the increase in slope depiction suggests that intentional instruction can guide cognitive map development. Future disaster education should consciously integrate the search for evacuation sites to meaningfully refine cognitive maps for safety.
ACKNOWLEDGMENT This work was supported by the Japan Society for the Promotion of Science (JSPS) KAKENHI.
REFERENCES
Tolman, E. C. (1948). Cognitive maps in rats and men. Psychological Review, 55(4), 189–
208. Downs, R. M., & Stea, D. (1973). Image and Environment: Cognitive Mapping and Spatial Behavior. Aldine Publishing. Golledge, R. G.(1992), "Place recognition and wayfinding: Making sense of space",
Geoforum, 23(2), 199–214. Ishikawa, T. & Montello, D. R.(2006), "Spatial knowledge acquisition from direct experience in the environment: Individual differences in the development of metric survey knowledge", Cognitive Psychology, 52(2), 93–129. Iwamoto, H.(1981), "The structure of children’s cognitive environmental images of their
immediate neighborhood", Geographical Review of Japan, 54(3), 127–141. Lynch, K. (1960). The Image of the City. The MIT Press. Montello, D. R. (1998). A new framework for understanding the acquisition of spatial knowledge in large-scale environments. In M. J. Egenhofer & R. G. Golledge (Eds.), Spatial and temporal reasoning in geographic information systems (pp. 143–154). Oxford University Press.
LISTED IN THE AHFE DIGITAL BOOKSTORE CATALOGUE
Explore the complete digital volume
Human Factors in Design, Engineering, and Computing
Read this individual research paper free through the original publisher, or explore the full digital proceedings book.
ISBN 978-1-964867-75-5
Explore this ISBN in the AHFE Bookstore ↗Listed in the July 2026 bookstore catalogue; search by ISBN to confirm current availability · Digital book purchase optional