John Maris (2025). The Application of Dynamic Non-Linear Scales to Aircraft Tape Display Instruments. In: Human Factors in Design, Engineering, and Computing. AHFE Open Access, vol. 199, pp. 403–412. https://doi.org/10.54941/ahfe1006852
The presentation introduces the novel Dynamic Non-Linear Display (DNLD) concept. DNLD is a ground-up reworking of the classic tape display format commonly used in aerospace flight instruments and process control systems, based on the application of advanced human factors principles. DNLD reconciles the mutually conflicting demands for adequate precision, sufficient display range, and dynamic legibility, that hamper conventional tape displays. Multiple simulator and flight evaluations have shown how DNLD can confer significant safety, functional, and situational advances in the cockpit, telemetry room, or ground control station. Demonstrated DNLD benefits include complete legibility at very high rates of parameter change, elimination of display saturation, and the ability to keep key parameters and trend vectors in view at all times, without comprising the requirements for fine-tracking performance. DNLD is being adopted by a number of civilian and military flight test organizations. The presentation and paper illustrate the foundational principles of DNLD, including informative videos from DNLD aerospace evaluations. The DNLD concept has been recognized through awards presented by the Society of Flight Test Engineers and the International Test Pilot School (ITPS) at their respective 2023 Annual Symposia.
Tape displays are becoming prevalent for processes control, powerplant monitoring and aviation applications. Before the advent of tape displays, round-dial mechanical instruments ruled the cockpit. As aircraft performance increased, and flight envelopes expanded, the limitations of mechanical altimeters led to the 3-pointer altimeter being essentially barred for Transport Category aircraft applications (Chernikoff, Ziegler, 1964). Current tape displays of aircraft airspeed and altitude almost exclusively employ a fixed-pointer, moving-scale format, with linear scale markings preferred (Department of Defense, 2020, sec. 5.2.4.1.4). This entails several compromises, including a tradeoff between display resolution, scale range, and display legibility in dynamic environments. Furthermore, the limited scale extent causes the tape to scroll off the edges of the display area. This limits the display’s usability for trend-monitoring, particularly in relation to parameter limitations (“red lines”) that may be out of view, but which may
appear suddenly at the scale extremes during highly dynamic events. For these reasons, MIL-STD-1472H states a clear preference for moving-pointer, fixed-scale implementations over the fixed-pointer, moving-scale format that has been almost universally adopted for airspeed and altitude depiction in Electronic Flight Instrument Systems (EFIS) (ibid., sec. 5.2.4.1).
EFIS displays provide information related to the control and supervision of the aircraft’s trajectory. The former is a tactical task which involves relatively tight control and tracking of a desired parameter, such as aircraft altitude. The latter is a broader strategic task which entails the maintenance of proper Situational Awareness (SA) by the pilot.
Endsley (1995) defines three levels of SA: Level 1: Perception of the elements in the environment. Level 2: Comprehension of the current situation. Level 3: Projection of the future status. The basic primary flight display (PFD) depictions of airspeed, altitude and vertical speed directly address Level 1 SA for their respective parameters, but they provide limited Level 2 and Level 3 information, as they represent a “snapshot” of the instantaneous aircraft trajectory. Hiremath et al. (2009) note that trend information is also difficult to obtain from tape displays. Rate-aiding trend vectors and preselector “bugs” are often added to airspeed and altitude tape displays to provide projection (i.e. Level 3) information, but this capability is compromised with conventional displays, because the values are often parked off-scale due to the limited range of linear scales. This drawback is sometimes addressed by presenting the saturated value in numerical format, but English (2012) states that this partial solution “…is limited to one or two values and requires cognitive rather than perceptual processing” which necessarily entails an increase in workload.
The saturation of linear scales and their predictors highlights the trade- off between scale range, scale resolution, and display legibility. Optimization of any pair of these elements must be at the expense of the third, or other concessions: Mejdal et al. (2001) note that the ability to truncate electronic scales is leading designers to display solely the current value, which “can easily lead them into designing a poorer interface.” This compromise is unavoidable with mechanical instruments, where the scale parameters are constrained by the physical tape, but the limitation has been carried over to electronic tape displays, where no such limitations exist.
This paper addresses the development from first principles of a novel Dynamic Non-Linear Display (DNLD) that addresses the shortcomings inherited from mechanical scale tape displays.
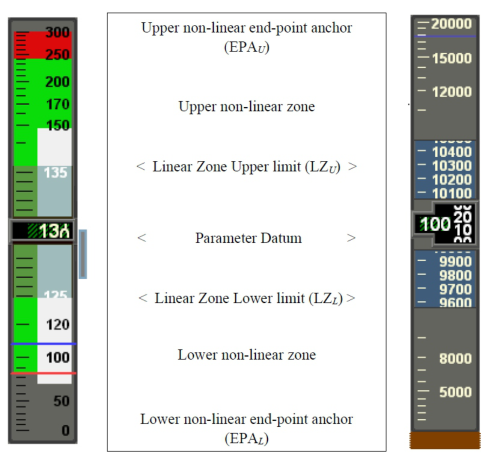
DESIGNING FROM FIRST PRINCIPLES DNLD explicitly addresses Endsley’s three SA levels by smoothly blending a linear fine-tracking region (for SA Level 1) bordered on each side by two non-linear scales anchored to meaningful upper and lower endpoints (Level 2 SA) (Figure 1). The latter change dynamically to ensure that critical values, predictors, and pre-set bugs never saturate (Level 3 SA). The resulting
The Application of Dynamic Non-Linear Scales to Aircraft Tape Display Instruments 405
tape can be oriented horizontally or vertically according to its function (e.g. altitude or heading), but the same concepts apply to both implementations.
Figure 1: DNLD essential elements.
Linear tracking zone The central part of the DNLD comprises a moving linear scale with the current value (P) of the measured parameter (airspeed, altitude, heading, etc.) at the scale’s mid-point. A linear scale is used in this region to facilitate closed- loop fine-tracking of the displayed parameter. This zone is also functionally identical to a traditional linear tape display, which ensures that pilots will be immediately familiar with the fundamental operation of the display for critical closed loop tracking tasks.
The lower and upper extreme values of the linear zone are identified as LZL and LZU respectively in the material that follows. The resolution and markings of the linear DNLD zone were established using benchmark requirements of the tracking task. For example: an airspeed discrimination of ± one knot has historically been provided, with an altitude discrimination of ± 20 feet. The linear index markings and scale numerals adopted current conventions to optimize the learning transfer from traditional displays.
End-Point Anchors English (2012) notes that “expanded range displays did not adversely affect the speed or accuracy of retrieval of center system value.” End-point anchors (EPA) define the upper and lower extremes of the DNLD tape. The EPAs ensure that a broad range of values is always displayed graphically (e.g. the entire airspeed envelope from zero to the Vmo/Mmo upper airspeed/Mach limits), while having the flexibility to expand if the preset limits are
406 Maris
approached. The broad scale coverage compared to traditional linear displays minimizes the chance of predictors and bugs (such as airspeed and altitude preselectors) going off scale. Correct selection of the EPAs also ensures that vital information (such as a terrain depiction in the altitude display) always remains in view, thereby facilitating Levels 2 and 3 SA.
The EPAs may be static or floating values, depending on these considerations. Table 1 illustrates sample characteristics for the lower (EPAL) and Upper (EPAU) values for airspeed, altitude and heading parameters.
Table 1: DNLD end-point anchor examples.
Table available in the original PDF paper.
Parameter Lower EPA1 (EPAL) Upper EPA1 (EPAU) Vmo / Mmo Airspeed 0 KIAS or min. displayable airspeed
Altitude 0 feet 2× current altitude (At least 5,000 ft) Heading Current heading –179
Current heading +179
1These values can float if necessary if the parameter value approaches a limit.
Non-Linear Scales The upper and lower non-linear scales connect the linear zone with their respective EPAs to cover the full range for the parameter being displayed. These non-linear scales are defined by their upper and lower endpoints:
1. The endpoints of the upper non-linear scale are defined by LZU and EPAU. 2. The endpoints of the lower non-linear scale are defined by LZL and EPAL.
Both non-linear scales constantly and dynamically adjust to fit these end points, contracting away from the current parameter value P in the center of the linear display. The non-linear scale algorithms are continuously adjusted to avoid any discontinuities in values or scale gradients at the intersection of the linear and non-linear regions. This is to preclude any distracting display “jumps” across this transition when the displayed values are changing, as discussed below.
The upper and lower scales are not necessarily symmetrical, because the two EPA’s that define their endpoints may not be equally spaced from the current parameter value. For example, at high aircraft speeds, the airspeed parameter will be closer to the Vmo/Mmo (maximum operating speed/Mach number) EPA than the minimum displayable airspeed EPA. Conversely, the non-liner scales would be symmetrical for a typical DNLD heading display, where both EPAs are ±179
from the current heading value.
The mathematical definition of the non-linear scales can take many forms, such as polynomial, logarithmic, exponential or trigonometric. The current implementation in the DNLD protypes uses quadratic or higher order Bézier curves to satisfy the preceding scale requirements. Bézier curves have several advantages for this application: unlike log scales, they can display zero
The Application of Dynamic Non-Linear Scales to Aircraft Tape Display Instruments 407
values; they are smooth and can be scaled indefinitely; furthermore, their start and end points are tangent to the first and last section of the defining Bézier polygon, thereby avoiding unwanted slope discontinuities at the curve endpoints. For these reasons, Béziers are used extensively to smooth animation trajectories in user interface design – a close parallel to the scale animation characteristics required for DNLD.
The parametric equation for a display parameter BL(t) on the lower non- linear region of a quadratic Bézier curve is:
Equation reproduced from the original PDF.
1 −t2 (LZL −PL) + t2(EPAL −PL) where 0 ≤t ≤1 (1)
Where: BL(t) is the Bézier display value, in parametric form EPAL is the lower End Point Anchor LZL is the lower extreme value of the linear zone PL is the parameter that defines the quadratic Bézier curve t is the control parameter that sweeps the Bézier curve from LZL to EPAL Similarly, the display parameter BU(t) on the upper non-linear region of a quadratic Bézier curve is defined by:
Equation reproduced from the original PDF.
1 −t2 (LZU −PU) + t2(EPAU −PU) where 0 ≤t ≤1 (2)
Where the symbols have their previous meanings, mapped to the upper limits instead of the lower limits.
Equation reproduced from the original PDF.
The corresponding derivative for the upper Bézier curve is given by: B′ U (t) = 2(1 −t)(PU −LZU) + 2t(EPAU −U) (4)
By definition, (t) = 0 at the intersections of the linear and non-linear zones, so the derivatives at these points reduce to:
(B′
Equation reproduced from the original PDF.
and
(B′
U (t) = 2(PU −LZU)) (6) Because the linear zone only has a single scale, the non-linear scale gradients at these points must equal each other (B′ L (t) = B′
U (t)) and they both must equal the gradient of the linear zone.
Accordingly:
((PL −LZL) = (PU −LZU)) (7)
408 Maris
Rearranging:
((LZU −LZL) = (PU −PL)) (8) Equation (8) defines a simple relationship between the constantly varying Bezier parameters PU and PL and the fixed linear scale range (LZU – LZL). Application of this constraint into equations (1) and (2) above achieves the desired matching gradients between the linear and non-linear zones.
Consolidated DNLD The consolidated DNLD is a composite of the linear zone and the upper and lower non-linear scales, terminating at the EPAU and EPAL respectively (Figure 1). The DNLD is supplemented by the traditional graphic predictors (e.g. airspeed and altitude trend lines) and preset “bugs” (e.g. airspeed and altitude preselect values).
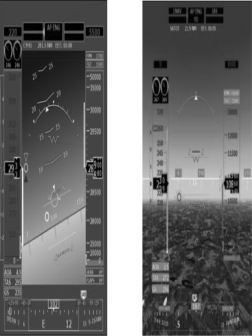
Figure 2 shows DNLD implementations of airspeed, altitude, and heading integrated into a simple PFD and a Synthetic Vision System (SVS) display, as trialed in the P180 Avanti aircraft used to develop the technology.
Figure 2: DNLD PFD and SVS displays.
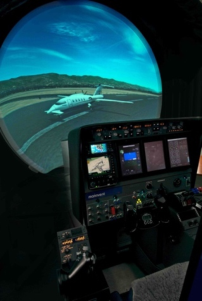
DNLD DEVELOPMENT AND TESTING DNLD development has followed a progression from Technology Readiness Level (TRL) 1 through TRL 7, starting with desktop simulations, followed by human factors simulator evaluations, and culminating in developmental flight testing in a P180 Avanti research aircraft (Figure 3). Beta DNLD software was also integrated for an evaluation using the Harvard aircraft operated by the Flight Research Laboratory of Canada’s National Research Council (NRC-FRL). The objectives of the development process were:
1. To validate the basic concept of DNLD, initially for the PFD depiction of airspeed, altitude, and heading information.
The Application of Dynamic Non-Linear Scales to Aircraft Tape Display Instruments 409
2. To determine the optimum display allotment between the linear and non- linear DNLD zones. 3. To establish heuristics for the DNLD end-point anchors for each displayed parameter. 4. To characterize DNLD behavior during high rates-of-change of the displayed parameters. 5. To address phantom scale markings. 6. To assess the impact of DNLD on pilot SA.
Display Allocation The initial iterations of the DNLD research protypes allocated one-third of the display to the central linear region, with the remaining two-thirds equally allotted to each of the flanking non-linear regions. No reason was found to change this equal allocation, and it has remained the default for all DNLD prototypes to date.
Figure 3: Human Factors Simulator and P180 Avanti development platforms.
End-Point Anchors Heuristics The EPA settings proved pivotal to deriving the greatest DNLD benefits, although they were not critical to the usability of the DNLD because the linear fine-tracking zone is unaffected by the EPAs. In general, three different desired EPA characteristics were identified: Fixed, Adaptive, and Floating.
Fixed EPAs are static, as used for the DNLD display of compass information at ± 179
from the current aircraft heading. Adaptive EPAs, as used for the display of airspeed, are static but expand as the scale extremes are approached to always keep the current parameter value and trend information in view. Floating EPAs, as used for the display of altitude, adjust constantly depending on the parameter value. The lower altitude EPA is generally set at mean sea level, although this value can expand slightly to display altitudes below sea level, if required. This ensures that the terrain elevation is always visible on the altitude display, even when the terrain is well below the aircraft, in contrast to linear displays which typically only
410 Maris
have a range of a few hundred feet. This adds considerably to the Level 2 and 3 pilot SA.
During DNLD development, the altitude EPAU was established at twice the aircraft’s current altitude, with a hard minimum of 5,000 feet. The EPAU expands as the aircraft climbs until the peak EPAU corresponds to the aircraft’s ceiling. A small-scale extension is added as the aircraft approaches its ceiling, to ensure that the altitude display never saturates. The resulting altitude display has the benefit of becoming increasingly sensitive (i.e. a larger scale) near the current altitude, and at lower altitudes, while constantly showing the terrain elevation regardless of the aircraft’s altitude. In contrast, a typical linear altimeter scale has a range of only ±500 feet, so display and predictor saturation are the norm.
High Rate-of-Change Assessment A key subjective evaluation of DNLD was an assessment of its performance during high rate-of-change maneuvers. This was initially evaluated using a dedicated desktop application that allowed real-time adjustments of airspeed and altitude rate-of-change for DNLD and conventional displays in parallel. DNLD was then evaluated in a human factors simulator during single- and multi-axis high-rate maneuvers, such as Cuban eights and low- and high- speed unusual attitudes. High-rate tests were also performed in NRC-FRL’s aerobatic Harvard aircraft. No multi-axis high-rate testing was performed in the P180 aircraft because it is not certified for acrobatic maneuvers.
The results of these tests were very positive. The simulation studies showed that the application of the EPAU heuristics resulted in unified DNLD graphic displays that were usable from orbital airspeeds and altitudes all the way to a standstill at zero altitude, at rates of change exceeding 60,000 ft/minute. As expected, the linear regions move rapidly during such extreme maneuvers, but this had no impact on pilot performance, because these extreme maneuvers did not entail fine-tracking tasks, and the effect was no worse than for conventional linear displays.
The optical flow of display parameters (such as altitude tics and captions) was smooth and predictable, and it proved easy to graphically gauge this optical flow to determine how rapidly a limit (such as an airspeed limit or an altitude floor) was being approached. These characteristics should make the use of DNLD practical for military HUD implementations, which largely shun tape displays because of their adverse characteristics during aggressive maneuvering. In particular, the languid motion of the DNLD displays obviated the false HUD roll cues caused by traditional airspeed and altitude tapes moving in opposition to each other during rapid climbs or descents.
Phantom Scale Markings An emergent DNLD characteristic observed during the development process was the sudden appearance and disappearance of tick-marks and captions in the non-linear zones. These intermediate display markings were implemented to achieve a relatively uniform optical density while displaying operationally
The Application of Dynamic Non-Linear Scales to Aircraft Tape Display Instruments 411
meaningful increments and avoiding nonsensical scale divisions resulting from interpolation (e.g. an altitude scale marking at 13,963 ft). This necessitated markings that popped-in and popped-out of view as the scales changed, to maintain a uniform optical density. This characteristic is not unique to DNLD – conventional linear tape displays have markings that appear and disappear at the edges of the display – DNLD differ only in that these transitions occur in the middle of the display area, instead of at the edges. The issue was addressed simply and satisfactorily by fading-in and fading-out these “phantom” markings over a period of 2–3 seconds, thereby eliminating any distractions caused by their sudden appearance and disappearance.
Pilot SA Assessment Throughout these evaluations, there were no observed adverse impacts on pilot fine-tracking performance. The DNLD was inherently smooth in operation for the display of airspeed, altitude and heading, even during extreme maneuvering. The asymmetries between the linear and non-linear zones were not perceived by the operators because of the engineered-in seamless blending of the three zones. In addition, no negative feedback was received regarding the initial equal allocation between the three zones, so this was retained throughout the experiments.
One application for the enhanced SA provided by DNLD is for Electronic Standby Instrumentation Systems (ESIS), which typically incorporate linear tape displays of airspeed, altitude and heading. In the worst case, these stand- alone instruments must provide the entire air-picture for the crew in a very small display, so any improvement in SA or workload reductions would be very beneficial in this application. Formal pilot SA evaluations are planned for the next phases of testing to validate DNLD’s contributions to all three levels of pilot SA for such displays.
CONCLUSION
DNLD is an evolution of the traditional linear tape display from first principles that reconciles the conflicting demands of high resolution, a broad scale range, and good legibility, particularly under dynamic conditions. DNLD was evaluated through TRL-7 via desktop, simulator, and flight evaluations and the concept has so far fulfilled these objectives.
Several heuristics were identified to establish the end-point anchors and transitions that define the DNLD non-linear (Bézier) regions. The resulting composite display proved legible through all flight regimes and did not allow trend vectors and preselector indices to saturate. Fine-tracking performance in the linear zone was generally equivalent to conventional displays, but DNLD demonstrated a potential to enhance Level 2 and Level 3 pilot SA due to the significantly expanded usable display range, which always keeps critical parameters (such as the terrain surface for the altimeter tape) in view.
DNLD would benefit from ongoing research to advance the concept to TRL-8 and TRL-9. The basic technology is ready for further refinement and formal experimental evaluation using established SA and workload assessment tools such as the Situational Awareness Rating Technique (SART); Situation Awareness Global Assessment Technique (SAGAT); the Bedford
412 Maris
Workload Rating Scale; or NASA’s Task Load Index (TLX). Potential near- term applications for DNLD include the airspeed altitude and heading tapes in PFDs, standby displays, HUD and SVS displays.
ACKNOWLEDGMENT
The authors would like to acknowledge the Society of Flight Test Engineers (SFTE) and the International Test Pilot School for the positive feedback provided relating to the DNLD concept, as well as NRC-FRL for their invaluable flight test assistance.
REFERENCES
Chernikoff, R. & Ziegler, P. N. 1964, An experimental evaluation of four types of altimeters using both pilot and enlisted men subjects interim report (Experimental evaluation of four types of altimeters using both pilot and nonpilot subjects). Department of Defense 2020, MIL-STD-1472H, Human Engineering, Federal
Information & News Dispatch, LLC, Washington. Endsley, M. R. 1995, “Toward a Theory of Situation Awareness in Dynamic Systems”, Human Factors: The Journal of the Human Factors and Ergonomics Society, vol. 37, no. 1, pp. 32–64. English, D. 2012, Two-Tail Non-Linear Moving Tape Displays, ProQuest Dissertations & Theses. Hiremath, V., Proctor, R. W., Fanjoy, R. O., Feyen, R. G. & Young, J. P. 2009,
"Comparison of Pilot Recovery and Response Times in Two Types of Cockpits" in Human Interface and the Management of Information. Information and Interaction Springer Berlin Heidelberg, Berlin, Heidelberg, pp. 766–775. Mejdal, S., McCauley, M. E. & Beringer, D. B. 2001, Human Factors Design Guidelines for Multifunction Displays.
LISTED IN THE AHFE DIGITAL BOOKSTORE CATALOGUE
Explore the complete digital volume
Human Factors in Design, Engineering, and Computing
Read this individual research paper free through the original publisher, or explore the full digital proceedings book.
ISBN 978-1-964867-75-5
Explore this ISBN in the AHFE Bookstore ↗Listed in the July 2026 bookstore catalogue; search by ISBN to confirm current availability · Digital book purchase optional