Hanitriniaina Marielle Rakotozanany, Pierre Nicolle, Josué Ratovondrahona, Bob Saint-Fleur, Andry Razakamanantsoa, Samuel Razanaka, Mahatody Thomas, Olivier Payrastre (2026). Interpretable Analysis of Rainfall-Runoff Forecasting Using MLP and Perturbation-based Approach in the Sisaony River, Madagascar. In: Human Interaction and Emerging Technologies (IHIET-FS 2026): Future Systems and Design Applications. AHFE Open Access, vol. 235, pp. 249–258. https://doi.org/10.54941/ahfe1007279
This study examines the performance of a rainfall-runoff model based on a Multi-Layer Perceptron (MLP), supplemented by an Explainable Artificial Intelligence (XAI) analysis using a perturbation-based approach. The MLP model predicts the hourly instantaneous discharge of the Sisaony River in Madagascar based on precipitation, two estimates of potential evapotranspiration (PET), and past discharge data, for forecast horizons of 24 hours, 18 hours, 12 hours, 9 hours, 6 hours, or 3 hours. The results are compared to forecasts obtained from a conventional GRP (Génie Rural pour la Prévision de crue)-type rainfall-runoff model and show that the MLP performs well, particularly for longer horizons. To address the issue of interpretability, a perturbation-based explainability approach was applied by replacing input variables with zero or their mean. The analysis reveals that discharge is the most influential variable, confirming the strong autoregressive behavior of the system. Finally, the study demonstrates that combining deep learning models with explainability techniques provides both strong predictive performance and improved understanding of model behavior, offering a promising approach for flood forecasting and risk management in data-limited regions.
With the rise of artificial intelligence, deep learning methods have emerged as powerful tools capable of automatically extracting complex relationships from large databases, particularly for nonlinear phenomena. Deep learning plays a significant role in solving environmental problems, but these models have the limitation of reduced interpretability (Ding et al., 2019; Kiwelekar et al., 2020). In the field of hydrology, for example, deep learning models applied to hydrological forecasting are effective but are considered as “black box”
models (Kratzert et al., 2018). In this study, we developed a deep learning- based model, specifically a Multilayer Perceptron (MLP), to predict river flood discharges. To ensure model interpretability, this approach was complemented by a perturbation-based method consisting of variable ablation (replacement with mean) to interpret the model and understand which parameters most influence the model’s prediction. As a case study, we have selected a major river in Madagascar, the Sisaony, which flows through the city of Antananarivo and for which hourly precipitation and historical flow rate records are available. Given the city’s exposure to flood risks, Antananarivo has an agency responsible for flood protection, the Antananarivo Plain Flood Protection Authority (APIPA), which manages a flood warning system based on a permanent network of rainfall and discharge measurements. However, APIPA does not have a hydrological forecasting model; flood warnings rely primarily on the experience of forecasters, as well as on the analysis and observation of past events. This approach, however, has limitations in a city regularly affected by flooding, significant risks of levee breaches. In this study, APIPA observational data series are used to train and evaluate MLP models that predict flood discharges on the Sisaony River for various time horizons (3h, 6h, 9h, 12h, 18h, 24h), based on observed (or forecast) rainfall, past discharge data, and estimates of potential evapotranspiration. The performance of this MLP model was compared to a GRP-type rainfall-discharge forecast model (Tilmant et al., 2023), widely used for flood forecasting in France. Furthermore, the combination of a deep learning-based model and explainability approaches makes it possible to analyze the nature of the dependencies learned by the model, in order to verify whether it relies primarily on autoregressive dynamics or whether it effectively captures the complex nonlinear relationships between hydrometeorological variables.
METHODOLOGY
In this study, the following steps were followed to implement and analyze flood prediction models for the Sisaony River: (1) Collection and preprocessing of data provided by APIPA, and the creation of continuous hourly time series for rainfall, discharge, and potential evapotranspiration based on these data, (2) Development of MLP-type rainfall-discharge models for multiple time horizons, (3) Calibration of GRP models using the same datasets and for the same time horizons, (4) Comparison of the MLP and GRP models using two metrics commonly used in flood forecasting (Nash-Sutcliffe and persistence criteria), (5) An explanatory analysis of the MLP model.
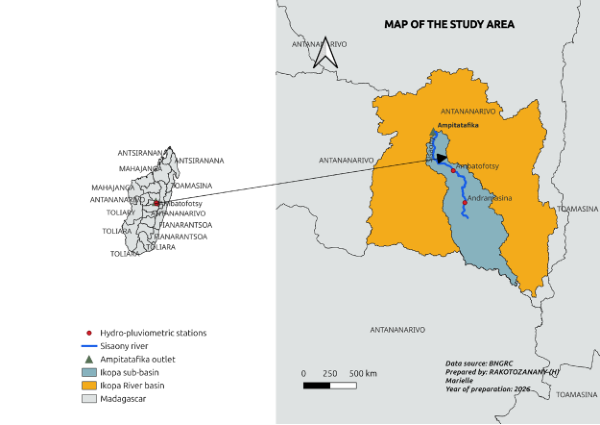
Data This study focuses on the Sisaony river sub-watershed located within the Ikopa river basin. Its outlet is situated near the city of Antananarivo, the capital of Madagascar (Ampitatafika outlet). The map shown in Figure 1 delineates the studied watershed and locates the upstream hydro-pluviometric stations at Andramasina and Ambatofotsy, as well as the hydrometric gauging station at the basin’s outlet in Ampitatafika (drain area of 726 km²).
Interpretable Analysis of Rainfall-Runoff Forecasting 251 A set of hourly hydrometeorological data was collected and used to feed hydrological flow prediction models. These data include the following variables: precipation P obtained from local APIPA rain gauge stations and averaged over the Sisoany River watershed at Ampitatafika using the Thiessen polygon method, potential evapotranspiration 1 PET calculated from temperature data extracted from NASA POWER, using the modified Thornthwaite method (Pereira et Pruitt, 2004), potential evapotranspiration
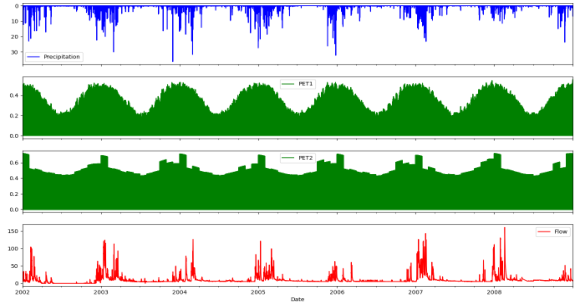
2 PET calculated from temperature data extracted from NASA POWER, using the Oudin method (Oudin et al., 2005), and instantaneous gross discharge Q measured hourly at the APIPA’s Ampitatafika gauging station on the Sisaony River. This data represent the target variable to be predicted in the rainfall- runoff model. Upon verification, these data show some missing values for certain periods of limited duration (typically less than 24 hours). These gaps were reconstructed using a traditional GR4H hydrological model (Perrin et al., 2003) because the discharge simulation results from this model relatively well follow the trend of the observed discharge data. This reconstruction was also necessary in order to properly calibrate the GRP model. Figure 2 presents diagrams illustrating the datasets used for rainfall-runoff modeling.
Figure 1: Map of the Sisaony river watershed in Ampitatafika, showing the rainfall- runoff stations located upstream at Andramasina and Ambatofotsy, as well as the hydrometric station at the river mouth. The watershed’s drainage area is 726 km².
Development of the MLP Model
input variables used To estimate the flow rate ( ) Q t at time t, we assume that the flow rate depends on the precipitation ( ) P t i − and the potential evapotranspiration ( ) PET t i − observed in historical data ( ) 1 i p ≤≤ , as well as the past flow rate ( ) Q t j − h j p ≤ ≤ . p corresponds to the time window of data considered by the model: a sliding time window of 10 consecutive days (i.e., 240 p hours = ) was used here. h corresponds to the forecast horizon
under consideration, i.e., { } 3 ,6 ,9 ,12 ,18 ,24 h h h h h h h ∈ . For each forecast horizon h, the model learns a relationship of the form: ( ) ( ) ( ) ( ) ( ) ( ) 1 2 , , , Q t f Q t j P t i PET t i PET t i = − − − − (1)
The models therefore use precipitation and PET data up to time t. To make accurate forecasts with these models, it is therefore necessary to be able to forecast precipitation and PET over the period [t−h;t−1]. For the training and evaluation of models, observed data were used here, which allows us to avoid the uncertainties associated with weather forecasts.
Figure 2: Diagrams of the datasets used to forecast hydrological flows in the Sisaony River at Ampitatafika. The data include: basin-wide average precipitation from APIPA rain gauge stations (P), potential evapotranspiration calculated using the modified Thornthwaite 1 PET and Oudin 2 PET methods, and hourly discharge measured at the Ampitatafika outlet, the model’s target variable.
Data spliting The hydrometeorological data available for the period from 2002 to 2008 were split to distinguish between two key phases of the modeling process: training (and validation) and testing (or evaluation). Table 1 below presents in detail the periods used for training and testing the data.
Table 1: Time periods used for model training and evaluation.
Table available in the original PDF paper.
Periods Inputs Variables Target Variables Flow rate reconstitute with GR4H
Training Start: 2002/01/11 00:00:00 End: 2007/08/10 13:00:00
Precipitation, Oudin PET, Thornthwaite PET, flow rate reconstitute with GR4H
Flow rate reconstitute with GR4H
Test Start: 2007/08/11 14:00:00 End: 2008/12/31 23:00:00
Precipitation, Oudin PET, Thornthwaite PET, flow rate reconstitute with GR4H
Interpretable Analysis of Rainfall-Runoff Forecasting 253 Input variables are normalized using the MinMaxScaler method from scikit-learn, scaling them between 0 and 1 to improve and stabilize the model’s performance.
Architecture and Implementation of the MLP Model The multilayer perceptron (MLP) is a class of feedforward artificial neural networks composed of fully connected layers, including an input layer, one or more hidden layers, and an output layer (Rumelhart et al., 1986).
The model was developed using R and Python 3 with librairies including Scikit-learn for preprocessing and deep learning, Pandas and Numpy for data management, and Matplotlib for visualization. To create the MLP model, the following hyperparameter values were selected after a series of sensivity tests: three hidden layers (120-90-60 neurons), the ReLU activation function, the Adam optimization function, the MSE cost function, a learning rate of 0,001, a maximum number of iterations of 200. For each forecast horizon h (3h, 6h, 9h, 12h, 18h, and 24h), a separate MLP model, sharing the same architecture and hyperparameters, was trained independently.
The GRP Model Used as a Reference To evaluate the model’s performance, it was compared to a French flood forecasting model called GRP (Génie Rural pour la prévision de crues). Two performance criteria were used for this evaluation. The GRP model is a hydrological flood forecasting model designed for users who require real- time forecasts. It is a model that uses rainfall data available for the watershed to calculate discharge at the outlet. GRP is currently used by a large portion of the French Flood Forecasting Services (SPC) (Tilmant et al., 2023). The training criterion for GRP is the root mean square error over the horizon H (RMSEH).
Criteria Used for the Evaluation and Comparison of Models In this study, two criteria were used for the training (or calibration) and testing of the models, and subsequently for their comparison: the Nash- Sutcliffe criterion (NSE) and the persistence score. The Nash-Sutcliffe coefficient (NSE) is defined by equation (3):
=
n t t o m t
1
− = −
Q Q NSE
( ) 3 where t o Q and t m Q are, respectively, the
Equation available in the original PDF paper.
Q Q
( ) ( ) =
0 1 1
n t o t
∑ observed and simulated (or predicted) discharges at time t, and o Q is the
mean of the observed discharges. The persistence criterion is defined by the following formula (4): = + n obs prev t t t h
1
− =
Q Q PI
( ) 4 where prev t Q is the predicted discharge at −
Equation available in the original PDF paper.
Q Q
( ) ( ) − =
n H obs obs t t h t
∑ time step i and h is the forecast horizon (expressed in number of time steps).
The NSE criterion uses as a reference a naive model (the average flow rate), which is not very relevant under flood conditions, and therefore very easy to beat. This leads to high NSE values, which may prove to be of limited discriminatory power. According to the persistence criterion (Kitanidis and Bras, 1980), the reference model is a naive model where the predicted flow rate is equal to the observed flow at the moment of prediction. A criteria (NSE or persistence) value close to 1 indicates an excellent match between the simulated and observed data, while a value less than 0 indicates that the model performs worse than a simple constant mean.
Explanatory Analysis of the Rainfall-Runoff MLP Model The importance of the variables was assessed using a perturbation method based on alternatively replacing each explanatory variable with its mean. This approach allows us to analyze the model’s sensitivity to different inputs by quantifying the decline in its performance given these perturbations. The analysis is conducted at two levels of granularity importance by variable group and individual importance and for all the forecast horizons (from 3 to 24 hours).
RESULTS
Model Evaluation To evaluate the performance of the forecasting models, we analyze both the statistical scores and the discharge hydrographs, simulated by the MLP and GRP models. Tables 2 and 3 present, respectively, the NSE and persistence scores obtained by the two models, MLP and GRP, for the various forecast horizons.
The MLP model achieves very high NSE scores, particularly for short horizons (3 to 6 hours), where the values exceed 0,95 in both training and testing (up to 0,98). This reflects an excellent ability to reproduce observed flows and strong model stability. For intermediate horizons (9-12 hours), the scores remain high (0,84-0,94 in the test), confirming the model’s good performance. In comparison, the GRP model also performs well, but slightly below that of the MLP, particularly for long horizons (18h-24h), where scores drop in the test phase to around 0,66-0,74, compared to 0,73-0,78 for the MLP.
Table 2: Comparison of performance (NSE) of the MLP and GRP models by forecast horizon.
Table available in the original PDF paper.
MLP GRP Horizons Training Test Training Test 3h 0.9814 0.9768 0.9865 0.9772
Interpretable Analysis of Rainfall-Runoff Forecasting 255 Analysis of the persistence score confirms that the MLP remains generally more effective than the GRP, particularly for long horizons (0.32–0.47 in validation, compared to 0.26–0.33 for the GRP). However, performance declines rapidly as the horizon shortens, with scores close to zero for the 3-hour horizon, indicating that neither model is able to effectively outperform persistence over this short horizon. This leads to a significant qualification of the models’ predictive power for this horizon.
Table 3: Comparison of persistence scores for the MLP and GRP models by forecast horizon.
Table available in the original PDF paper.
MLP GRP Horizons Training Test Training Test 3h 0,2977 0,0288 0,2441 0,0450
Explanatory Analysis of the MLP Rainfall-Runoff Model Tables 4 and 5 present the results of the explanatory analysis of the MLP rainfall-runoff model.
For the table 4, all the variables of each group (P, PET1, PET2, Q) have been replaced with their mean values in the same model run. This analysis of variable group importance indicates that past discharge values (Q) are the most influential predictors across all forecast horizons in both the training and test datasets. Perturbing Q leads to the largest decrease in model performance, with impacts ranging from −0.889 at the 3 h horizon to −0.494 at 24 h in training, and from −0.917 to −0.403 in testing, demonstrating the dominant role of antecedent discharge information, especially for short- term forecasting. Precipitation (P) is the second most important variable group, and its influence increases progressively with the forecast horizon, from approximately −0.017 at 3 h to −0.326 at 24 h in training, and from −0.017 to −0.295 in testing, indicating that rainfall information becomes more relevant for longer lead times as the direct influence of previous discharge decreases. In contrast, PET1 and PET2 contribute only marginally to the predictions, with perturbations generally producing performance variations close to zero. Their influence becomes slightly more noticeable at longer horizons, particularly at 24 h in the training set, where PET2 reaches −0.060. The positive values observed for PET1 and PET2 at the 24 h horizon in the test set suggest that perturbing these variables slightly improves the model performance, indicating that they may introduce noise or redundant information at this forecast horizon. Overall, the results reveal a gradual transition from a strong dependence on antecedent discharge for short lead times toward a greater contribution of precipitation for longer-term forecasts, while evapotranspiration variables remain secondary predictors.
Table 4: Evaluation of variable importance using the ablation method based on replacing all the variables of each group with their mean.
Table available in the original PDF paper.
Training Test Features 3h 6h 9h 12h 18h 24h 3h 6h 9h 12h 18h 24h
For the table 5, each of the variables are replaced with their mean in specific run of the model, and the variations of scores observed for each run are then summed by group of variables. The results show that discharge (Q) remains the most influential variable in the model. Indeed, replacing it with the mean leads to a significant degradation in performance, particularly for short- to medium-term forecast horizons. During the training phase, the impact becomes increasingly pronounced as the forecast horizon decreases, reaching approximately -0.33 at 6 hours. In the testing phase, this influence is even more pronounced, with values reaching as low as -0.40, confirming the central role of discharge in the dynamics of the predictive model. Precipitation (P) is of more moderate importance. Its influence is most noticeable for longer forecast horizons (24 hours and 18 hours), with a gradual decrease in its impact as the horizon shortens. In the very short term (3 hours and 6 hours), its effect becomes nearly zero, or even slightly positive in the test phase, suggesting that its information is less decisive at these time scales or potentially redundant with other variables.The evapotranspiration variables (PET1 and PET2) have an overall weak to moderate contribution.
Certain values close to zero or slightly positive indicate that replacing them with the mean does not significantly alter performance, which may reflect the model’s low sensitivity to these variables or redundant information.
Table 5: Evaluation of variable importance using the ablation method based on replacing each variable with its mean, and then taking the sum of the scores reduction for each variable group.
Table available in the original PDF paper.
Training Test Features 3h 6h 9h 12h 18h 24h 3h 6h 9h 12h 18h 24h P 0 −0,004 −0.023 −0.052 −0.172 −0.1 −0.012 −0.033 −0.035 −0.061 −0.144 −0.192
This study developed and evaluated a rainfall-runoff prediction model based on a Multilayer Perceptron (MLP) neural network, applied to the
Interpretable Analysis of Rainfall-Runoff Forecasting 257 Sisaony River watershed in Madagascar. The main objective was to improve short- and medium-term flood discharge forecasting while incorporating an interpretability approach to better understand the model’s operation. The results show that the MLP model exhibits very good predictive performance across all forecast horizons studied, with particularly high effectiveness for short horizons (3 to 6 hours). In most cases, the MLP outperforms the GRP reference hydrological model, particularly for longer horizons, confirming its ability to capture complex nonlinear relationships between hydrometeorological variables and discharge. However, both models show a limited predictive power according to the persistence criterion for very short horizons, highlighting the difficulty of outperforming a naive forecast even in a highly reactive hydrological context. Beyond predictive performance, this study presents an explanatory analysis of the model using an approach based on variable perturbation (replacement by the mean). This analysis allows for an assessment of the model’s sensitivity to different input variables. The results consistently show that discharge is the most influential variable, confirming the model’s strong dependence on autoregressive dynamics. In conclusion, this study demonstrates that combining a deep learning model with a perturbation-based interpretability method constitutes an effective approach for hydrological forecasting. It not only yields good predictive performance but also provides a better understanding of the mechanisms learned by the model.
PERSPECTIVES To enhance the predictive capability of models and better capture more complex temporal dependencies over time windows exceeding 10 days, the use of sequential models such as LSTM networks or Transformer- based architectures (Ratovondrahona et al., 2023) could be explored. These approaches would allow for a better representation of the temporal dynamics of hydrometeorological variables and improve medium- and long- term forecasting performance. Furthermore, the integration of satellite- derived precipitation data represents a promising avenue for extending the applicability of deep learning models in contexts where in situ data are limited or of lower quality. This approach would be particularly relevant in areas not covered by ground-based rainfall networks, as well as in basins where discharge observations are only available at 12- or 24-hour intervals. In addition, the use of explainable artificial intelligence (XAI) methods, notably SHAP (Shapley Additive exPlanations), represents an important avenue for deepening the interpretation of models. The models developed in this work nevertheless already pave the way for an operational forecasting system based on deep learning-driven rainfall-runoff approaches, thereby contributing to more proactive flood risk management in the Antananarivo region.
ACKNOWLEDGMENT
The authors would like to acknowledge APIPA for providing the datasets needed for this study. They would also like to thank the MADATLAS project for funding this research, as well as Jean Donnée Rasolofoniaina for his valuable assistance in developing the model.
REFERENCES
Ding, Y. et al. (2019) “Spatio-Temporal Attention LSTM Model for Flood Forecasting”, 2019 International Conference on Internet of Things (iThings) and IEEE Green Computing and Communications (GreenCom) and IEEE Cyber, Physical and Social Computing (CPSCom) and IEEE Smart Data (SmartData). 2019 International Conference on Internet of Things (iThings) and IEEE Green Computing and Communications (GreenCom) and IEEE Cyber, Physical and Social Computing (CPSCom) and IEEE Smart Data (SmartData), pp. 458-465. Disponible sur: https://doi.org/10.1109/iThings/GreenCom/ CPSCom/SmartData.2019.00095. Kitanidis, P.K., Bras, R.L., 1980. Real-time forecasting with a conceptual hydrologic
model: 2. Applications and results. Water Resour. Res. 16, 1034–1044. https://doi. org/10.1029/WR016i006p01034 Kiwelekar, A.W. et al. (2020) “Deep Learning Techniques for Geospatial Data Analysis”, in G.A. Tsihrintzis et L.C. Jain (éd.) Machine Learning Paradigms: Advances in Deep Learning-based Technological Applications. Cham: Springer International Publishing (Learning and Analytics in Intelligent Systems), pp. 63-81. Disponible sur: https://doi.org/10.1007/978-3-030-49724-8_3. Kratzert, F. et al. (2018) “Rainfall–runoff modelling using Long Short-Term Memory
(LSTM) networks”, Hydrology and Earth System Sciences, 22(11), pp. 6005-6022. Disponible sur: https://doi.org/10.5194/hess-22-6005-2018. Oudin, L. et al. (2005) “Which potential evapotranspiration input for a lumped rainfall-runoff model? Part 2 Towards a simple and efficient potential evapotranspiration model for rainfall-runoff modelling”, Journal of Hydrology, 303(1-4), pp. 290-306. Disponible sur: https://doi.org/10.1016/j. jhydrol.2004.08.026. Perrin, C., Michel, C., Andréassian, V., 2003. Improvement of a parsimonious model
for streamflow simulation. J. Hydrol. 279, 275–289. https://doi.org/10.1016/ S0022- 1694(03)00225-7 Ratovondrahona, A.J. et al. (2023) “Human like programming using SPADE BDI agents and the GPT-3-based Transformer”, Human Interaction and Emerging Technologies (IHIET-AI 2023): Artificial Intelligence and Future Applications. AHFE (2023) International Conference, AHFE Open Acces. Disponible sur: https://doi.org/10.54941/ahfe1002939. Rumelhart, D.E., Hinton, G.E., Williams, R.J., 1986. Learning representations by
back-propagating errors. Nature 323, 533–536. https://doi.org/10.1038/323533a0 Tilmant, F. et al. (2023) “Calibration and operational application of the GRP flood forecasting model - User manual (v2022.r3046)”, p. 93 p.
LISTED IN THE AHFE DIGITAL BOOKSTORE CATALOGUE
Explore the complete digital volume
Human Interaction and Emerging Technologies (IHIET-FS 2026): Future Systems and Design Applications
Read this individual research paper free through the original publisher, or explore the full digital proceedings book.
ISBN 979-8-950676-11-6
Explore this ISBN in the AHFE Bookstore ↗Listed in the July 2026 bookstore catalogue; search by ISBN to confirm current availability · Digital book purchase optional