Ana Colim, André Cardoso, Filipe Moreira, Manuel Alves, Ricardo Rodrigues, Rosana Alexandre (2026). Towards an Ergonomic Assessment Framework for Innovative Digital Interfaces: A Multimethod Approach with a Smart-Building Use Case. In: Human Interaction and Emerging Technologies (IHIET-FS 2026): Future Systems and Design Applications. AHFE Open Access, vol. 235, pp. 8–18. https://doi.org/10.54941/ahfe1007256
This study proposes a multimethod ergonomic assessment framework for innovative digital interfaces, using a smart-building software ecosystem as a representative use case. Eight participants completed two interactions with each interface (End-User App and Management Software) under controlled conditions. The assessment combined subjective questionnaires, task-performance measures, electrodermal activity, pupil diameter, and face units’ analysis. The results were more favourable for the End-User App, which showed acceptable usability, a more positive user experience, and improvement with repeated use. In contrast, the Management Software presented lower usability, more errors, greater difficulty in complex tasks, and higher cognitive and emotional demands. Overall, the study shows that combining subjective, performance, physiological, and emotional indicators provides a more comprehensive assessment of interaction demands and helps identify usability issues beyond isolated measures. The proposed framework offers a practical basis for the human-centered assessment of innovative digital interfaces.
Digital interfaces are becoming increasingly central to human interaction with contemporary smart environments, varying from smart-building applications to industrial monitoring dashboards and interconnected, and augmented ecosystems. Among these domains, smart-building environments offer a relevant use case in which digital interfaces support interaction with complex systems while aiming to improve both operational efficiency and users’ well-being. However, previous studies consistently demonstrate that purely technological advancement does not guarantee effective outcomes for the end-users. Instead, the effectiveness and acceptance of these systems are critically influenced by how users perceive, understand, and interact with them during real-world interaction (D’Oca et al., 2018; Faizrakhmanov et al., 2025; Rashidi & Mihailidis, 2013).
Towards an Ergonomic Assessment Framework for Innovative Digital Interfaces 9 Ergonomics is especially relevant in smart-building contexts, where interaction with digital interfaces can directly affect both user satisfaction and system performance. However, D’Oca et al. (2018) argue that ergonomics remains insufficiently considered in the design and technical development of building systems. Similarly, Baborska-Narożny & Stevenson (2020) suggest that the inappropriate use, or even non-use, of service controls contributes to performance gaps, and excessively complex controls may limit effective user interaction. In parallel, Bresa et al. (2023) highlight that advanced human-centered control systems require active user engagement; however, users’ willingness to interact with such systems cannot be assumed, as it is influenced by factors such as users’ expectations, perceived control, and trust. Additionally, recent studies reinforce the need for ergonomic and user- centered approaches to design and develop innovative digital interfaces in smart-building contexts. In particular, Vigouroux et al. (2022) and Bresa et al. (2023) defend that the effectiveness of such interfaces depends not only on their usability and communication modes, but also on users’ perceived control and trust in the system.
At the same time, the literature suggests that assessing innovative digital interfaces through a single-method assessment is insufficient. Instead, previous research has combined complementary approaches, including standardized questionnaires, behavioral and performance measures, qualitative feedback, and, in some cases, physiological variables, to achieve a more comprehensive understanding of user interaction. For example, Belloum et al. (2021) combined questionnaires, task performance measures, and qualitative feedback; Cassioli et al. (2022) examined user interaction in a smart building environment using self-report measures and physiological signals. These studies highlight the importance of adopting a comprehensive ergonomic assessment that considers subjective, behavioral, physiological, and emotional variables.
Nevertheless, current research still offers a fragmented view of how innovative digital interfaces should be assessed, as most studies focus on specific technologies, user groups, or isolated interaction variables (Perrig et al., 2024). This limits a more integrated understanding of how users experience and perceive complex digital systems in real contexts of use. To address this gap, the present study proposes a multimethod ergonomic assessment framework for innovative digital interfaces, applying this to a smart-building software as a use case. By combining subjective, task performance, physiological, and emotional indicators, this paper aims to provide a more comprehensive understanding of interaction demands and to support the design and development of digital interfaces better aligned with users’ needs and capabilities.
METHODOLOGY
This section presents the methodological approach adopted for the multimethod ergonomic assessment of a digital interface. During the experimental trials, each participant completed tasks designed to represent realistic interaction scenarios. The assessment comprised the End-User
App and the Management Software of a smart building. Each participant performed two interactions with each interface, and the list of tasks considered is presented below:
End-User App: Log in; Browse the list of smart-building devices; Mark Smart TV as a favorite; Report a malfunction of the Smart TV; Log out.
Management Software: Log in; Create an Asset Group by specifying its name, description, and photograph; Create a device group by defining its name and description, and by associating the appropriate template; Review pending tickets and approve the ticket related to the malfunctioning TV, selecting the appropriate type and priority; Monitor the ticket, assign it to a responsible staff member, adjust its priority, and consult its history; Update user permissions by assigning a role to the selected user.
Multimethod Ergonomic Assessment Framework – Data Collection and Analysis
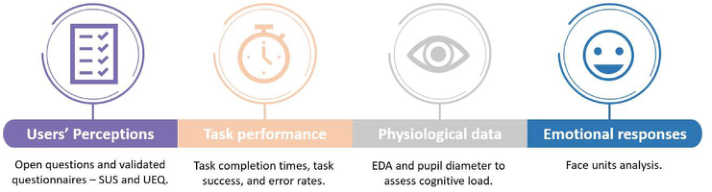
Figure 1 illustrates the multimethod ergonomic assessment framework proposed and applied in the current study. The framework integrates four complementary dimensions of analysis: users’ perceptions, task performance, physiological data, and emotional responses. Users’ perceptions were examined through open-ended questions and validated questionnaires, namely the System Usability Scale – SUS (Brooke, 2013) and the User Experience Questionnaire – UEQ (Schrepp et al., 2014). Task performance was assessed through task completion times, task success, and error rates. Physiological data, including electrodermal activity (EDA) and pupil diameter, were used to analyse cognitive load during interaction. Finally, emotional responses were analysed through the face units’ analysis. By combining these dimensions, the framework enables a more comprehensive ergonomic understanding of user interaction, encompassing not only what users perceive, but also how they perform and react during system use.
Figure 1: Multimethod ergonomic assessment framework for innovative digital interfaces.
Relatively to the SUS, this is a validated instrument for assessing the overall perceived usability of interactive systems. It consists of a standardized questionnaire composed of ten items, answered on a 5-point Likert scale,
Towards an Ergonomic Assessment Framework for Innovative Digital Interfaces 11 which measures users’ perceptions of ease of use, efficiency, and satisfaction during interaction with the system. Using a specific scoring method, an overall score ranging from 0 to 100 is obtained. Final scores between 0 and 50 indicate poor usability, 51 to 68 acceptable usability, 69 to 80 good usability, and 81 to 100 excellent usability. This allows for objective comparison between different systems or evaluated versions (Brooke, 2013).
The UEQ aims to collect users’ subjective perceptions of interactive products and services by addressing both pragmatic aspects of interaction, related to usability and efficiency, and hedonic aspects associated with emotions, stimulation, and perceived innovation. The UEQ consists of 26 pairs of opposite adjectives, assessed using a seven-point semantic differential scale, allowing for an intuitive and easy-to-administer quantitative measurement of user experience. The items are organized into six main dimensions: Attractiveness, Perspicuity, Efficiency, Dependability, Stimulation, and Novelty. The results analysis is conducted by calculating the mean of the responses for each dimension, with values ranging from –3 (extremely negative) to +3 (extremely positive). For interpretation, empirical thresholds are applied, namely: mean values above 0.8 indicate a positive evaluation; values between –0.8 and 0.8 are considered neutral; and values below –0.8 indicate a negative evaluation (Schrepp et al., 2014).
Task-performance measures were collected through direct observation and video recording. The recorded sessions were later analyzed to extract task completion times and task execution rates for each task and interface. These data were classified using a 5-point Likert scale, namely: 1 - denotes success; 2 - completed with difficulty but alone; 3 - completed with the researcher’s help; 4 – failure; and 5 - could not complete even with the researcher’s help.
Physiological data included EDA using a biosignalsplux device (PLUX Wireless Biosignals S.A., Lisbon, Portugal) and OpenSignals software. As a recognized indicator of cognitive workload, EDA was recorded from the non- dominant hand and processed to extract its tonic (Skin Conductance Level – SCL) and phasic (Skin Conductance Level – SCR) components, with baseline normalization applied through z-score transformation (Nechyporenko et al., 2024; Viana-Matesanz & Sánchez-Ávila, 2024). Additionally, eye tracking was used to obtain pupil diameter data, a recognized indicator of cognitive workload (Buchholz & Kopp, 2020). Data were collected with Tobii Pro Glasses 3 (Tobii AB, Stockholm, Sweden) and processed in Tobii Pro Lab, with baseline correction performed using z-score transformation to account for individual differences (Seropian et al., 2022).
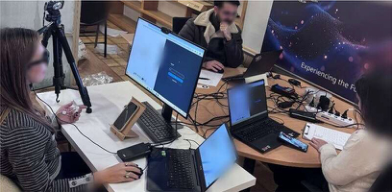
Finally, face units were recorded with a standard webcam and later analyzed using Visage SDK (Visage Technologies, Linköping, Sweden), which estimates emotional responses based on the Facial Action Coding System (FACS) (Visage Technologies, 2024). As indicators of affective and cognitive states, face units’ analysis provided a non-intrusive complement to subjective and physiological measures (D’Mello & Graesser, 2012). All ergonomic variables were analyzed descriptively using mean and standard deviation, and the results were graphically presented in Microsoft Excel V16.0.1. Figure 2 shows the experimental apparatus used in this ergonomic assessment.
Figure 2: Experimental apparatus.
All participants (n = 8) held at least a Master’s degree and worked in the field of digital transformation. Individuals with cognitive, neurological, or psychiatric conditions, severe uncorrected visual impairment, recent ocular surgery, or recent consumption of alcohol, drugs, or caffeine were excluded. Among the participants, 4 were female, and 4 were male, with a mean age of 31.6 (±7.2) years.
RESULTS
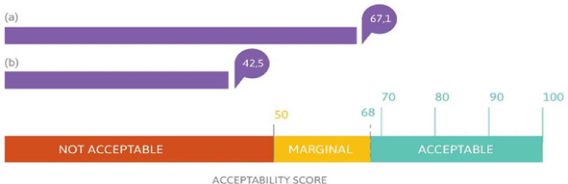
Users’ Perceptions – SUS and UEQ Results The results obtained from the SUS questionnaire for the two evaluated interfaces are presented in Figure 3. The End-User App achieved an average SUS score of 67.1 points, placing it in the marginal usability range, slightly below the commonly accepted threshold for satisfactory performance. This suggests that while the interface is generally usable, there is scope for improvement in user experience and interaction design. The Management Software scored 42.5 points, indicating poor usability and highlighting significant issues that could hinder effective use.
Figure 3: SUS results for (a) End-user app and (b) Management software.
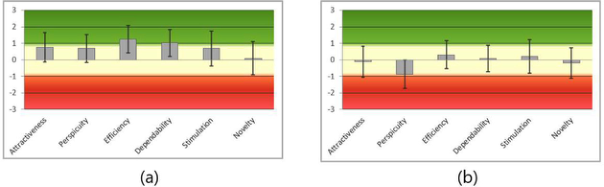
Considering the UEQ results, Figure 4 presents the mean values obtained for each interface, as well as their respective confidence intervals. The results show a more positive user experience for the End-User App than for the Management Software. The End-User App obtained neutral to positive scores across all UEQ dimensions, with higher values in Efficiency and Dependability, indicating a functional and predictable interface. In contrast, the Management Software showed the least favorable results, particularly in Attractiveness and Perspicuity, suggesting lower perceived usability and greater difficulty in understanding the interface, despite generally acceptable task support.
Figure 4: UEQ results for (a) End-user app and (b) Management software.
Task Performance Measures The efficiency of the interfaces was evaluated through the average task completion time. Regarding the End-User App, a consistent reduction in average completion time is observed between the first (196 seconds) and second interaction (149.5 sec.). This result indicates a significant learning effect. In the case of the Management Software interface, the recorded average times are substantially higher, which can be explained by the greater number of tasks and by the complexity of the interface, associated with a larger number of features, options, or steps required to complete the tasks. The overall average time decreased from approximately 679.9 seconds in the first interaction to around 355.6 seconds in the second interaction, representing a reduction of about 45%.
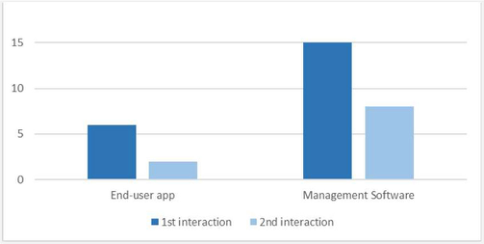
For the number of errors recorded, any situation in which a participant was unable to complete a task independently was considered an error. Overall (see Figure 5), a consistent reduction in the number of errors from the first to the second interaction can be observed, suggesting a positive effect of learning and increased familiarity with the systems.
Figure 5: Number of errors registered during the interactions with the end-user app and the management software.
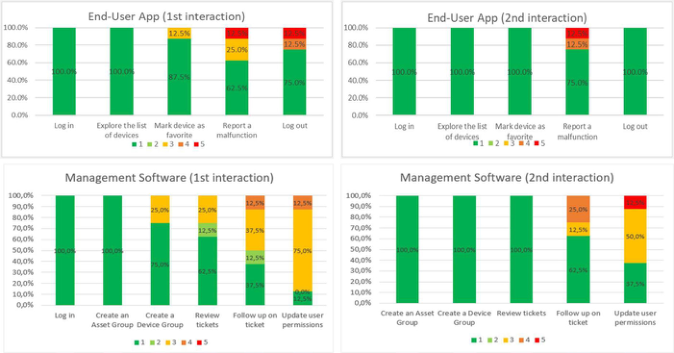
To evaluate the effectiveness of the interfaces, task success was analyzed using a 5-level scale (previously described in the methodology), from complete success to inability to complete the task. For the End-User App (Figure 6), basic tasks were successfully completed by all participants during the first interaction, whereas fault reporting showed lower direct success and required assistance more often, indicating greater difficulty. In the second interaction, performance improved, with most tasks being completed successfully by all participants, although fault reporting still caused some difficulties. In contrast, the Management Software remained the most challenging interface,
particularly for more complex tasks such as ticket follow-up and permission updates. The Management Software continued to present substantial difficulties even after repeated use, suggesting persistent usability problems related to interface structure or information organization.
Figure 6: Comparative analysis of task execution rates for the interfaces tested. (a) First intersection; (b) Second interaction.
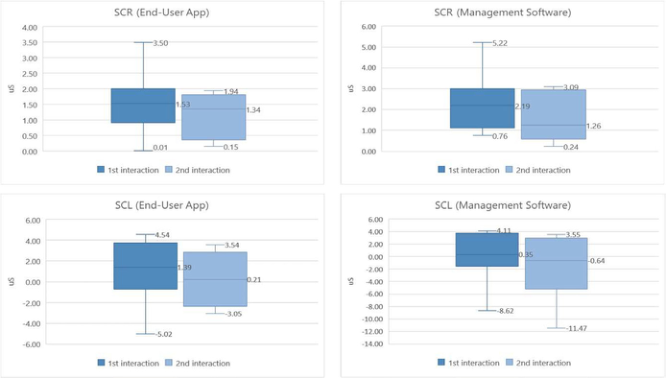
Physiological Data – EDA and Pupil Diameter The EDA results (Figure 7) suggest distinct response patterns for the End- User App and the Management Software across interactions. In the first interaction, the Management Software caused higher SCR values, indicating stronger immediate arousal, whereas the End-User App showed higher SCL values, suggesting greater sustained cognitive workload. In the second interaction, SCR decreased in both interfaces, reflecting increased familiarity with the interaction process.
Figure 7: Comparative analysis of the mean SCR and SCL results over the interactions.
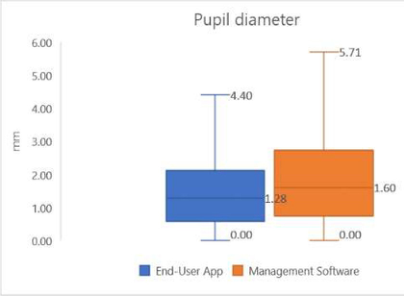
Towards an Ergonomic Assessment Framework for Innovative Digital Interfaces 15 Pupil diameter was analysed during the first interaction as an indicator of cognitive workload. The results (Figure 8) show that the Management Software elicited the largest mean pupil diameter, compared with the End- User App. This suggests that the Management Software imposed the highest cognitive processing demands during first-time use, likely due to greater interface complexity and information load.
Figure 8: Comparative analysis of the mean pupil diameter.
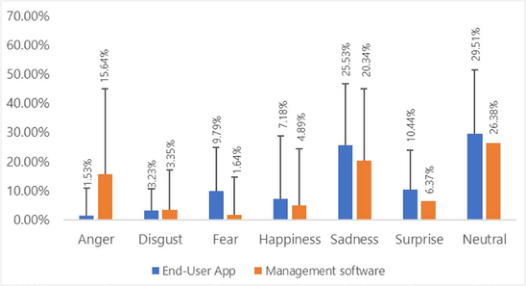
Emotional Responses – Face Units’ Analysis Emotional responses during the second interaction revealed different affective patterns for the End-User App and the Management Software (Figure 9). The End-User App was associated with higher levels of sadness and fear, suggesting residual uncertainty during interaction. In contrast, the Management Software showed the highest proportion of anger, together with substantial sadness, indicating greater frustration and persistent interaction difficulties. This pattern is consistent with the cognitive workload results, reinforcing the view that the Management Software remained the more demanding interface even after repeated exposure.
Figure 9: Distribution of detected facial expressions (anger, disgust, fear, happiness, sadness, surprise, and neutral) expressed as mean percentages with corresponding variability (error bars).
DISCUSSION AND CONCLUDING REMARKS The main goal of this study was to propose and apply a multimethod ergonomic assessment framework for innovative digital interfaces, using a smart-building software ecosystem as a representative use case. Overall, the findings show that the proposed framework was sensitive enough to distinguish between the two interfaces and to reveal different types of interaction demands that would be difficult to capture through a single assessment method. While the End-User App achieved more favorable results and showed clear improvement between interactions, the Management Software consistently presented lower usability and user experience scores, more task failures, higher cognitive workload, and more negative emotional responses. These converging findings suggest that the main difficulties were not limited to first-contact unfamiliarity, but were also related to deeper issues in interface structure, information organization, and interaction flow.
These results are consistent with previous work emphasizing that the effectiveness of smart-building interfaces depends not only on technical functionality, but also on how clearly users can understand and control the system. In particular, the persistent difficulties observed in the Management Software support the view of Baborska-Narożny and Stevenson (2020), who argue that excessively complex control interfaces can compromise effective interaction and contribute to performance gaps. Likewise, the present findings align with Bresa et al. (2023), who highlight the importance of perceived control and trust in shaping users’ willingness to interact with advanced building systems. The lower attractiveness and perspicuity scores, together with the emotional profile marked by anger and sadness, suggest that these factors may also have been negatively affected in the more complex interface. At the same time, the improvement observed in the End-User App after repeated exposure is in line with Vigouroux et al. (2022), who showed that learnability alone does not ensure a fully effective interaction, and that clarity and ease of use remain critical design requirements.
Overall, this study demonstrates the value of a multimethod ergonomic assessment framework that integrates subjective, task-performance, physiological, and emotional indicators. The findings show that combining complementary data provides a more complete understanding of interaction demands and helps identify usability issues that isolated measures may not detect. Beyond the smart-building use case, the proposed framework offers a methodological basis for the human-centered evaluation of innovative digital interfaces across different technological domains.
ACKNOWLEDGMENT
This article is a result of the Innovation Pact “R2UTechnologies | modular systems” (C644876810-00000019), by “R2UTechnologies” Consortium, co-financed by NextGeneration EU, through the Incentive System “Agendas para a Inovação Empresarial” (“Agendas for Business Innovation”), within the Recovery and Resilience Plan (PRR).
REFERENCES
Baborska-Narożny, M., & Stevenson, F. (2020). Service controls interfaces in housing: Usability and engagement tool development. Building Research and Information, 47(3), 290–304. https://doi.org/10.1080/09613218.2018.1501535 Belloum, R., Yaddaden, A., Lussier, M., Bier, N., & Consel, C. (2021). Caregiver
development of activity-supporting services for smart homes. Journal of Ambient Intelligence and Smart Environments, 13(6), 453–471. https://doi.org/10.3233/ AIS-210616 BiosignalsPlux. (2022). Opensignals (r)evolution User manual. http://www.plux.info Bresa, A., Zakula, T., & Ajdukovic, D. (2023). A framework to predict the willingness and influencing factors of building occupants to interact with advanced control systems in buildings. Energy Reports, 10, 4078–4086. https://doi.org/10.1016/j. egyr.2023.10.071 Brooke, J. (2013). SUS: A Retrospective. Journal of Usability Studies, 8(2), 29–40. Buchholz, V., & Kopp, S. (2020, September 7). Towards an Adaptive Assistance
System for Monitoring Tasks: Assessing Mental Workload using Eye-Tracking and Performance Measures. Proceedings of the 2020 IEEE International Conference on Human-Machine Systems (ICHMS). Cassioli, F., Angioletti, L., & Balconi, M. (2022). Tracking eye-gaze in smart home systems (SHS): first insights from eye-tracking and self-report measures. Journal of Ambient Intelligence and Humanized Computing, 13(5), 2753–2762. https:// doi.org/10.1007/s12652-021-03134-8 D’Mello, S., & Graesser, A. (2012). Dynamics of affective states during complex
learning. Learning and Instruction, 22(2), 145–157. https://doi.org/10.1016/j. learninstruc.2011.10.001 D’Oca, S., Hong, T., & Langevin, J. (2018). The human dimensions of energy use in buildings: A review. In Renewable and Sustainable Energy Reviews (Vol. 81, pp. 731–742). Elsevier Ltd. https://doi.org/10.1016/j.rser.2017.08.019 Faizrakhmanov, R., Bahrami, M. R., & Platunov, A. (2025). Prototype, method,
and experiment for evaluating usability of smart home user interfaces. Computer Standards and Interfaces, 92. https://doi.org/10.1016/j.csi.2024.103903 Nechyporenko, A., Frohme, M., Strelchuk, Y., Omelchenko, V., Gargin, V., Ishchenko, L., & Alekseeva, V. (2024). Galvanic Skin Response and Photoplethysmography for Stress Recognition Using Machine Learning and Wearable Sensors. Applied Sciences, 14(24), 11997. https://doi.org/10.3390/app142411997 Perrig, S. A. C., Aeschbach, L. F., Scharowski, N., von Felten, N., Opwis, K., &
Brühlmann, F. (2024). Measurement practices in user experience (UX) research: a systematic quantitative literature review. In Frontiers in Computer Science (Vol. 6). Frontiers Media SA. https://doi.org/10.3389/fcomp.2024.1368860 Rashidi, P., & Mihailidis, A. (2013). A survey on ambient-assisted living tools for older adults. IEEE Journal of Biomedical and Health Informatics, 17(3), 579–590. https://doi.org/10.1109/JBHI.2012.2234129 Schrepp, M., Hinderks, A., & Thomaschewski, J. (2014). Applying the User
Experience Questionnaire (UEQ) in Different Evaluation Scenarios (pp. 383– 392). https://doi.org/10.1007/978-3-319-07668-3_37 Seropian, L., Ferschneider, M., Cholvy, F., Micheyl, C., Bidet-Caulet, A., & Moulin, A. (2022). Comparing methods of analysis in pupillometry: application to the assessment of listening effort in hearing-impaired patients. Heliyon, 8(6). https:// doi.org/10.1016/j.heliyon.2022.e09631 Tobii AB. (2022). Tobii Pro Glasses 3 User Manual v1.9.
Viana-Matesanz, M., & Sánchez-Ávila, C. (2024). Adaptive Normalization and Feature Extraction for Electrodermal Activity Analysis. Mathematics, 12(2), 202. https://doi.org/10.3390/math12020202 Vigouroux, N., Vella, F., Lepage, G., & Campo, E. (2022). Usability study of tactile
and voice interaction modes by people with disabilities for home automation controls. Joint International Conference on Digital Inclusion, Assistive Technology & Accessibility (ICCHP-AAATE 2022), 139–147. http://mi.iut-blagnac.fr Visage Technologies. (2024). Face Analysis. Emotion estimation. Https:// Visagetechnologies.Com/Face-Analysis/.
LISTED IN THE AHFE DIGITAL BOOKSTORE CATALOGUE
Explore the complete digital volume
Human Interaction and Emerging Technologies (IHIET-FS 2026): Future Systems and Design Applications
Read this individual research paper free through the original publisher, or explore the full digital proceedings book.
ISBN 979-8-950676-11-6
Explore this ISBN in the AHFE Bookstore ↗Listed in the July 2026 bookstore catalogue; search by ISBN to confirm current availability · Digital book purchase optional