Rosana Alexandre, Filipe Moreira, Andre Cardoso, Manuel Alves, Ricardo Rodrigues, Ana Colim (2026). Improving Usability in a Smart Building Ecosystem through Heuristic Evaluation and Usability Testing. In: Human Interaction and Emerging Technologies (IHIET 2026). AHFE Open Access, vol. 236, pp. 39–49. https://doi.org/10.54941/ahfe1008080
The design of smart-building digital ecosystems presents challenges when multiple interfaces must serve users with distinct roles, expertise levels, and operational contexts. Rather than focusing solely on the identification of performance deficiencies, this study adopts an interpretive approach aimed at generating real-use-based insights for the design of multi-interface systems. Three interfaces of a smart-building software ecosystem were evaluated: the End-User App, the Management Software, and the Worker App. A heuristic evaluation based on Nielsen’s ten usability heuristics and ISO 9241-110 principles was combined with a usability study involving eight participants who performed representative tasks under a think-aloud protocol. Sessions were recorded and analyzed through thematic analysis. The integration of these two methods reveals a coherent and mutually reinforcing picture: heuristic violations identified prior to testing, including insufficient system feedback, inconsistent iconography, and poor information architecture, were consistently confirmed by user behavior and verbalizations. The Worker App demonstrated strong task-oriented usability, while the End-User App was generally accessible but exhibited specific interaction gaps. The Management Software presented the steepest learning curve among the three interfaces. Cross-cutting themes point to ecosystem-level design opportunities. The study contributes evidence-based recommendations framed as a practical resource for iterative interface improvement, and illustrates how combined heuristic and usability evaluation constitutes a methodologically robust approach to the human-centered assessment of complex multi-interface systems.
Human-Computer Interaction (HCI) research has long recognized that the quality of interaction between users and digital interfaces is a critical determinant of system usability, efficiency, and adoption. According to the International Organization for Standardization (ISO), usability is defined in terms of effectiveness, efficiency, and satisfaction within a specific context of use (ISO, 2018). As interactive technologies grow in complexity, the evaluation of user interfaces has evolved beyond narrow measures of task Received June 12, 2026; Revised July 8, 2026; Accepted July 23, 2026; Available online August 25, 2026
performance and error rates, expanding towards a broader understanding of user experience (UX), encompassing subjective, affective, and contextual dimensions of interaction (Hassenzahl & Tractinsky, 2006; Desmet & Hekkert, 2007). This shift reflects a growing consensus that well-designed interfaces are not merely functional artefacts, but mediators of meaningful human activity (Bødker, 2006).
The evaluation of digital interfaces in smart-building environments has attracted increasing research attention driven by the growing complexity of building management systems and the diversity of users. Previous studies have emphasized the importance of adopting multi-method evaluation frameworks that combine subjective, behavioral, and physiological measures to capture different dimensions of user interaction (Cassioli et al, 2022; Belloum et al, 2021; Colim et al., 2026).
In response to this complexity, usability evaluation methods have developed to address both functional and experiential dimensions of interaction. Heuristic evaluation, grounded in the usability heuristics proposed by Nielsen (1994a) and aligned with ISO 9241-110 (ISO, 2020), remains one of the most widely adopted analytical inspection methods, valued for its efficiency in identifying structural interaction problems related to consistency, feedback, error prevention, and user control. However, inspection methods alone are often insufficient to fully capture the experiential dimensions of user interaction. Research comparing evaluation approaches shows that while heuristic evaluation is effective at identifying a large number of usability issues, usability testing tends to reveal more severe and context- dependent problems (Maguire & Isherwood, 2018; Zardari et al, 2021). Therefore, combining inspection methods with user testing can provide a more comprehensive usability assessment (Tan, Liu, & Bishu, 2009; Preece, Rogers & Sharp, 2013).
These methodological challenges become particularly critical in complex, multi-interface digital ecosystems. Smart-building environments, integrating Internet of Things (IoT) devices, automation systems, data analytics platforms, and user-facing applications, exemplify this complexity. Their interfaces must simultaneously support users with fundamentally different roles, including occupants, maintenance workers, facility managers, and administrators, each with distinct goals and levels of expertise, yet sharing the same underlying infrastructure (Liao et al., 2023). This structural interdependence means that usability cannot be evaluated in isolation. In multi-interface ecosystems, interaction inconsistencies between platforms may disrupt users’ ability to transfer knowledge and maintain coherent mental models across contexts of use. Such challenges extend beyond interface-level usability and involve ecosystem-level interaction continuity, consistency, and cognitive alignment across devices and user roles (Norman, 2013; Ntoa, 2025).
In response to these challenges, this study investigates the usability and UX of a smart-building ecosystem composed of three interconnected interfaces: an End-User App, a Worker App, and a Management Software platform. Rather than focusing solely on deficiency identification, the
Improving Usability in a Smart Building Ecosystem 41 research adopts an interpretive perspective, recognizing usability findings as constructed interpretations that can be translated into actionable design knowledge (as defended by Hornbæk & Frøkjær, 2006; Ntoa, 2025). The interfaces under evaluation were developed through a human- centered design process encompassing user story mapping, service design blueprinting, and iterative prototyping (Moreira et al., 2024). The study combines heuristic evaluation with a usability study aiming to contribute design-oriented insights for more coherent, accessible, and human- centered smart-building systems.
METHODOLOGY
The study adopted a two-phase evaluation design. In the first phase, a heuristic evaluation was conducted to identify structural usability problems across all three interfaces prior to user testing. In the second phase, a usability study was carried out. The combination of these two phases reflects a principled methodological approach to the evaluation of complex interactive systems, in which expert inspection and empirical testing serve complementary and mutually reinforcing functions (Nielsen, 1994a; Barnum, 2011; Zardari et al., 2021). The heuristic evaluation was conducted by three expert evaluators following Nielsen’s ten usability heuristics (h1 to h10) (Nielsen, 1994b, 2024) and the ISO 9241-110 principles of human–system interaction (ISO, 2020). Each interface, (i) the End-User App, (ii) the Management Software, and (iii) the Worker App, was independently analyzed to identify usability issues across ten dimensions: (h1) system visibility; (h2) correspondence between the system and the real world; (h3) user control and freedom; (h4) consistency and standards; (h5) error prevention, (h6) recognition instead of memorization; (h7) flexibility and efficiency of use; (h8) minimalist aesthetics and design; (h9) help users recognize and recover from errors; and (h10) help and documentation. Issues were documented and assigned severity ratings on a five-point scale (1 = Cosmetic to 5 = Critical). Each evaluator independently inspected all three interfaces and documented usability issues with severity ratings (Nielsen, 1994a). Findings were subsequently consolidated through a structured review process in which duplicate issues were merged, and severity ratings were discussed until consensus was reached among evaluators.
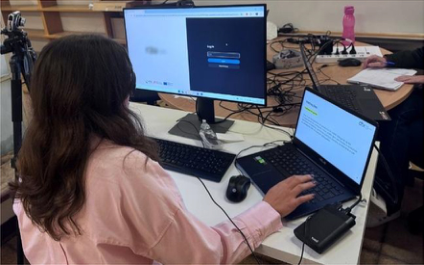
Eight professionals of the technology field (n = 8) participated in the usability study, selected through convenience sampling (Figure 1). As reported in the literature, 5 participants can lead to the identification of approximately 80% of the usability problems (Turner et al., 2006). Prior to participation, informed consent was obtained from all participants. All were fluent in Portuguese and English and reported normal or corrected-to-normal vision. The sample comprised four female and four male participants, with ages ranging from 24 to 44 years (mean: 31.6 ± 7.2 years). Six participants held a master’s degree and two held a doctoral degree.
Figure 1: Participant performing tasks during a usability study session.
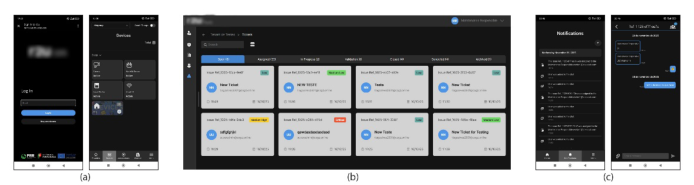
The three evaluated interfaces (Figure 2) represented distinct user roles within the smart-building ecosystem: (i) the End-User App, a mobile app for building occupants; (ii) the Management Software, a desktop/web platform for administrators; and (iii) the Worker App, a mobile app for maintenance workers. The design and development of these interfaces is described in Moreira et al. (2024).
Each participant performed a set of representative tasks in each interface, designed to simulate real-world use scenarios. All tasks were performed twice to assess short-term learnability effects, adaptation to the interaction logic, and changes in user performance across repeated use (Nielsen, 1994a; Barnum, 2011). The task lists were as follows:
End-User App: Log in; Browse smart-building devices; Mark Smart TV as a favorite; Report a Smart TV malfunction; Log out.
Management Software: Log in; Create an Asset Group; Create a Device Group; Review and approve a pending ticket; Monitor and follow up on the ticket; Update user permissions.
Worker App: Log in; View ticket notification; Use chat to communicate; Log out.
Improving Usability in a Smart Building Ecosystem 43 Data Collection and Analysis
Qualitative data were collected through four complementary methods: (i) the think-aloud protocol, in which participants continuously verbalized their reasoning, decisions, and reactions throughout task execution; (ii) direct observation by researchers, capturing non-verbal behaviors, hesitations, and interaction errors; (iii) audiovisual recordings of all sessions; and (iv) open-ended questionnaire responses collected after interaction with each interface. The think-aloud protocol is widely adopted to capture users’ reasoning processes during task execution and to reveal usability problems (Doi, 2021).
In addition, the System Usability Scale (SUS) questionnaire was administered after each session to provide a standardized measure of perceived usability. The SUS produces a score from 0 to 100 points, with established benchmarks of poor (below 50), acceptable (51–68), good (69–80), and excellent (81– 100), enabling standardized comparisons across systems and evaluation cycles (Bangor et al., 2009; Brooke, 2013).
The number of interaction errors observed during task execution was also recorded and compared between the first and second interactions to assess usability difficulties and short-term learnability effects across interfaces. The purpose of error analysis, any situation in which a participant was unable to complete a task independently was considered an error. In this analysis, a maximum of one error per task and per participant was counted, even if multiple errors occurred during task execution (Rubin & Chisnell, 2008; Sauro, 2010). Sessions were conducted individually in a controlled environment following a pilot test. Each session lasted approximately 50 minutes.
All recordings were transcribed and subjected to thematic analysis following the procedures described by Bernard et al. (2017) and Saunders et al. (2019). The analysis was conducted in Microsoft Excel and involved open coding of usability-related verbalizations and observed behaviors, followed by the grouping of codes into categories and the identification of recurring themes across participants and interfaces. Two researchers independently performed the coding process, and the resulting codes were subsequently reviewed and refined through an iterative collaborative interpretation. The analysis focused on behavioral patterns, sources of difficulty, and users’ perceptions and suggestions.
RESULTS
Heuristic Evaluation Findings A total of 46 usability issues were identified across the three interfaces. These issues were distributed across the heuristic dimensions, with five of them accounting for the majority of the problems observed. Table 1 summarizes the distribution of issues by interface and severity level.
Table 1: Distribution of heuristic issues by interface and severity level.
Table available in the original PDF paper.
Interface Cosmetic (1) Minor (2) Moderate (3) Major (4) Critical (5) Total End-User App 1 4 6 3 1 15
Total 1 9 21 13 2 46 System visibility and feedback deficiencies were the most pervasive across the three interfaces, including absent loading indicators, lack of online/offline chat status, missing timestamps in ticket histories, and missing confirmation messages after completed actions (severity 2 and 3). Consistency and standards violations included inconsistent iconography across interfaces (severity 3), and redundant buttons with identical functions but different labels in the End-User App (severity 4). Additional issues related to navigation and information architecture included ambiguous menu icons, the absence of a general search function, and non-obvious access paths to permission management functionalities (severity 3 and 4).
The Management Software concentrated the largest number of severe usability issues, particularly regarding onboarding, contextual help, error prevention, and workflow navigation. Critical problems included destructive actions without confirmation dialogs, loss of form data during navigation, and limited transparency in permission management workflows. In the End-User App, the issue reporting flow and ambiguous error messages represented the most significant interaction barriers. The Worker App presented comparatively fewer and less severe issues, primarily associated with iconographic inconsistency and logout confirmation behavior. Based on these findings, expected task difficulty levels ranging from Very Easy to Very Hard were established to support interpretation of the usability study results.
Usability Findings The End-User App was generally well-received. Its speed, visual simplicity, and modern aesthetic were consistently cited as strengths, consistent with its SUS score of 67.1 points (marginal usability range). Difficulties were concentrated in specific tasks: the home screen was perceived as unwelcoming after login (“After logging in, I felt the home screen was very empty, and I missed having a ‘welcome’ or something like that”, P.5); the star icon for favourites was considered ambiguous without explanatory text (“There should be a caption”, P.6); and the issue reporting task generated confusion in half of the participants (“I didn’t remember where to click to report an issue… it’s very confusing”, P.4). Additional participants reported similar difficulties navigating to the reporting function (P.6, P.7, P.8). Icon inconsistencies with the Management Software were noted (P.6), and the back button appeared in inconsistent locations across screens. A reduction in observed errors between
Improving Usability in a Smart Building Ecosystem 45 the first and second interactions (from six to two) further suggests rapid adaptation and improved interaction fluency across repeated use.
The Management Software presented the most critical and persistent usability challenges, corresponding to its SUS score of 42.5 points (poor usability). Difficulties were not limited to first impressions but reflected deeper issues of information architecture and mental model alignment. Most participants failed to locate user permission management autonomously (“Once again, it was the researcher who told me it was like this; it wasn’t obvious”, P.5), and only one participant succeeded independently. Several participants initially navigated to the Users section with confidence, only to find it did not provide access to permission management, generating repeated disorientation (P.1, P.2, P.3, P.4, P.5, P.7). Even after accessing the permission area, unexpected interaction behaviours persisted: selecting a role caused the previously selected user to be deselected (“I click here and it removes me from here – it’s annoying”, P.2). Furthermore, the interface provided no clear overview of which permissions had actually been assigned: “I go to permissions”, and “I can’t see who actually has permissions here” (P.4). Ticket review also generated difficulties, as participants expected row-click to open ticket details, a convention present elsewhere in the software, but this action had no effect. A related obstacle was the list view icon, which participants failed to recognise as interactive: “It’s a bit hidden. At first, I didn’t even realize that part existed” (P.7). Participants acknowledged the system’s speed and visual design as positives, and noted that navigation would improve with practice (“a bit confusing at first, but then I believe it would be easy”, P.3), though others considered the options “too dispersed, and training is required to use the software” (P.4), with one participant stating that “you need help from a technician to use it properly” (P.7). Although the Management Software presented the highest number of usability issues, the number of observed errors decreased from fifteen in the first interaction to eight in the second, indicating a relevant learning effect despite the interface complexity.
The Worker App demonstrated the best overall usability, consistent with its SUS score of 80.9 points (meaning a good usability). Tasks were completed efficiently and with minimal confusion, and the interface was perceived as purposeful and well-aligned with its operational context. The primary difficulty was locating the chat functionality due to its small icon and non-obvious placement (P.4, P.5, P.6, P.8). The logout confirmation step was unexpected for several participants, corroborating the heuristic finding (severity 3). At the visual level, the layout was described as overly grey and the inclusion of a worker photograph was suggested to improve the interface’s appeal (P.6). Five errors were recorded in the first interaction and none in the second, the shallowest learning curve of the three interfaces.
Convergence of Heuristic and Usability Study Findings A comparison was conducted between heuristically identified problems and empirically observed user behaviour. Table 2 summarizes the main points of convergence between the two analyses.
Table 2: Convergence between heuristic findings and observations from a usability study.
Table available in the original PDF paper.
Heuristic Issue (Severity) Interface Empirical Confirmation No onboarding / contextual help (4)
Management Software
Most participants required researcher assistance; only 1 located permission autonomously No search / navigation shortcuts (3–4)
Management Software
Extensive trial-and-error; expressed need for training (P.7) Selection lost when switching roles (3)
Management Software
Directly verbalized frustration (P.2); disrupted permission task flow Ticket row click does not open details (3)
Management Software
Multiple participants attempted click without effect (P.4, P.5, P.6, P.8) Issue reporting flow unclear (4) End-User App Confusion in 4 of 8 participants; described as ‘very confusing’ (P.4) Star icon ambiguous; no caption (3) End-User App Difficulty with favourites feature (P.5, P.6, P.8); ‘There should be a caption’ Logout confirmation inconsistent (3)
End-User App / Worker App
Participants unaware confirmation was required; unexpected task state Chat icon placement non-obvious (3–4) Worker App Chat hard to locate (P.4, P.5, P.6, P.8) All Cross-interface confusion; devices symbol misidentified (P.6) Inconsistent iconography across interfaces (3)
All heuristic issues rated severity 3 or above were confirmed through user behavior and participant verbalizations, supporting the predictive value of expert inspection in this context. The qualitative data added explanatory depth beyond issue identification alone, revealing how interaction inconsistencies disrupted users’ emerging mental models and generated frustration during complex workflows, particularly in permission management tasks. Conversely, the findings also showed that the positive reception of the Worker App extended beyond task completion efficiency, reflecting a strong alignment between operational workflows, user expectations, and interface behavior, dimensions that may not be fully captured through heuristic inspection alone.
DISCUSSION
The findings reveal a varied usability picture across the three interfaces. The Worker App achieved the highest SUS score (80.9) and the fewest errors, while the End-User App presented generally positive usability (67.1), with difficulties concentrated in issue reporting and favorites management. The Management Software obtained the lowest SUS score (42.5) and exhibited persistent navigation and permission-management difficulties. These results are consistent with research suggesting that usability challenges increase with system complexity and specialized user roles (Liao et al., 2023; Norman, 2013). The observed reduction in errors across repeated interactions further suggests that all three interfaces benefited from learnability effects, one of the core dimensions of usability identified by Nielsen (1994a).
Improving Usability in a Smart Building Ecosystem 47 The convergence between heuristic and usability findings is methodologically relevant. All issues rated severity 3 or above during expert inspection were confirmed through user behavior and verbalizations, supporting the predictive value of heuristic evaluation (Maguire & Isherwood, 2018). The usability study complemented these findings by revealing how navigation difficulties, limited feedback, and interaction inconsistencies affected users’ mental models and generated frustration. Together, the results support the use of combined inspection and user-based methods for a more comprehensive usability assessment (Tan et al., 2009; Preece et al., 2013). The resulting recommendations address recurring issues related to feedback, consistency, user control, and navigation, which are recognized as fundamental principles of effective human-system interaction and cross-platform usability (Nielsen, 1994b; ISO, 2020; Norman, 2013). Building on these converging findings, several design improvements can be identified across the ecosystem. Strengthening system feedback through the consistent use of loading indicators, confirmation messages, communication status indicators, and timestamps could increase the visibility of system status across the ecosystem. The Management Software would also benefit from role- tailored onboarding mechanisms, including guided tours, contextual tooltips, and inline assistance, to reduce the learning burden associated with complex administrative tasks. The adoption of a unified design system could improve consistency in iconography, terminology, and navigation patterns, facilitating knowledge transfer between interfaces and reducing cognitive effort. Greater emphasis on user control and error prevention, through features such as confirmation dialogs for critical actions, preservation of form data during navigation, and standardized logout procedures, may further improve the user experience. Additionally, navigation within the Management Software could be simplified by providing multiple access paths to key functions, introducing a global search capability, and reducing workflow complexity.
CONCLUSIONS
This study demonstrates that combining heuristic evaluation with usability testing provides a methodologically sound basis for assessing complex multi- interface systems. The convergence of both methods across all severity levels supports the use of expert inspection as a reliable first-phase tool, while usability findings capture experiential dimensions that inspection alone cannot access.
As with any exploratory study, certain limitations should be acknowledged. The sample consisted of participants from the technology field, and the sessions were conducted in a controlled environment, which, while ensuring consistency, may not capture all the interaction dynamics present in operational conditions. These characteristics are appropriate for this phase of evaluation of the study and define the boundaries from which future work can expand.
Future work will build directly on the findings of this study. The interfaces will be redesigned in line with the evidence-based recommendations produced, and new usability evaluations will be conducted. These future evaluations will incorporate the integration of the interfaces with the sensor infrastructure and will involve broader and more diverse participant
samples that better reflect the real user population of the ecosystem. The present study demonstrates that the combination of heuristic inspection and usability user testing, applied within an interpretive and constructive frame, provides a practically productive and methodologically principled basis for this iterative, human-centered improvement process.
ACKNOWLEDGMENT
This article is a result of the Innovation Pact “R2UTechnologies | modular systems” (C644876810-00000019), by “R2UTechnologies” Consortium, co-financed by NextGeneration EU, through the Incentive System “Agendas para a Inovação Empresarial” (“Agendas for Business Innovation”), within the Recovery and Resilience Plan (PRR).
REFERENCES
Bangor, A., Kortum, P., & Miller, J. (2009). Determining what individual SUS scores mean: Adding an adjective rating scale. Journal of Usability Studies, 4(3), 114–123. Barnum, C. M. (2011). Usability testing essentials: Ready, set... test! (2nd ed.).
Morgan Kaufmann. Belloum, R., Yaddaden, A., Lussier, M., Bier, N., & Consel, C. (2021). Caregiver development of activity-supporting services for smart homes. Journal of Ambient Intelligence and Smart Environments, 13(6), 453–471. Bernard, H. R., Wutich, A., & Ryan, G. W. (2017). Analyzing qualitative data:
Systematic approaches (2nd ed.). SAGE. Brooke, J. (2013). SUS: A retrospective. Journal of Usability Studies, 8(2), 29–40. Bødker, S. (2006). When second wave HCI meets third wave challenges. In Proceedings of the 4th Nordic Conference on Human-Computer Interaction (pp. 1–8). Cassioli, F., Angioletti, L., & Balconi, M. (2022). Tracking eye-gaze in smart home
systems (SHS): First insights from eye-tracking and self-report measures. Journal of Ambient Intelligence and Humanized Computing, 13(5), 2753–2762. Colim, A., Cardoso, A., Moreira, F., Alves, M., Rodrigues, R., & Alexandre, R. (2026).
Towards an ergonomic assessment framework for innovative digital interfaces: A multimethod approach with a smart-building use case. In T. Ahram & T. Barath (Eds.), Human interaction and emerging technologies (IHIET-FS 2026): Future systems and design applications. AHFE Open Access Series. AHFE International. Desmet, P. M. A., & Hekkert, P. (2007). Framework of product experience.
International Journal of Design, 1(1), 57–66. Doi, T. (2021). Usability textual data analysis: A formulaic coding think-aloud protocol method for usability evaluation. Applied Sciences, 11(15), Article 7047. Hassenzahl, M., & Tractinsky, N. (2006). User experience—A research agenda.
Behaviour & Information Technology, 25(2), 91–97. Hornbæk, K., & Frøkjær, E. (2006). What kinds of usability-problem description are useful to developers? Proceedings of the Human Factors and Ergonomics Society Annual Meeting, 50(24), 2523–2527. International Organization for Standardization. (2018). Ergonomics of human-
system interaction—Part 11: Usability: Definitions and concepts (ISO 9241- 11:2018). International Organization for Standardization. (2020). Ergonomics of humansystem interaction—Part 110: Interaction principles (ISO 9241-110:2020).
Improving Usability in a Smart Building Ecosystem 49 Liao, L., Liang, Y., Li, H., Ye, Y., & Wu, G. (2023). A systematic review of global
research on natural user interface for smart home system. International Journal of Industrial Ergonomics, 95, 103445. Maguire, M., & Isherwood, P. (2018). A comparison of user testing and heuristic evaluation methods for identifying website usability problems. In A. Marcus & W. Wang (Eds.), Design, user experience, and usability: Theory and practice (Lecture Notes in Computer Science, Vol. 10918). Springer. Moreira, F., Alexandre, R., Silva, R., Oliveira, J., Alves, M., Pereira, J., et al. (2024).
Towards an interface design for a building operations CPS. In 2024 19th Conference on Computer Science and Intelligence Systems (FedCSIS) (pp. 655–660). IEEE. Nielsen, J. (1994a). Usability engineering. Morgan Kaufmann. Nielsen, J. (1994b). Enhancing the explanatory power of usability heuristics. In Proceedings of the SIGCHI Conference on Human Factors in Computing Systems (pp. 152–158). Nielsen, J. (2024). 10 usability heuristics for user interface design. Nielsen Norman
Group. Nielsen Norman Group Norman, D. A. (2013). The design of everyday things (Revised and expanded ed.).
Basic Books. Ntoa, S. (2025). Usability and user experience evaluation in intelligent environments: A review and reappraisal. International Journal of Human–Computer Interaction, 41(5), 2829–2858. Preece, J., Rogers, Y., & Sharp, H. (2013). Design de interação: Além da interação
homem-computador (3ª ed.). Bookman. Rubin, J., & Chisnell, D. (2008). Handbook of usability testing: How to plan, design, and conduct effective tests (2nd ed.). Wiley. Saunders, M., Lewis, P., & Thornhill, A. (2019). Research methods for business
students (8th ed.). Pearson. Sauro, J. (2010). A practical guide to measuring usability: 72 answers to the most common questions about quantifying the usability of websites and software. Measuring Usability LLC. Tan, W.-S., Liu, D., & Bishu, R. (2009). Web evaluation: Heuristic evaluation vs. user
testing. International Journal of Industrial Ergonomics, 39(4), 621–627. Turner, C. W., Lewis, J. R., & Nielsen, J. (2006). Determining usability test sample size.
In International Encyclopedia of Ergonomics and Human Factors (pp. 3084–3088). Zardari, B. A., Hussain, Z., Arain, A. A., Rizvi, W. H., & Vighio, M. S. (2021).
QUEST e-learning portal: Applying heuristic evaluation, usability testing and eye tracking. Universal Access in the Information Society, 20(3), 531–543.
SEARCH THE AHFE DIGITAL BOOKSTORE BY ISBN
Explore the complete digital volume
Human Interaction and Emerging Technologies (IHIET 2026)
Read this individual research paper free through the original publisher, or explore the full digital proceedings book.