Kei Shimonishi, Takuma Kogo, Kazuaki Kondo, Hirotada Ueda, Yuichi Nakamura (2026). Analyzing the Viscoelastic Correspondence Between Facial Electromyography and Facial Appearance During Smiling. In: Human Interaction and Emerging Technologies (IHIET 2026). AHFE Open Access, vol. 236, pp. 359–369. https://doi.org/10.54941/ahfe1008111
Quantitative modeling of facial expression dynamics is fundamental for human-centered sensing and interaction. While facial appearance provides a non-contact means of observation, assigning consistent intensity values remains challenging. Conversely, facial electromyography (fEMG) directly captures muscle activation but requires physical contact. This study investigates the dynamic correspondence between these modalities during smiling by evaluating whether an interpretable viscoelastic model can characterize their relationship. To overcome the challenge of fEMG electrodes occluding facial features, we utilized the bilateral symmetry of facial expressions, recording fEMG on one side of the face while capturing video of the contralateral side. Facial appearance was quantified using a comparison-based ranking method to derive ordinal smile intensities, while fEMG signals were decomposed into muscle synergies using non-negative matrix factorization. We hypothesized that the transformation from muscle contraction to visible tissue deformation follows viscoelastic principles. Specifically, we employed the standard linear solid (SLS) model to account for temporal dynamics and compared its performance against a static linear baseline. Experimental results from natural smiles elicited by comedic stimuli revealed strong correlations between synergy activation and smile intensity, with facial appearance consistently lagging behind muscle activity. The SLS model outperformed the linear baseline for the majority of participants, more accurately capturing delayed onsets and gradual relaxation phases. These findings suggest that incorporating viscosity provides a physically interpretable explanation of expression manifestation. This framework establishes an explainable bridge between physiological activity and visual dynamics, offering a foundation for more robust facial sensing technologies.
Quantitative modeling of facial expression dynamics is essential for human- centered sensing and interaction technologies. Expression dynamics can be captured from facial appearance in video and from facial electromyography (fEMG).
Appearance-based methods are non-contact and easy to acquire; however, assigning consistent and appropriate quantitative values to facial expression intensities, e.g., 30% smile, remains challenging, even for human observers because the way of expressing facial expression depends on each person. Although several studies employ facial action coding systems (FACS) proposed by Ekman et al. (1978) to assess the intensity of facial expressions, they have a limitation that small detection and quantization errors can lead to serious negative effects.
On the other hand, fEMG directly captures changes in facial expressions as electrical signals, enabling the intensity of expressions to be obtained as physical signals that are closer to brain activity. However, measuring fEMG requires attaching electrodes to the face, making the preparation process cumbersome and unsuitable for everyday use.
From these observations, this paper aims to clarify the relationship between fEMG and the visible appearance of facial expressions, as a fundamental step toward estimating underlying muscle activity from facial appearance. Rather than learning an end-to-end mapping between these modalities, this study analyzes their dynamic correspondence during smiling and evaluates whether an interpretable viscoelastic model can account for the observed relationship.
DEVELOPING A MODEL FOR FACIAL DYNAMICS To deeply understand human states, it is crucial to go beyond superficial observations and clarify the physical relationship between internal physiological mechanisms and external visual manifestations. Facial expressions result from facial tissues, which are composed of skin and subcutaneous fat, being pulled by muscle contractions. Since these tissues possess viscoelastic properties, their deformation is not instantaneous but depends on the history of applied force. By modeling this biomechanical transformation, we can establish a quantitative bridge between internal muscle activation and visible changes in appearance.
Facial Appearance Analysis Based on an Ordinal Scale To address the problem of evaluating expressions that include weak intensities, we employ a comparison-based smile intensity estimation method previously proposed by our research group (Shimonishi et al., 2024). This method is designed to evaluate facial expression intensity on an individual- specific scale with sufficient granularity to capture subtle changes.
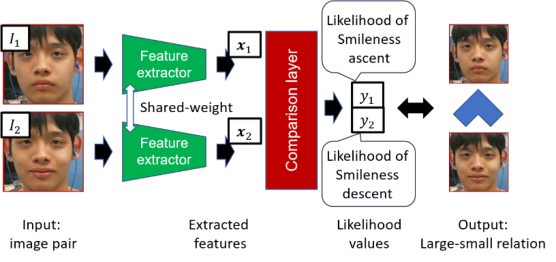
While it is difficult to assign an absolute intensity value to a single facial expression image, comparing two images to determine “which image exhibits a stronger expression” is straightforward, provided the difference in intensity is not exceptionally small. Therefore, this method utilizes a Siamese network- based classifier proposed by Kondo et al. (2021) (Figure 1) to learn the intensity comparison of the observed individual’s facial images. This enables the construction of a subject-specific classifier that estimates the relative intensity between two facial images of the same individual.
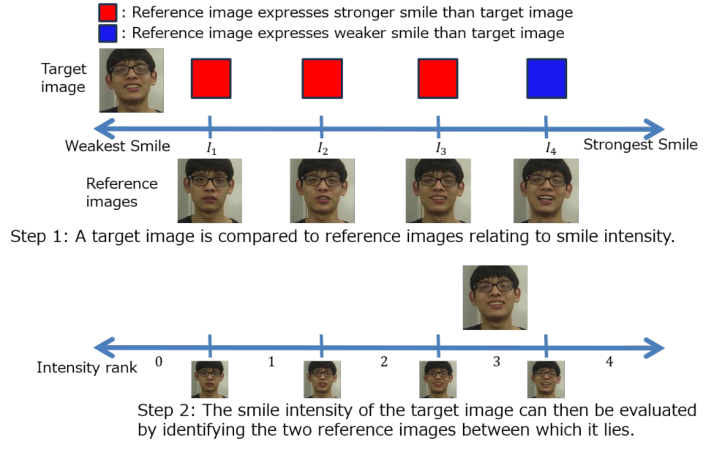
Figure 1: Comparison-based facial expression recognizer (Kondo et al., 2021).Figure 2: Overview of ordinal-scale intensity assessment (Shimonishi et al., 2024).
Using this comparison framework, facial expression intensity can be evaluated with an ordered set of subject-specific reference images { }
R r r=1 I , where the reference images are arranged in ascending order of expression intensity and R denotes the number of ranks. These reference images are selected to represent distinct intensity levels for the individual, typically using approximately 10–20 discrete ranks to obtain a stable and interpretable scale. The intensity (rank) of an input image I is then estimated by comparing it with the ordered references. In other words, if a rank j is found such that Irj < I < Irj+1, the rank of the facial expression image I is determined to be j, as shown in Figure 2.
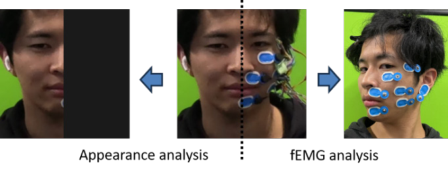
Figure 3: Simultaneous measurement.
The details of the reference-image selection procedure are described in the literature (Shimonishi et al., 2024). Briefly, given a sufficiently large set of facial images from the same individual, pairwise comparisons are used to construct an ordinal ordering of expression intensity, from which a subset of representative reference images is selected taking ambiguity between adjacent intensities into account.
Muscle Synergy Analysis by NMF Physiological muscle activity is analyzed using a muscle synergy framework. This framework models coordinated multi-muscle activity based on the synergy hypothesis, which suggests that the central nervous system controls complex movements by activating a small number of muscle groups rather than individual muscles (Giszter et al., 1993). This hypothesis is particularly relevant for facial expressions where many small muscles act in a highly coordinated manner. Indeed, Shu et al. (2025) demonstrated the usefulness of muscle synergy in facial expression recognition.
To apply this framework, a high-pass filter is first applied to the raw multi- site fEMG signals to remove low-frequency noise. Muscle activation levels are then computed its maximum value during the measurement period to construct the observation matrix M. Fundamentally, these processed fEMG signals directly capture the neural drive to the muscles, providing a physical signal closer to brain activity than visual appearance alone.
Using Non-negative Matrix Factorization (NMF), we decompose the observation M into spatial patterns W and temporal activation profiles H, such that M ≈ WH. Each synergy in W represents a specific coordination pattern (e.g., for Zygomaticus Major and Levator Anguli Oris), while the profile h(t) ∈ H presents its underlying activation command. Furthermore, following previous research (Shu et al., 2025), the number of components is determined as the minimum number for which the Global Variance Accounted For (Global VAF) exceeds 0.9.
Correspondence Analysis Between Facial Image and Facial Muscles The objective of this study is to investigate the relationship between the facial expression evaluation method described above and the cooperative patterns of muscle synergies.
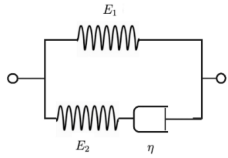
Figure 4: Illustration of SLS model.
However, when attempting to simultaneously measure the visual appearance of facial expressions and electromyographic signals, the regions where electrodes are attached may obscure parts of the face, or the electrodes themselves may interfere with natural muscle movements. In other words, it is impossible to simultaneously measure both the visual appearance and the muscle synergies in the same facial region for direct correspondence analysis.
To address this issue and obtain facial appearance and electromyographic signals simultaneously in a comparable manner, we focus on the bilateral symmetry of the face. Referring to the prior study by Li et al. (2024), and under the assumption that facial expressions are elicited in a largely symmetric manner, electrodes were attached to the left half of the face, while the wiring was arranged so that electrodes and cables did not appear on the right half, which was used for visual measurement, as shown in Figure 3.
To verify the validity of this assumption, a preliminary experiment was conducted. Electrodes were symmetrically attached at six locations to measure fEMG signals during spontaneous smiling elicited by comedy videos, and temporal correlations were computed between corresponding facial muscles. The maximum correlation was obtained when the temporal shift was within ± 2 ms (two samples). These results support the bilateral symmetry of fEMG signals and indicate that measuring facial appearance and fEMG separately on each half of the face is appropriate for the present correspondence analysis.
Viscoelastic Modeling of Facial Express To analyze the relationship between facial appearance and fEMG, we establish their correspondence using a physically interpretable model. Human facial expressions emerge when muscles contract and exert force on the skin, which exhibits viscoelastic properties, causing visible deformation. Therefore, we assume that the mechanical response of facial muscles can be approximated by a viscoelastic model.
The Standard Linear Solid (SLS) model, also known as the Zener model, is a three-element model consisting of elastic moduli E1,E2, and a viscosity coefficient 𝜂, as shown in Figure 4. In the SLS model, the stress σ(t) and strain ϵ(t) are described by the following first-order linear ordinary differential equation: ( ) ( ) ( ) ( ) 1 1 2 2 1 . η σ σ ∈ η ∈ [Equation or mathematical symbol available in the original paper PDF][Equation or mathematical symbol available in the original paper PDF] + = + + [Equation or mathematical symbol available in the original paper PDF][Equation or mathematical symbol available in the original paper PDF][Equation or mathematical symbol available in the original paper PDF][Equation or mathematical symbol available in the original paper PDF][Equation or mathematical symbol available in the original paper PDF][Equation or mathematical symbol available in the original paper PDF] E t t E t t E E
Table 1: Major Action Units (AUs) related to smiling.
Table available in the original PDF paper.
AU FACS Name Primary Muscle (s) Appearance & Action Characteristics AU 6 Cheek Raiser Orbicularis oculi (pars orbitalis) Raises cheeks, pushes up lower eyelids, and narrows the eyes (forming wrinkles at the outer corners).
AU 12 Lip Corner Puller
Zygomaticus major
Pulls the corners of the lips obliquely upwards, forming a typical smile shape.
AU 20 Lip Stretcher Risorius Stretches the lips straight horizontally.
Upper and lower lips separate. Typically, the initial movement of opening the mouth.
AU 25 Lips Part Depressor labii inferioris Orbicularis oris AU 26 Jaw Drop Masseter and Temporalis
Lower jaw drops, causing the mouth to open vertically.
In this study, we attempt to apply the SLS model to describe the relationship between the temporal patterns of muscle synergies extracted by NMF and smile intensity. Specifically, we assume that muscle activation corresponds to the “force (stress)” applied to the facial muscles, and that the resulting “smile intensity (facial surface deformation)” corresponds to “strain.” Accordingly, the temporal pattern of muscle synergies obtained by NMF, (h(t)), is treated as the stress (σ(t)) generated by muscle activity, while the smile intensity (S(t)) is treated as the strain (ϵ(t)). Introducing a weight vector (c) for each synergy and substituting (ϵ(t) = S(t)) into the constitutive equation of the SLS model, we derive the relationship between (h(t))) and (S(t)).
This yields the following equation describing the relationship between the temporal patterns of muscle synergies and the smile intensity: [Equation or mathematical symbol available in the original paper PDF][Equation or mathematical symbol available in the original paper PDF] E t t E S t S t E E ch ch ( ) ( ) ( ) ( ) T T 1 1 2 2 1 . η η [Equation or mathematical symbol available in the original paper PDF][Equation or mathematical symbol available in the original paper PDF] + = + + [Equation or mathematical symbol available in the original paper PDF][Equation or mathematical symbol available in the original paper PDF][Equation or mathematical symbol available in the original paper PDF][Equation or mathematical symbol available in the original paper PDF]
EXPERIMENTS AND RESULTS Experimental Setting
An experiment was conducted to establish the correspondence between fEMG and facial appearance using the SLS model and to verify whether the visible facial expression exhibits viscoelastic properties.
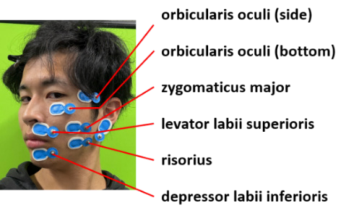
To analyze the relationship between facial appearance and fEMG, we measured the electromyographic activity of facial muscles primarily associated with smiling. Table 1 summarizes the primary Action Units (AUs) and muscles associated with smiling. In this study, rather than measuring all the listed muscles, we selectively measured five crucial muscles across six locations (illustrated in Figure 5). These specific sites were chosen based on their primary importance in smile expression and to ensure independent measurement without spatial overlap. Furthermore, to accommodate this multi-site recording within the spatially constrained facial area, we employed a unipolar electrode configuration. Because unipolar recording requires fewer electrodes per measurement site compared to bipolar methods, it facilitates the necessary high-density placement.
Figure 5: The selected muscles and their corresponding electrode placements.Table 2: Maximum temporal correlation between muscle synergy temporal patterns and smile intensity for each participant and corresponding time lag. Positive lag means the change of smile intensity is delayed.
Table available in the original PDF paper.
Time Lag(s)
Participant Maximum Correlation Coefficients A 0.82 0.32
B 0.77 0.12 C 0.83 0.17
D 0.85 0.03 In this experiment, forward prediction was performed using the SLS model to predict smile intensity from the temporal patterns of muscle synergies. The parameters c and {E1, E2, n} were estimated by minimizing the prediction error. Specifically, smile intensity obtained from the right half of the face was predicted from fEMG signals measured on the left half using the SLS model. Model performance was evaluated using the coefficient of determination (R2) and the correlation coefficient. For comparison, a linear model without a viscosity term was used as a baseline.
Four participants (three males and one female) took part in the experiment. To elicit natural smiles, participants were asked to watch comedy videos while their fEMG signals and facial appearance were recorded. Facial regions were extracted frame by frame from the recorded videos, and masking was applied to the left half of the face to conceal the electrodes. The time series of smile intensity was computed as described above.
Experimental Results During the approximately 25 minutes of measurement per participant, we observed 69, 122, 63, and 55 smile peaks for Participants A, B, C, and D, respectively. Regarding muscle synergy extraction, the NMF analysis revealed that the Global VAF exceeded 0.9 with a single component for all participants. Therefore, the number of components was set to one. Because the participants were instructed to produce only natural smiles, a single synergy component appears sufficient to represent this specific expression. Additionally, the number of ranks for the smile intensity scale was individually defined for each participant, ranging from 10 to 20, to ensure clear discrimination among the reference images.
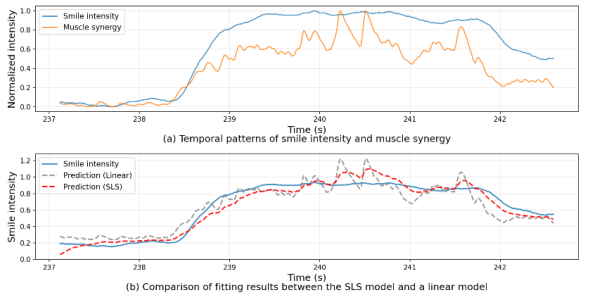
Figure 6: Example of successful fitting for Participant B.
First, temporal cross-correlation between the muscle synergy temporal patterns and smile intensity was computed for each participant. As shown in Table 2, high maximum correlation coefficients (0.7748 - 0.8517) were obtained for all participants, indicating that muscle synergy activity and smile intensity vary in a strongly correlated manner.
The maximum correlation was observed when smile intensity was delayed by approximately 0.03 - 0.32 s. This delay is considered to reflect the electromechanical delay, which represents the physical time lag between the onset of electrical muscle activity and the actual generation of mechanical tension that produces visible facial movement.
Next, smile intensity was predicted from the temporal patterns of muscle synergies. For each participant, segments corresponding to smile onset and offset were extracted. Each signal was normalized by its maximum value. Independent fitting was performed for each segment using both the linear model and the SLS model. Representative examples for Participant B are shown in Figures 6 and 7.
Figure 6 shows an example of relatively good fitting, illustrating the advantages of the SLS model. During smile onset, the linear model responds too quickly to the initial muscle activation and predicts an earlier rise than the measured smile intensity. In contrast, the SLS model appears to better reflect the physical delay, with an onset timing closer to the observed intensity. During smile offset, the SLS model also follows the gradual relaxation of facial appearance more closely. Whereas the linear prediction drops abruptly the SLS model reproduces the more gradual decrease observed in the actual smile. These results suggest that incorporating viscoelasticity helps capture both the delayed onset and the slow decay observed in natural facial tissues dynamics.
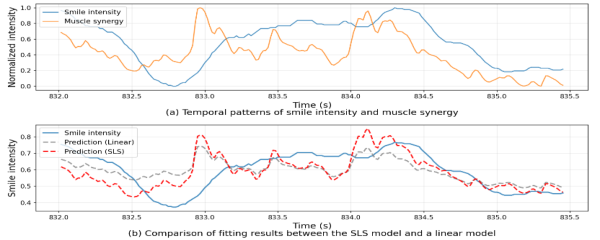
Figure 7: Example of insufficient fitting for Participant B.Table 3: Prediction performance of smile intensity from muscle synergy temporal patterns.
Table available in the original PDF paper.
Participant Model MSE MAE R2 A Linear 0.0178 0.1031 0.6366
SLS 0.0137 0.0887 0.7215 B Linear 0.0287 0.1281 0.5930
SLS 0.0277 0.1329 0.6067 C Linear 0.0171 0.1020 0.6784
SLS 0.0149 0.0983 0.7288 D Linear 0.0181 0.1082 0.7250
SLS 0.0235 0.1204 0.6436 Conversely, Figure 7 presents a case in which the fitting was less successful. In this example, a single sustained smile is accompanied by multiple successive bursts of muscle activation. While the measured smile intensity remains relatively high and continuous, the predictions of both models fluctuate substantially in response to the individual fEMG bursts. In particular, the predicted intensity decreases inappropriately between the bursts and does not reproduce the sustained nature of the observed expression. This result suggests that the current models have difficulty integrating multiple discrete muscle activations into a single continuous smile, indicating a limitation in modelling prolonged expressions drive by repeated neural inputs.
Table 3 summarizes the prediction performance over all extracted segments for each participant in terms of mean squared error (MSE), mean absolute error (MAE), and coefficient of determination (R2). For Participants A, B, and C, the SLS model showed better predictive performance than the linear model, with lower MSE and MAE and higher R2 values. These results suggest that incorporating viscoelastic can provide a more accurate overall description of smile intensity for most participants.
Table 4: Temporal correlation metrics of muscle synergy patterns. Positive lag means the change of estimated smile intensity is delayed.
Table available in the original PDF paper.
Time Lag(s)
Participant Model Maximum Correlation Coefficients A Linear 0.817 –0.317
SLS 0.852 –0.083 B Linear 0.775 –0.117
SLS 0.795 0.050 C Linear 0.834 –0.167
SLS 0.862 0.067 D Linear 0.852 –0.033
SLS 0.855 2.00
Table 5: Estimated parameters.
Table available in the original PDF paper.
Participant C E1 E2 𝜂 A 0.407 0.050 1.778 2.648 B 1.228 0.175 0.733 2.609
C 0.461 0.088 0.269 3.983 D 0.052 0.017 0.013 4.628
To further examine the source of this improvement, we evaluate temporal correlation metrics, focusing on the maximum correlation coefficient and its corresponding time lag, as shown in Table 4. The results indicate that, for most participant, the SLS model reflects the time-delay characteristics more appropriately than the linear model. For example, for participant A, the temporal lag was reduced from –0.317 s to –0.083 s. This tendency suggests that the viscosity term in the SLS model may help capture the delayed change in facial appearance relative to fEMG activity, thereby reducing temporal misalignment.
The estimated parameters of the SLS model shown in Table 5 provide a physical interpretation of the observed fitting behavior. Note that, because the number of muscle synergy was set to 1, weights parameter c becomes scalar. Across participants, the viscosity coefficient (ƞ) was estimated to be larger than the elastic moduli (E1 and E2), which is consistent with the possibility that facial tissue dynamics are strongly damped. At the same time, these parameters may also help explain the degraded performance observed for Participant D. Unlike the others, Participant D exhibited an exceptionally small inherent time lag, as indicated by the linear model’s lag of –0.033 s. However, the optimization yielded the highest viscosity (ƞ = 4.628) and the smallest elastic moduli (E1 = 0.017, E2 = 0.013) among all participants. Because this participant’s actual facial response was nearly instantaneous, fitting the data with such high viscous, over-damped configuration appears to have introduced an excessive delay of 2.00 s. This result suggests that,
Analyzing the Viscoelastic Correspondence Between Facial Electromyography 369 although the viscosity term is useful for describing natural facial delays, it may lead to overestimated delays and reduced accuracy in individuals whose facial responses exhibit minimal lag.
CONCLUSION
In this study, to explore the correspondence between facial appearance and fEMG, we measured both signals while focusing on facial symmetry and established their relationship using muscle synergies and smile intensity.
A strong correlation was observed between the temporal patterns of muscle synergies and smile intensity, indicating that these measures are effective for quantifying facial expression intensity. Furthermore, it was found that facial appearance changes with a temporal delay relative to fEMG activity.
By attempting to explain the relationship between these two signals using a simple physical model, we demonstrated that the SLS model can reproduce the time-delay relationship between fEMG and visible appearance to some extent. This result suggests that facial expression changes exhibit viscoelastic characteristics.
A limitation of the current study is that the proposed model did not achieve satisfactory fitting in cases where fEMG activity exhibited multiple activations within a single smile. Therefore, more complex models that can reflect different temporal tendencies are required. In addition, differences in time delay and prediction accuracy were observed among participants, suggesting the influence of individual variability. It is necessary to increase the number of participants to verify the reproducibility and generalizability of the model. Furthermore, applying the proposed approach to data containing mixtures of multiple facial expressions, where muscle synergy cooperative patterns may not be represented by a single component, remains an important future challenge.
ACKNOWLEDGMENT
This work was supported by JSPS KAKENHI 25K21223.
REFERENCES
Ekman, P. and Friesen, W. V. (1978). Facial Action Coding System. Giszter, S. F., Mussa-Ivaldi, F. A. and Bizzi, E. (1993). Convergent force fields organized in the frog spinal cord, Journal of Neuroscience, 13(2), pp. 467–491. Kondo, K., Nakamura, T., Nakamura, Y. and Satoh, S. (2021). Siamese-structure
deep neural network recognizing changes in facial expression according to the degree of smiling, in: Proc. of ICPR2020, pp. 4605–4612. Li, J., Lu, S., Wang, Y., Dong, Z., Wang, S.-J., and Fu, X. (2024). Could microexpressions be quantified? Electromyography gives affirmative evidence, arXiv:2409.00017. Shimonishi, K., Kondo, K., Ueda, H. and Nakamura, Y. (2024). Ordinal scale
evaluation of smiling intensity using comparison-based network, in: Proc. of ML4CMH, AAAI2024 workshop, pp. 64–73. Shu, L., Barradas, V. R., Qin, Z. and Koike, Y. (2025). Facial expression recognition through muscle synergies, Frontiers in Bioengineering and Biotechnology.
SEARCH THE AHFE DIGITAL BOOKSTORE BY ISBN
Explore the complete digital volume
Human Interaction and Emerging Technologies (IHIET 2026)
Read this individual research paper free through the original publisher, or explore the full digital proceedings book.