Stefan Pickl (2018). Integration of Human Factors' Aspects into Multilayered Reachback Operations via IRIS Integrated Reachback Information System. In: Advances in Human Factors, Software, and Systems Engineering. AHFE Open Access, vol. 4. https://doi.org/10.54941/ahfe100128
Key elements of modern decision making processes are reachback operations. Complex analytic processes like modelling, simulation and optimization as key discipline of Operations Research (OR) are supported by reachback processes. Within such a special multilayered process the integration of soft- and hard OR techniques is essential. This contribution focuses especially on the aspect how Human Factors components can be embedded in an optimal way: We present the IRIS research project and describe its impact on living labs. Actual results which are connected with international Maritime Interdiction Operations (MIO) and complex transportation networks are described and discussed within the presentation.
The reliability of transportation networks (as motivating example) is becoming more and more important in today’s society. A large group of people uses different kind of transportation networks every day. On the one hand people use them for example for commuting. On the other hand these networks are indispensable for the industry. The outage of one connection of one part or the whole transportation network can lead to delays and an increase in costs as well as to a separation of the network. The past 15 years have shown that the danger of an outage of transportation networks due to terroristic threats is real. The development of a simulation tool will make the danger of terroristic threats predictable by being able to identify the critical elements of a complex network. We connect actual results with the unique CENETIX testbed and embed a special Human Factors Perspective into consideration.
Complex Networks A transportation network consists of nodes and edges. Critical elements are nodes respectively edges, which have a high importance for the complex network and which have a high potential risk. The better a (transportation) network is interconnected; the lower is the impact of changes within the network. The grade of a node represents the number of edges it is connected to. The higher the grade of a node, the lower is the chance of an outage of the node due to an Computing, Software, and Systems Engineering (2018) attack from the outside (except the node itself is taken out). In the following we focus on computational aspects and the development of an flexible decision support tool based on such a network model. Results are connected with the national research project RIKOV by the BMBF (Bundesministerium für Bildung und Forschung).
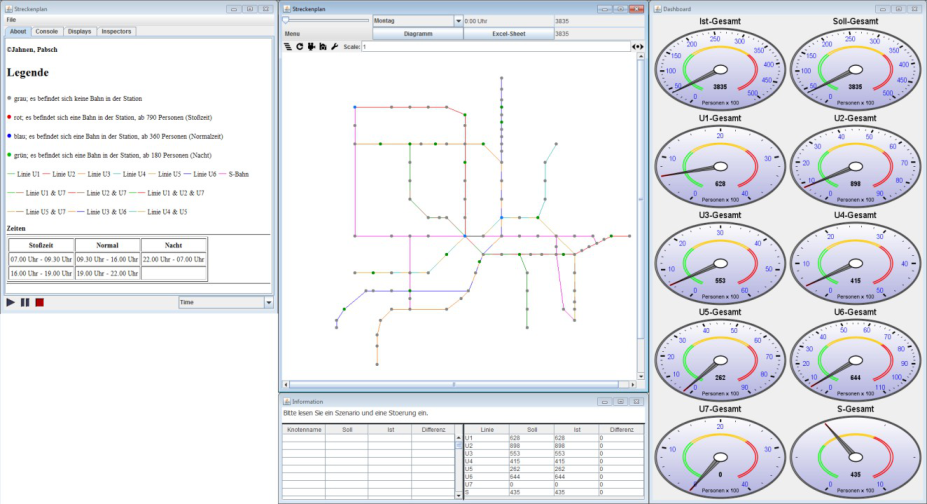
Computational Networks - Decision Support Tool The goal of a student project embedded in RIKOV done by Sebastian Jahnen and Simon Pabsch at UBw Munich was to develop a simulation tool, which makes the danger of an outage of transportation networks due to terroristic threats predictable (Figure 1). Requirements were imposed to reach this goal. First of all the tool has to be very flexible to be used in different kinds of transportation networks (e.g. long-distance train services, public transportation services, road networks; an extension to air transportation networks and maritime situations is intended). A database is included to guarantee a flexible design, especially to embed it into the maritime CENETIX (Center for Network Innovation and Experimentation at NPS -Naval Postgraduate School- Monterey) environment. The database consists of all the data of the studied transportation network (schedules, nodes, edges, number of passengers to be transported, number of vehicles to be transported, etc.). With the help of the information provided by the database the tool can calculate various operating numbers including the grade of the node, the difference in cost, the importance of an edge, the potential risk of an edge as well as the occupancy rate and the idle capacities within the transportation network. Among other features the “Dijkstra-Algorithm” is used to calculate the operating numbers. This algorithm determines the shortest route from a starting point to a finishing point by comparing the costs (e.g. time of travel) of all alternatives and is therefore indispensable for further calculations (Mason2005).
Figure 1. GUI of the Decision Support Tool
Beyond the calculation of operating numbers the tool is under standard circumstances now also able to calculate different scenarios (e.g. Maritime Interdiction Operations with a Focus on a special Human Factors Perspective) and additionally considers disturbances (e.g. breakdown of an edge/node, etc.). If the scenario and multiple disturbances are set up and they influence the initial route, the tool will automatically calculate a different connection and its operating numbers.
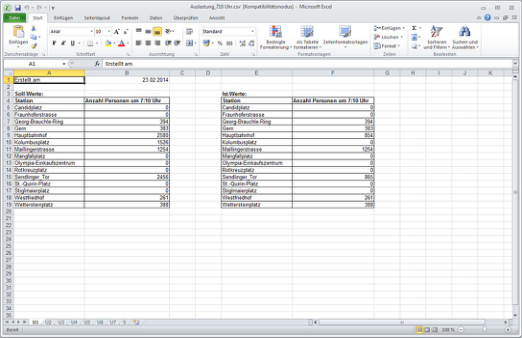
The scenarios and disturbances can be put into the system by XML-documents. Additionally disturbances can be added by an input mask afterwards. The data generated by the calculations can be exported in form of csv-files. This ensures the ability to statistically analyze the results of different scenarios:
Figure 2. Readout in CSV format for integration in CENETIX.
Furthermore it is possible to export an evaluation of the whole complex network in form of csv-files. This evaluation contains multiple operating numbers (overview of the grid, connectivity, efficiency and vulnerability). It’s easy to extend the evaluation with other operating numbers (e.g. maximum number of planes which can be handled by an airport, interdicting operations on boats in the CENETIX environment …).
Technical Details – The Implementation of the Decision Support The tool was implemented using the programming language JAVA (Version 7). This enables the tool to run on any operating system. There is no data included in the source code to ensure the desired flexibility. All required date is collected from the database, which is a MSSQL-database (dbo-scheme).
Following tables have to be included in the database in this form:
1. One table with the times of departure of each node (e.g. station, airport, harbour) 2. One table with the occupancy of the vehicles (e.g. trains, airplanes, boats) of connection 3. Two tables with all the nodes 4. One table with all edges (connections of the nodes).
Different frameworks were included in the development of the tool to ensure the demanded functionalities. The following list contains the used frameworks and describes their functions (see also Mason 2005).
5. Mason-Framework 1. Establishes the frame for the simulation 2. Provides the necessary classes for the implementation of the tool 6. SQL-JDBC 1. Driver, which enables Java to access a MSSQL-database 7. JFreeChart 1. Enables a visualized output of the operating numbers (Figure 2) 8. JExcelAPI 1. Interface for output of the data in the csv-format (Figure 4) 9. JDOM 1. Java-library for reading in XML-files (disturbances, scenarios) (Figure 3)
Feature list:
1. access to a SQL-database (e.g. MSSQLServer) 2. set the current occupancy by the timeline 3. export the current occupancy (to csv and/or xls), see Figure 2
4. set up incidents 1. single node 2. section 5. import of incidents (XML) 1. single node 2. section 6. variance analysis: export current occupancy considering incidents (to csv and/or xls) 7. import of scenarios (XML) 8. export of the evaluation of the given scenario 9. combination of scenario and incident 10. export an evaluation of the whole transportation network (to csv and/or xls)
Flexible Design There are almost no limits to the possibilities of extending the tool because of the flexible design. An implementation of further functions is therefore not just possible but also encouraged. One of the possible extensions could be the ability to process multiple scenarios at the same time to display a comparison of different effects. Furthermore more characteristics of transportation networks can be added (e.g. connecting time). Another possibility to extend the tool could be to include real-time data (e.g. flight schedule, delay schedule). Based on this data it is possible to simulate an incident and analyze the effects. We include now some insight in the management cockpit:
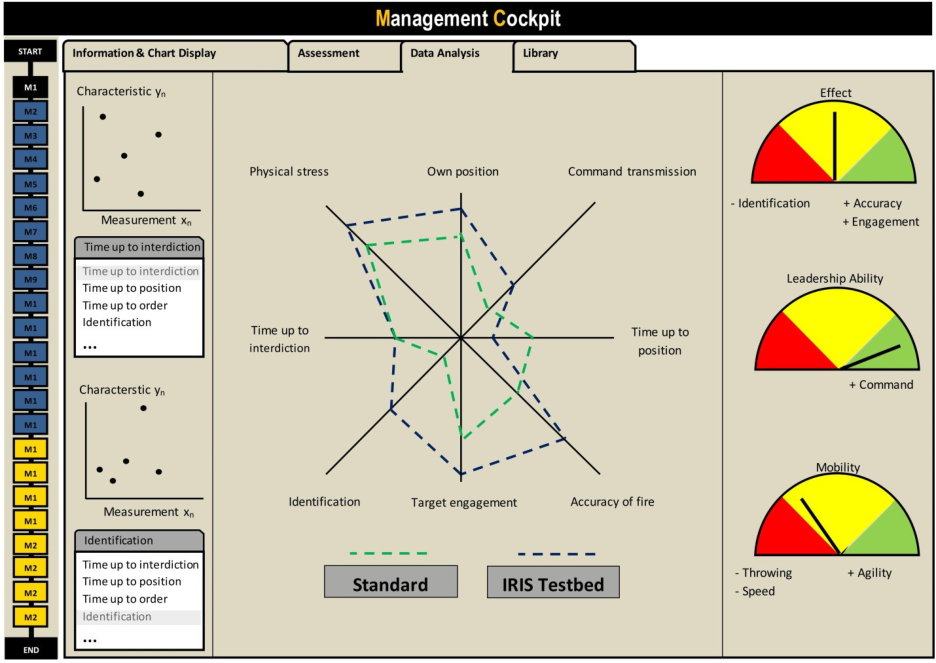
Holistic Management Cockpit for Human Factors Perspective A Management cockpit provides generally the intelligent reduction, structuring, and ergonomic arrangement of analysis and management information (which was presented in the last paragraph). Furthermore, it enables the effective communication and decision-making processes for the analyst and experiment team (which is a central part in CENETIX). An advantage of the effective information supply is the possibility to switch between an overview and a detail insight and to focus on the Human Factors Perspective:
As a result, the team has a horizontal and systematical overview across different issues. Therefore, the main functions can be sum up as follows
With the help of such a management cockpit which integrates these aspects we are able to organize an effective and transparent information supply based on the numerical results presented so far: Human Factors and SMART
1. Synergetic: ergonomic design of the main information 2. Monitor Key performance indicators: monitor KPIs for decision support
3. Accurate: valid and consistent data 4. Responsive: definition of threshold 5. Timely: real time data
Furthermore, the visually prepared information is tailored to management needs, and focused on analysis and decision-making, especially from a Human Factors perspective. In addition, there are an effective management collaboration and first impression overview of the collected data. On the other hand, the management cockpit visualizes a continuous monitoring of key parameters of the interdiction phase including an alert function (as part of the experimental Integrated Reachback Experimentation System IRES). The structured and intuitive collecting of data and creation of a valid and consistent database serve as a basis for the analysis (Daum, J. (2006):
Figure 3: Management Cockpit for IRIS Testbed
Standardization of Experimental Processes -IRIS and Usability Analysts and the experiment lead are confronted with such data, most of which is not relevant for decision-taking and management issues. Consequently, the experiment lead is exposed to a tremendous flood of information. Then, the necessary information for experiment control and management is missing. Therefore, there are different fields of use, such as:
1. Business management support: Corporate development, business goals compliance, ... 2. Stock/Warehouse monitoring: Stock of inventory, supplies, … Computing, Software, and Systems Engineering (2018)
3. Project management: Monitoring the schedule, … 4. Finance control: Forecasting of trends, … 5. Marketing & Distribution: Identification of customer groups, sales analysis, … 6. Production plant Monitoring: Analyses of workload, … 7. Human resource management 8. Human Factors Integration
As a result, a management cockpit, presented in the last paragraph, provides a standardizing of the experimental management process. Furthermore, the analysts are able to focus on specific events and samples due to the highlighted trends and patterns (Daum, J. (2006). Our aim is a Integrated Reachback Information System (IRIS): IRIS is an intelligent Management Cockpit designed especially for operations on such complex networks with a multilayered structure. In this reachback process intuitive operating is a key feature of a management cockpit to insure the advantages in the fields of analysis and management support; therefore the integration of a human factors perspective is essential: Sometimes the practice shows that there is a lack of operator convenience especially by inexperienced users. Furthermore the management cockpits offer a very large number of key parameters and information. As a consequence, the users are lost within an information overload.
The advantage to provide a simplified access to the decision analysis and support is reduced in a significantly way. Therefore the developers have to consider the usability and customer needs during the design process of a management cockpit as early as possible.
To evaluate and increase the operability -especially from the Human Factors perspective- the following process is recommended. The process was developed by Michael Preuss in an research project which is part of RIKOV:
Usability-Process
1. Usability
Development of Usability test criteria and requirements of the information display (discriminability, compactness, consistence, distinguishability, understandability) and the design of the human-machine dialogue (controllability, fault tolerance, expectation compliance, learnability) with respect to established usability heuristics according to Nielsen, Shneiderman and Dahm.
2. Measurement of the Operability
Realization of a summative evaluation of the usability based on the previously defined test criteria to perform a measurement of the operability. At this possible flaws will be detect. On the one hand empirical evaluations can be used with the help of usability tests and questionnaires. On the other hand there is the possibility to use an analytical evaluation in terms of Cognitive Walkthroughs.
3. Cognitive Walkthrough
The Cognitive Walkthrough is an inspection method focusing on the simplicity to accomplish a task with the management cockpit. In addition cognitive Walkthroughs should be conducted with groups of skilled and unskilled users to identify differences and flaws in a general way. Further on the users should answer questions of control. Thus flaws of the design can be detected. Flaws can highlight problems of the intuitive use. Especially for critical stress situations is an intuitive operation necessary or even indispensable.
4. Usability Tests
Design and implementation of usability tests which comprise the collection of hard information like number of failures, clicks or time while the user work on typical scenarios. Possible examination questions can be:
1. When/where are uncertainties? 2. When/where are comprehension problems? 3. When/where is help needed? 4. When/where are frustrations?
Studies show that there is a probability up to 80% to detect usability failures. In combination with questionnaires the objective facts can be joined with subjective ratings of the user to abstract common examples. Furthermore there is a possibility to identify suggested improvements.
5. Analysis of Design Patterns
As a result usability and design patterns can be introduced analysed and extended. The design patterns based on the weak point analysis and identified potentials.
Relevant design patterns by Nielsen and Shneiderman are
1. Visibility of system status 2. Match between system and the real world 3. User control and freedom 4. Consistency and standards 5. Error prevention 6. Recognition rather than recall 7. Flexibility and efficiency of use 8. Aesthetic and minimalist design 9. Help users recognize, diagnose, and recover from errors 10. Help and documentation 11. Offer informative feedback 12. Design dialog to yield closure 13. Support internal locus of control
The IRIS approach focuses on an effective dialog within such complex operations. Flexibility and efficiency are central, furthermore IRIS is characterized by the fact that the following items are combined in one Management Cockpit:
1. Assessment 2. Data Analysis 3. Library
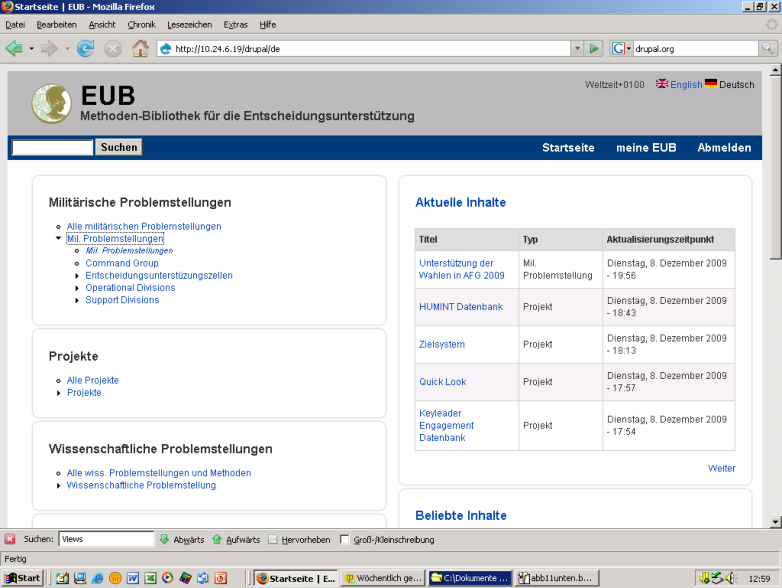
COMTESSA developed in the last years several innovative library systems which can be integrated in that process. Furthermore it will be integrated in the management cockpit.
Figure 4: Decision Support Library EUB TestBED IRIS -Integrated Reachback Information System
Society depends decisively on the availability of infrastructures such as energy, telecommunication, transportation, banking and finance, health care and governmental and public administration. Even selective disruption of one of these infrastructures may result in disruptions of governmental, industrial or public functions. Vulnerability of infrastructures therefore offers spectacular leverage for natural disasters as well as criminal actions. Threats and risks are part of the technological, economical, and societal development. Increasing complexity of our critical infrastructures exacerbates consequences of natural and/or man-made disasters. Not only primary effects but also cascading effects as result of increasing dependencies and interdependencies of our technological and societal systems demand intelligent simulation and optimization techniques in the area of industrial informatics and a comprehensive safety and security management. There is a need to analyze and forecast such threats via a new kind of experiments which allows to test such management cocpits. In the following we summarize the unique testbed CENETIX: The NPS Center for Network Innovation and Experimentation (CENETIX) was founded in 2004. The Center soon became nationally and internationally recognized for excellence in applied research studies of emerging networking and collaboration frontiers.
The Center provides students and faculty with opportunities for interdisciplinary study of agile socio-technological adaptive mobile networks, network-controlled unmanned vehicles, sensors, situationaö awareness architectures, and network decision support.
IRIS and CENETIX
IRIS will be embedded in CENETIX which integrates and manages a unique student-operated NPS Tactical Networking and MIO Testbed. Together with international partners, the Center integrates and operates a globally distributed testbed environment for the study of tactical self-organizing networks and network enabled operations.
The project work at CENETIX involves cooperation with researchers and students from National Laboratories and major universities, including Lawrence Livermore National Laboratory, the Army Research Laboratory, MIT, Johns Hopkins University, Carnegie Mellon University, the University of Alabama at Huntsville, the University of the Bundeswehr at Munich (COMTESSA), the NATO Maritime Interdictions Operations Training Center at Souda Bay, the Defense Science and Technology Agency of Singapore, and Salzburg Research. A strong group of industry partners supports CENETIX team work on TNT and MIO experiments. Industry and academic partners are available at the CENETIX website: http://cenetix.nps.edu.
The CENETIX team of faculty and students produces unique case-studies, innovative agile adaptive networking solutions, and new operational concepts for emerging network-centric operations. From the scholarly standpoint, the research at CENETIX is a vehicle for generating new concepts and theories. As a field model of emerging complex relationships between networked humans and machines in a tactical ad hoc mobile environment, the TNT testbed allows NPS team and partners to explore feasibility and major operational constraints associated with those relationships, and identify critical elements of emerging tactical networking frontiers”:
“Expert reachback is a key element of CENETIX; where complex collaboration and data sharing is analyzed and optimized in detail.”
Alex Bordetsky, Director CENETIX
CONCLUSIONS
CENETIX is actively contributing to the NPS mission by conducting a series of unique experimental studies leading to a better understanding of collaboration and global data sharing in the interagency as well as the coalition environment. The phenomenon of expert reachback and its application to real-time (which is a great challenge especially in the energy domain) support for Maritime Interdiction Operations missions has been in the center of CENETIX team research. The experimental and concept development research at CENETIX is conducted in close partnership with the NPS CRUSER, CORE Lab, SEED and Littoral Operations Center programs. In this contribution we pose the question in which way can this expert reachback experiences be integrated in the design; optimization and cost-benefit analysis of critical infrastructure energy systems. Our aim is to strengthen via modern reachback conceptions the resilience, survivability and affordabilty of criticical infrastructures via such an experimental framework.
ACKNOWLEGEMENTS The author wants to thank Alex Bordetsky for the excellent cooperation within CENETIX. Furthermore he wants to thank Sebastian Jahnen, Simon Pabsch and Michael Preuss for their excellent work within a unique student research project which was co-supervised by Erik Kropat and Silja Meyer-Nieberg. The gamut of work human factors and ergonomics practitioners perform is really impressive and has been discussed in greater detail by Karwowski (2005; 2006) and Salvendy (2006).
The author wants to thank Waldemar Karwowski for a lot of fruitful ideas and discussions which help to support this contribution.
REFERENCES
Bordetsky, A. and Netzer, D. (2010) Testbed for Tactical Networking and Collaboration”, International Command and Control Journal, Volume 3, Number 4. Bordetsky, A. and Matzouris, G. (2010) Micro and Pico Satellites in Maritime Interdiction Operations, In:
Proceedings of 15th International Command and Control Research and Technology Symposium, Santa Monica, CA Bordetsky, A. and Dougan, A. (2008). Networking and Collaboration on Maritime-sourced Nuclear Threats, In: Online Proceedings of Sixth Security Workshop, Washington, D.C. BPM 2004 (BPM 2004). Standard Group (2004): Business Performance Management Industry Framework
Document. Daum, J. (2006), “Management Cockpit War Room: Objectives, Concept and Function, and Future Prospects of a (Still) Unusual, But Highly Effective Management Tool in Controlling”, Zeitschrift für erfolgsorientierte Unternehmenssteuerung. Karwowski, W. (2005), “Ergonomics and human factors: the paradigms for science, engineering, design, technology
and management of human-compatibility systems”, Ergonomics, 48, pp. 436-463. Karwowski, W. (2006), “The discipline of ergonomics and human factors”, in: Handbook of Human Factors and Ergonomics, 3rd ed., G. Salvendy (Ed.). pp. 3-31, Hoboken, NJ: John Wiley & Sons. Malik (2005), Enterprise dashboards, Design and best practices for IT, Hoboken, NJ: Wiley. Mason(2005): A Multi-Agent Simulation Environment. Sean Luke, Claudio Cioffi-Revilla, Liviu Panait, Keith
Sullivan, and Gabriel Balan. In /Simulation: Transactions of the society for Modeling and Simulation International./ 82(7):517-527. Schmietendorf, K. (2012), “Synchronisation und Spannungsstabilität in einem Netzwerk von Synchronmaschinen“, Diplomarbeit, Universität Münster. Salvendy, G. (2006), “Handbook of Human Factors and Ergonomics”, 3rd ed., Hoboken, NJ: John Wiley & Sons.
LISTED IN THE AHFE DIGITAL BOOKSTORE CATALOGUE
Explore the complete digital volume
Advances in Human Factors, Software, and Systems Engineering
Read this individual research paper free through the original publisher, or explore the full digital proceedings book.
ISBN 978-1-4951-2096-1
Explore this ISBN in the AHFE Bookstore ↗Listed in the July 2026 bookstore catalogue; search by ISBN to confirm current availability · Digital book purchase optional