Diana Reicha, Hanna Jorinde Wittkugelb, Rainer Starkc (2021). How Do Immersive Driving Environments Influence User Performances and Experiences?. In: Advances in Human Aspects of Transportation: Part II. AHFE Open Access, vol. 16. https://doi.org/10.54941/ahfe100667
Prospective evaluations of human-vehicle-interactions during early prototyping stages are important (Mayhew, 1999) to ensure safety and usability for innovative solutions. To do so, highly realistic appearing test environments will help to provide reliable and valid findings. The high-end version of a realistic test environment is a real car driving study, of course. Nevertheless, they are difficult to control, manipulate and replicate and thus to standardize. They are also more time consuming and expensive. Therefore, one economizing suggestion is the implementation of immersive (driving) environments within simulator studies to provide users a more realistic feeling. This paper discusses research investigating the influence of different levels of immersivity within driving environments. Two important influencing factors were used to examine different levels of immersivity: visual parameters and auditory parameters. Objective data and subjective user impressions were measured and analyzed. Twenty participants took part in the driving simulator study and performed the Lane Change Task within different immersivity conditions. Objective and subjective data have shown advantages for the most immersive driving environment and provide evidence to suggest a more aware and realistic perception of the driving situation. Therefore, higher immersive driving environments are suggested regarding evaluations of prospective human-vehicle-interactions.
Prospective evaluations of human-vehicle-interactions during early prototyping stages are beneficial, important and useful, to ensure safety, usability and customer satisfaction for innovative solutions, e.g. in-car devices (Mayhew, 1999). To do so reliable and valid evaluation methods and verification tools need to be developed to support car (component) industry. Innovative in-car devices should increase driving comfort, and ensure safety of oneself and other road users. Thus, an ongoing evaluation during the development process regarding safety, usability and driving comfort is necessary. For such dual-task (driving and interacting simultaneously) evaluations a huge quantity of methods are available for developers (see Breuer, Bengler, Heinrich & Reichelt, 2003 for an overview). These methods differ significantly in the amount of time and money. Up to now, dual-task scenarios are evaluated mostly with driving simulator experiments. How big the amount of expenses in terms of time and costs while evaluating in- car devices are, depend on the type of applied driving simulator. Driving simulators differ regarding the grade of reality between each other and compared to real driving situations (Schindler, Kelsch, Heesen, Dziennus, Temme & Baumann, 2013). Driving simulator requirements may differ substantially depending on the research question and experimental set-up. Knappe, Keinath und Meinecke (2006) summarized advantages and disadvantages at the use of driving simulators, which should be taken into account regarding the choice of dual-task evaluation method. First, potentially dangerous driving scenarios can be realized risk-free for the driver. Infrequent and uncommon happenings can easily be replicated by simple configurations of the concerning traffic situations. Additionally, driving simulator experiments enable precise replication of concerning traffic situations as often as one likes. The implementation of more frequent unidirectional and bi-directional traffic volume is easier compared to real car driving experiments. Moreover, limiting factors of influence during the test drive, like weather changes or differences regarding lighting conditions because of different daytimes, don`t need to be taken into consideration while designing the experiment. All experimental simulator test drives are characterized by high efficiency and comparability. Additionally on top of that, an often used basis of assessment for in-car devices are objective measured variables, like number of lane deviations. Data collection doesn`t require such complicated sensors compared to real car driving experiments and for that reason data recording is more robust with simulator experiments.
Unfortunately, driving simulator lack regarding user’s perceived reality and presence experience. Thus, reliability and validity of the findings are reduced. Various factors are known to affect drivers’ workload (Mehler, Reimer & Zec, 2012). One of these factors is the context in which the driver is operating the vehicle, e.g. drivers might feel more stressed during heavy rain or snow on a jammed highway than on a sunny day driving along an empty road. But it is difficult to represent these risky situations to the driver and make them feel present and aware with the potential hazard. For example, Schneegass, Pfleging, Broy, Heinrich and Schmidt (2013) “(…) believe that workload cannot easily be assessed in a simulator study”. Indeed, with immersive driving environments the presentation and experience of risky scenarios and bad conditions of visibility when foggy, raining or snowing could be improved (Shahrokhi & Bernard 2004). Immersion is a metaphoric use of the experience of submersion applied to representation, or simulation. The success of immersing the user by presenting an (driving) environment can actually immerse the user is dependent on many factors, e.g. visibility, surround sound and interactive user-input (Nechvatal, 2009).
Furthermore, although many psychological studies have been focused on dual-task scenarios (e.g. Levy & Pashler, 2001; Meyer & Kieras, 1997a, 1997b), there are only few systematical investigations of realistic dual-task scenarios (Salvucci & Taatgen, 2008; Taatgen, 2005). Salvucci (2005) refers to the disregard of the relation to reality and emphasizes particularly ecological validity. That implies more realistic appearing driving environments will help to provide more reliable and valid findings.
Of course, the high-end version of a realistic test environment is a real car driving experiment. Nevertheless, if you are able to conduct one, the early prototyping stage would have been completed already. Real car driving experiments are also difficult to control, manipulate and replicate and thus to standardize. Moreover, by conducting real car driving experiments developers and researchers are strictly limited in (1) the way of manipulating physical characteristics of the vehicle (e.g. car cockpit, position of the monitor) and (2) the number of achievable stages of expressions (e.g. different vehicle types). Finally, if the vehicle or vehicle parts need to be rebuilt or new-built, real car driving experiments end up a lot more time consuming and expensive.
Therefore, one economizing suggestion is the implementation of immersive (driving) environments for early prototyping evaluations, to provide users a more realistic experience. The aim of this research is to combine advantages of driving simulator experiments (e.g. repeatability) with positive effects of immersivity (e.g. presence experience). To create a sense of full immersion, the five senses (sight, sound, touch, smell, taste) must perceive the digital environment to be physically real (Nechvatal, 2009). Immersive technology can perceptually fool the senses through: Panoramic 3D displays (visual), surround sound acoustics (auditory), haptic and force feedback (tactile), smell replication (olfactory), and taste replication (gustation). Due to highly realistic appearing test environments more reliable and valid findings are expected. Moreno and Mayer (2002) postulated, that the more immersive an (driving) environment is, the more realistic perceived by users, because of higher presence experience. Through increasing immersivity more realistic driving simulator experiments could be implemented and due to that fact presence experience can be improved. The level of immersivity is modifiable by manipulating the vehicle or mock- up themselves (e.g. geometry, surfaces, brightness), the driving environment (e.g. representation of real-existing streets) and/or the interaction space between human and vehicle (e.g. sensomotoric in- and output). Any desired type of vehicle and driving scenario is implementable through 3D-visualization software very fast by simple drag`n drop features. Additionally, this immersive evaluation approach enables more complex experimental designs and is characterized by high controllability and changeability. According to that, there is no difficulty to implement multi- factorial experimental designs with several repeated measurement factors (Weber & Wetzel, 2013).
This paper discusses research investigating the influence of different levels of immersivity within a standardized driving environment. Two important influencing factors were used to examine different levels of immersivity: Visual parameters (2D vs. 3D) and auditory parameters (no sound vs. car sound). It is assumed, that these types of immersivity cues can make a significant difference in perception of the environment and presence experience (Nechvatal, 2009). Objective data and subjective user impressions were measured and analyzed.
METHOD
Design The experiment was realized as completely crossed 2x2 within-subjects design to investigate the influence of two immersivity parameters (visual and auditory). As independent variables the visual representation of the driving environment (2D vs. 3D) was adapted on the one hand, on the other hand the auditory representation of driving sound (no sound vs. car sound) was varied. The sample was divided into four groups in order to process the driving task under randomized conditions. Each group started with different conditions: (A) 2D; no sound, (B) 2D; car sound, (C) 3D; no sound and (D) 3D; car sound. Therefore, condition (A) represents a very low immersive condition without any immersivity parameter and condition (D) represents a very high immersive condition with two immersivity parameters. Each group had to pass all four conditions and answer all questionnaires. Objective and subjective data were captured as dependent variables. The following objective data were collected: Driving parameters of the LCT for determining driving performance for each condition, eye-tracking data and results of the SAGAT questions for measuring situational awareness. Subjective dependent variables were assessed via different questionnaires. These constitute subjective workload which was raised on the NASA-TLX, perceived driving performance (PDP) measured by the questionnaire for self-assessment of driving performance, and the subjects’ perceived quality of experience of virtual reality, which was assessed by the questionnaire for Presence and Immersive tendency (PIT) in virtual realities.
Participants The sample was composed of 20 participants (female = 8; male = 12) with an average age of 28.65 years (SD = 5.95). Approximately three-quarters of the subjects were students (N = 16), the remaining four were employed. Three participants were left-handed. One person wore glasses, another wore contact lenses. More than half of the participants (N = 12) were already familiar with the use of driving simulators ("little" = 3, "medium" = 3, "a lot" = 2, "very much" = 4) and eight participants had no experiences with driving simulators. Seven participants had experiences with eye-tracking systems („medium" = 2, "a lot" = 3, "very much" = 2), the remaining 13 participants had never used an eye-tracker before. The experiment took about 75 minutes. The subjects participated voluntarily and received an expense allowance of ten euros. A valid driver's license was required.
User Tasks The primary user task was driving and performing the Daimler Chrysler Lane Change Task (LCT; Mattes, 2003). It is a low-cost and highly validated measure for driver distraction caused by secondary tasks. It was developed by vehicle manufacturers and represents a standardized and ISO-normed tool for detecting driver distraction (ISO, 2008). The LCT comprises driving simulation software and analysis software. The task consists in a sequence of lane change maneuvers while driving with a fixed speed of 60 km/h on a three-lane road. The lane change is displayed on signs on both sides of the road. Once the subject recognizes the instruction on the respective sign in front the appropriate lane change must be executed fast and efficiently to keep deviations from the optimal driving lane at a minimum. One task takes about three minutes. The parameter mean deviation was extracted from the LCT to calculate the deviation of the subjects’ driven lane from the lane given as a reference within the analysis software (the normative model) in meters over the whole track. To perform the LCT simple hardware (PC and game steering wheel) is sufficient. In this study it was controlled via Logitech Driving Force GT force feedback wheel system which included a steering wheel and gas and brake pedal. This was connected to the driving simulator FESTO Airmotion ride. The simulator was merely used as an interface for steering as well as accelerating and braking. (The latter were not part of the driving task but served to interrupt the ride while answering the SAGAT questions). Speed regulation or changing gears was not necessary due to the predetermined constant speed of 60 km/h. The LCT was displayed on a 1,80 m x 1,10 m holobench in front of the driving simulator (see Figure 1).
Figure. 1. Driving simulator and holobench at the VRSC
The situation awareness task was measured by SAGAT (Situation Awareness Global Assessment Technique, Endsley, 1995a) during each LCT condition. The participant was asked to stop once per run at varying times. The screen (driving environment) was turned off and the participant was asked to state the actual lane (1) as well as the previously driven lane (2). Additionally, the participant was asked for a number that was displayed in the right top of the driving environment before (3). After answering the questions the screen was turned back on and the subject completed the LCT. The answers could only be right or wrong, which determined the corresponding values of 1 or 0 as results. To indicate the level of situation awareness the values were added. A higher number represents a higher number of wrong answers and thus less situational awareness. For analysis the number of wrong answers was counted (0-2).
Requirements View and Sound
The driving environment was presented on the Barco TAN Holobench (see Figure 1), a projection table consisting of two orthogonal projection surfaces (each 1,80 m x 1,10 m). For this study, only the vertical screen was used to display the driving environment (three-lane road, signs, background). An active shutter 3D technology allows a stereoscopic (3D) representation of the scene. A projector (controlled by the rendering client) alternately displays the image for the left and the right eye using a video refresh rate of 100 Hz. Shutter glasses worn by the subject synchronously block the respective eye by polarization of the Liquid Christal Display (LCD) glasses. Consequently the image displayed is synchronized with left and right eye image, similarly to the screen with a frequency of 100 Hz. Thus, each eye perceives 50 frames per second, which creates a 3D view for the subject by merging the two images. The synchronization is generated by the computer rendering the LCT. The signal is transmitted to the shutter glasses via infrared transmitter. The change between monoscopic (2D) and stereoscopic (3D) view can be evoked by switching the holobench to active stereo mode. Therefore, shutter glasses need to be turned on/turned off simultaneously.
Car sound was the second parameter, besides 3D view, to increase immersivity of the driving environment. The driving sound was generated automatically by starting the LCT and was reproduced by speakers connected to the LCT computer and holobench. Switching between car sound/ no car sound conditions was realized by turning on and off the speakers.
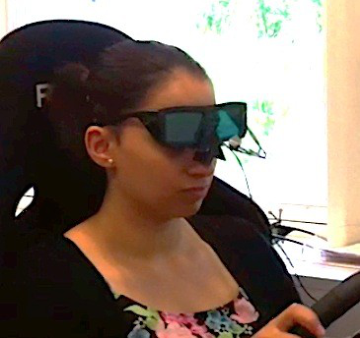
Eye-tracking/ Shutter glasses Visual fixations and eye movements were recorded by Ergoneers’ Dikablis eye-tracking system. Within this study participants had to wear LCD shutter glasses to enable stereoscopic (3D) view. In order to realize the gaze data recording and stereoscopic view at the same time, the participants wore a self-built combination of shutter glasses and eye-tracking system (see Figure 2). Therefore, the camera of the eye-tracking system was attached to the shutter glasses to record eye and pupil movements. For recording the field of vision the video signal from the holobench was used. Therefore, graphic card output of the holobench was connected via an Ergoneers adapter to the Ergoneers laptop. The adapter was specifically designed for this experiment. The video signal provided an image of the depicted scene. The software mapped the eye movement directly to the scene.
A calibration of the eye-tracking system was necessary before each run. Therefore, camera position was adapted by the experimenter and pupil detection was configured using the Dikablis software. Subsequently, within the calibration process the mapping of eye camera images and the image of the scene was executed. The participants were asked to look at each of the four corners on the screen (holobench). The experimenter confirmed every point by clicking on the referenced point within the image of the scene on the PC. The mapping between the image of the eye camera and the image of the scene was adopted by the system. For each run recording of eye-tracking had to be started and stopped manually. From recorded visual fixations and eye movements the parameters duration and number of glances regarding three areas of interest (AOI). By means of the trigger function three AOIs were defined: (1) road, (2) sign on the left and (3) sign on the right. The glances on each AOI were analyzed by the software Dikablis Analysis. Each analyzed sequence started after reaching the start sign of the LCT and ended after passing the last sign. The break to answer the SAGAT questions was not included. Glance durations and frequencies for the three AOIs were recorded and evaluated.
Figure 2. Self-built combination of eye-tracking system and shutter glasses Questionnaires
The German questionnaire for presence and immersive tendency in virtual realities (PIT; by Scheuchenpflug, 2001) Human Aspects of Transportation II (2021) was used to analyze differences regarding user experiences within different immersive environments. It is based on the English Presence Questionnaire (PQ) which measures the presence of subjective experience, as well as the Immersion Tendency Questionnaire (ITQ) for the evaluation of general willingness to empathize with synthetic and virtual environments (Witmer and Singer, 1998). Overall, the immersion experience is determined by means of five dimensions. Three dimensions of subjective presence experience are captured: (1) Spatial presence (21 items), (2) quality of the interface (11 items) and (3) involvement (6 items). Two further dimensions measure the general immersive tendency, i.e. how strongly the subject generally feels involved in the situation: (4) emotional involvement (6 items) and (5) degree of involvement (6 items). Each of the 50 items is ordinally scaled as a Likert scale from 1 ("very much / very good / very real / ... " ) to 7 ("very little / very poor / very unreal / ..."). For analysis means of the respective items were summarized for each dimension. The average was calculated. Some items had to be inverted.
For the assessment of subjective workload the NASA Task Load Index (NASA-TLX) was used (Hart & Staveland, 1988). The standardized questionnaire represents a subjective measure for mental workload regarding the evaluation of human-machine systems. The multi-dimensional rating procedure is based on six subscales. The following dimensions are assessed: (1) Mental demand, (2) physical demand, (3) temporal demand (perceived time pressure), (4) task performance (satisfaction with level of task performance, i.e. tracking, speed and spacing), (5) effort (overall mental and physical strain while driving) and (6) stress (perceived stress while driving). The items were ratio scaled on a continuous scale from "low" to "high" (0 to 100).
The self-assessment questionnaire for perceived driving performance (PDP) investigates how the participants estimate their own performance in the driving task within the respective level of immersivity. It comprises eight items: (1) Tracking, (2) maintaining speed, (3) spacing, (4) concentration, (5) overall judgment of maintaining speed, distance and tracking, (6) subjective sense of security, (7) relaxation and (8) general impression. The items are interval scaled ranging from "very good" (5) to "very poor" (0). For the evaluation the average was calculated using all scores. The higher the value, the better the self-estimated driving performance. Values can range between 0 (worst self-estimated driving performance) and 40 (best self-estimated driving performance).
The Simulator Sickness Questionnaire (SSQ; Kennedy, Lane, Berbaum & Lilienthal, 1993) captures the subjects’ current condition as a checklist before and after the experiment. Therefore 16 symptoms of nausea and dizziness were queried: General unease/ discomfort, fatigue, headache, eyestrain, difficulties concerning visual acuity, increased salivation, transpiration, sickness/ emesis, difficulties in concentrating, feeling of pressure in the head, blurred vision, dizziness (with eyes open) dizziness (with eyes closed), balance disturbances, upset stomach, belching. The subjective condition was entered on an ordinal scale as a four-point Likert scale from (1) "not at all" to (4) "severe". For the evaluation the scores of all items were added. The higher the value, the worse the condition of the subject. The lowest value of 16 (each item scores one point) represents the best condition and the value of 46 represents the worst condition (4 points for each item).
Procedure The study was performed in the VRSC (Virtual Reality Solution Center) at the Fraunhofer IPK Berlin. After the welcome by the experimenter and the registering of demographic data by means of a demographic questionnaire, the current condition of the subject was determined via SSQ. It was followed by a test drive in a 2D environment without shutter glasses or eye-tracking to make the subject feel comfortable with the LCT, the test environment and driving simulator. After the test drive the calibration of the eye-tracking system was executed. Thereafter, the participants had to pass the LCT under randomized driving conditions (levels of immersivity). The eye-tracking system was recalibrated before each run. In order to assess the situation awareness each run was interrupted once for SAGAT. After completion of each run (condition) the questionnaires NASA-TLX, questionnaire for self-assessment of driving performance and the questionnaire for presence and immersive tendency in virtual realities were completed by the participants. After the last run the subjects’ condition was re-interrogated by SSQ. After receiving the expense allowance the participants were released.
RESULTS
In the following the results of the study are presented. Data from the four experimental conditions were analyzed regarding dependent variables. To investigate statistically significant differences weighted scores were compared across conditions using a within-subjects repeated measures analysis of variances (ANOVA) with an alpha level of .05. For the pairwise comparison a Bonferroni correction with SPSS-adjusted significance level of .05 and corresponding paired t-tests were used. Afterwards, relationships between dependent variables were examined using Pearson`s correlation coefficient. IBM SPSS v21.0 was used in the statistical analysis. Every assumption for an ANOVA was met in the reported data.
Driving Performance The scores of different driving parameters of the LCT were analyzed and compared across conditions using a within-subjects repeated measure ANOVA with a Greenhouse-Geisser correction.
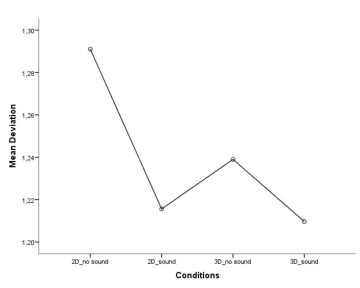
No significant differences for driving performance were found. The four conditions did not differ significantly from each other. Indeed, lowest lane deviation was found for the most immersive condition (M=1.21; SD=.39) and highest lane deviation for the least immersive condition, 2D without sound (M=1.29; SD=.35).
Figure 3. Driving performance LCT by immersive conditions
Eye-tracking Data Unfortunately, due to recording failures and implementation issues eye-tracking data from 10 participants had to be removed later. For the remaining 10 participants the overall mean times in seconds and the number of glances on the road and signs (right, left) for each of the conditions were compared across conditions using within-subjects repeated measures ANOVA with Greenhouse-Geisser corrections. No significant differences for eye-tracking data were found, though.
SAGAT The scores of the SAGAT data were compared across conditions using a within-subjects repeated measures ANOVA with a Greenhouse-Geisser correction. No significant differences were found among all conditions.
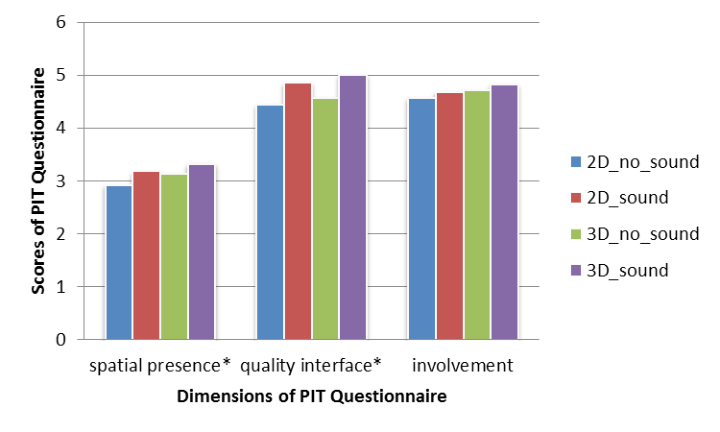
Presence and Immersive Tendency The scores of the PIT questionnaire within virtual environments were compared across conditions using within- subjects repeated measures ANOVA with Greenhouse-Geisser corrections. The questionnaire consists of three dimensions (a) spatial presence, (b) quality of the interface and (c) involvement. Figure 4 shows differences between the immersive conditions regarding the three dimensions of the presence and immersivity questionnaire.
Figure 4. PIT scores by immersive conditions
The ANOVA revealed a statistically significant difference in ratings of spatial presence among the four immersive conditions, F(3, 57) = 3.13, p = < .05, n²part = .141. Significant pairwise comparisons regarding spatial presence were found between the two extreme immersive conditions (2D; no sound vs. 3D; car sound), F(1, 19) = 5.71, p = < .05, n²part = .231.
Corresponding planned t-tests showed that spatial presence was rated significantly minor within low immersive condition, 2D no sound (M=2.92; SD=.84) compared to the high immersive condition, 3D car sound (M=3.32; SD=.83), t(19) = -2.39, p = .027.
The ANOVA revealed also a statistically significant difference in ratings of quality of interface among the four immersive conditions, F(3, 57) = 4.17, p = < .05, n²part = .180. Significant pairwise comparisons regarding quality of interface were found between the two extreme immersive conditions (2D; no sound vs. 3D; car sound), F(1, 19) = 7.63, p = < .05, n²part = .287.
Corresponding planned t-tests showed that quality of interface was rated significantly minor within low immersive condition, 2D no sound (M=4.44; SD=.71) compared to the high immersive condition, 3D car sound (M=5.0; SD=.66), t(19) = -2.90, p = .009.
No significant differences were present in the involvement data. Indeed, Figure 4 shows that the overall involvement rating for each immersive condition showed the highest scores for the most immersive condition (M=4.82; SD=.93) and the lowest scores for the least immersive one (M=4.57; SD=.86).
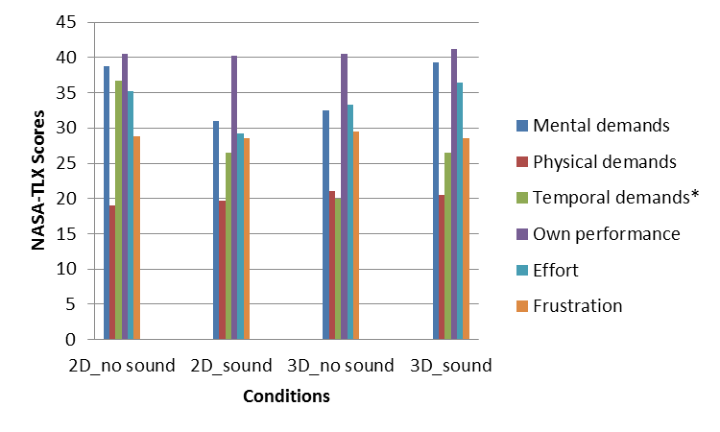
Cognitive Workload Weighted NASA-TLX scores were compared across conditions using a within-subjects repeated measures ANOVA with a with Greenhouse-Geisser correction. Figure 5 shows differences between the immersive conditions regarding the six dimensions of the NASA-TLX questionnaire.
The ANOVA revealed a statistically significant difference in ratings of temporal demands among the four immersive conditions, F(3, 57) = 4.07, p = < .05, n²part = .176. Figure 5 shows highest scores for the least immersive condition, 2D no sound (M=36.75; SD=27.35), compared to 2D with car sound (M=26.5; SD=21.34), 3D no sound (M=20.00; SD=21.70) and 3D with car sound (M=26.5; SD=26.71). Significant pairwise comparisons regarding temporal demands were found for 2D; no sound and 3D; car sound, F(1, 19) = 5.41, p = < .05, n²part = .222.
No other significant differences were present in the workload data. Indeed, the overall rating showed highest total workload scores for the low immersive condition (M=33.17; SD=18.62) and lowest scores for the high immersive condition (M=32.08; SD=18.50).
Figure 5. NASA-TLX scores by immersive conditions
Perceived Driving Performance The scores of the self-assessment questionnaire PDP were compared across conditions using a within-subjects repeated measures ANOVA with a Greenhouse-Geisser correction. No significant differences were found among all conditions. Indeed, the overall rating of perceived driving performance showed highest scores for the most immersive condition (M=5.03; SD=.67) and lowest scores for the least immersive condition (M=4.82; SD=.86).
Simulator Sickness Questionnaire The scores of the SSQ were compared using a within-subjects repeated measures ANOVA with Greenhouse-Geisser corrections. The ANOVA revealed a statistically significant difference in the pre-post comparison, F(1, 19) = 5.71, p = < .05, n²part = .231. Participants` ratings of physical condition on the four-point Likert-like scale were higher after the driving experiment (M=21.0; SD=5.59) compared to their arrival (M=19.0; SD=3.73)
Relationship of Dependent Variables In an attempt to investigate underlying relationships in the study, a few post hoc correlations test were performed. When investigating the relationship between driving performance and subjective impressions, a significant negative correlation was found for NASA-TLX and lane deviation within immersive driving environments (2D; car sound), r = -.54, p < .05 and condition 3D; no sound, r = -.52, p < .001. It can be assumed that there is a relationship between cognitive workload and driving performance. Although, it doesn`t mean that the higher spatial presence the more demanding, because the most and least immersive condition did not reveal a positive correlation.
Another negative correlation was found between NASA-TLX and PDP for each of the four immersive driving conditions. See Table 1 for exact results. These correlations suggest that as the better the own driving performance perceived the less demanding the driving task.
A similar positive correlation was found between NASA-TLX and spatial presence (PIT) for each immersive condition, except the most immersive one. The results are listed in Table 1. It can be assumed that there is a relationship between cognitive workload and increasing spatial presence. Although, it doesn`t mean that the higher spatial presence the more demanding, because the most immersive condition didn`t reveal a positive correlation. No other significant correlations were found.
Table 1: Correlations between subjective data NASA- TLX_2D_no_sound NASA- TLX_2D_sound NASA- TLX_3D_no_sound
Table available in the original PDF paper.
NASA- TLX_3D_sound
PDP_2D_no_sound -.64** PDP_2D_sound -.67**
PDP_3D_no_sound -.58** PDP_3D_sound -.80**
PIT_2D_no_sound .49* PIT_2D_sound .51*
PIT_3D_no_sound .52* PIT_3D_sound n.s.
Equation reproduced from the original PDF.
DISCUSSION
In this paper, we investigated the influence of different levels of immersivity within a standardized driving task environment. Therefore, visual parameters (2D vs. 3D) and auditory parameters (no sound vs. car sound) were used to examine different levels of immersivity. These types of parameters can make a significant difference in perception of the (driving) environment and presence experience. Objective data and subjective user impressions were measured and analyzed.
The results showed no significant differences in driving performance (LCT) between the four immersive conditions. But it`s a matter of common knowledge, that it is sometimes difficult to find (significant) differences with the LCT, particularly without a secondary task, even if the LCT has a high internal validity compared to more realistic driving simulations. Although, no significant differences for driving performance were found, overall lowest lane deviation was measured for the most immersive condition (3D; car sound) and highest lane deviation for the least immersive one (2D; no sound). That could indicate that highly immersive driving conditions influence driving performance positively. Furthermore, second best performance regarding lane deviation was found for condition 2D with car sound. That could indicate that the factor sound exerts higher influence on driving performance than 3D view. Additionally, when investigating the relationship between driving performance and subjective impressions, a significant negative correlation was found for NASA-TLX and lane deviation within high immersive driving environment (3D; car sound). This reflects a decrease in perceived cognitive workload when driving within more immersive environments. Immersivity decreased lane deviation (not significant) and cognitive workload (significant) and therefore supports the implementation of 3D view and car sound regarding evaluations of human- vehicle-interaction. Although this study did not find significant differences between conditions and driving performance, future studies may find these results with more participants and a secondary task.
Unfortunately, due to recording failures and implementation issues eye-tracking data from 10 participants had to be removed later. For the remaining 10 participants no significant differences for eye-tracking data were found, though. Bugs and inaccuracies probably occurred, because of self-built shutter/eye-tracking glasses. Lack of eye-tracking recording was a limitation of this study that should be considered in future research with more professional equipment.
The results showed significant differences regarding PIT questionnaire between the four immersive conditions. Two of the three dimensions (spatial presence, quality of the interface, involvement) revealed a statistically significant difference among the four immersive conditions. Spatial Presence and quality of the interface were constantly higher rated for the most immersive condition and lowest for the least immersive one. Although, the dimension involvement did not show a significant difference the overall rating was the same, too. It corroborates our expectation, the more immersive the test environment, the higher the users’ presence experience. Immersivity increased presence and immersive tendency and supports the implementation of 3D view and car sound regarding evaluations of human-vehicle-interaction, too. In the end, this result is the most important finding of this experiment, because higher presence experience leads to more reliable and valid findings in the context of human-vehicle- interaction evaluations.
The data of the 20 participants showed a significant difference between the four immersive conditions regarding the NASA-TLX questionnaire in ratings of temporal demands. Highest scores were found for the least immersive condition (2D; no sound) and lowest for the most immersive one (3D; car sound). It indicates, the more immersive the driving environment, the less the temporal demand perceived while driving. No other significant differences regarding workload dimensions were present in the data. Indeed, the overall rating showed highest total workload scores for the low immersive condition and lowest workload scores for the high immersive condition. Further research is necessary to examine these effects while driving and interacting with in-car devices. Furthermore, a positive correlation was found between NASA-TLX and spatial presence (PIT) for each immersive condition, except the most immersive one. It can be assumed that there is a relationship between cognitive workload and increasing spatial presence. Although, it does not mean the higher spatial presence, the more demanding, because the most immersive condition did not reveal a positive correlation. To sum up, immersivity decreased subjective workload (temporal demand) and therefore supports the implementation of 3D view and car sound regarding evaluations of human-vehicle-interaction. Future studies may find additional significant results regarding other workload dimensions with more participants and a secondary task.
Indeed, no significant differences were found for the self-assessment questionnaire PDP, the overall rating of perceived driving performance showed highest scores for the most immersive condition (3D; car sound) and lowest scores for the least immersive condition (2D; no sound), too. Furthermore, investigating the relationship between NASA-TLX and perceived driving performance a negative correlation was found for each of the four immersive driving conditions. These correlations suggest that the better the own perceived driving performance the less demanding the driving task. Further research is necessary to examine these effects while driving and interacting with in-car devices. Future studies may find significant results with more participants and a secondary task.
Regarding SAGAT data no statistical differences were found, perhaps due to realization issues. Because of the current methodical procedure, without presenting further distracting stimuli or secondary tasks, the SAGAT questions were probably too easy to answer. Lack of significance in this experiment may have also been due to the low number of questions that the participants had to answer regarding their actual situational awareness. Future studies may find significant differences regarding situation awareness between different immersive conditions with more situational questions and a secondary task.
CONCLUSIONS
The outcomes lead us to conclude that high immersive driving environments (3D; car sound) increase impressions of reality for driving tasks compared to conventional driving simulator environments. Both objective and subjective data provide evidence to suggest a more aware and realistic perception of the driving situation. Therefore, higher immersive driving environments are suggested regarding prospective human-vehicle-interaction evaluations.
Future research will also investigate different secondary tasks and only two immersive conditions. The results of this study suggest that a low immersive condition is characterized by 2D view without car sound and a high immersive condition by 3D view with car sound. Although both immersive parameters are necessary to characterize a low or high immersive condition, it can be assumed that the factor sound exerts higher influence on perceived immersivity than 3D view. One possible explanation could be that even if 3D view is turned off participants are still able to see the driving environment, while if sound is turned off participants can´t hear anything. This means with the current experiment visual parameters are only improved whereas sound parameters vary effectively between on and off.
Thus, with only two immersive conditions (low and high) a longer time could be spent driving with different secondary tasks and the effect of practice could be investigated.
Further research is also necessary due to other immersive influencing factors, such as haptic or tactile feedback, which may also affect presence experience and immersivity positively.
REFERENCES
Breuer, J., Bengler, K., Heinrich, C. & Reichelt, W. (2003). Development of advanced driver attention metrics (ADAM). In H.
Strasser, K. Kluth, H. Rausch, & H. Bubb (Eds.). Quality of Work and Products in Enterprises of the Future. Proceedings of the 50th – Anniversary Conference of the GfA and the XVII Annual ISOES Conference in Munich, 2003, pp. 37-40. Stuttgart: Ergonomia. Endsley, M. R. (1995a). Measurement of situation awareness in dynamic systems. Human Factors, 37(1), 65-84. Hart, S. & Staveland, L. (1988). Development of NASA-TLX (Task Load Index): Results of empirical and theoretical research.
In P. Hancock & N. Meshkati (Eds.), Human mental workload, pp. 139-183. Amsterdam: North Holland. ISO, (2008). Road vehicles – Ergonomic aspects of transport information and control systems - Simulated lane change test to assess driver distraction. ISO/TC 22/SC 13 N WG8 N579, DIS 26022. Kennedy, R. S., Lane, N. E., Berbaum, K. S., & Lilienthal, M. G. (1993). Simulator Sickness Questionnaire (SSQ): An Enhanced
Method for Quantifying Simulator Sickness. International Journal of Aviation Psychology, 3 (3), 203-220. Knappe, G., Keinath, A. & Meinecke, C. (2006). Empfehlungen für die Bestimmung der Spurhaltegüte im Kontext der Fahrsimulation. In M. R.K. Baumann, S. Leuchter, & L. Urbas (Hrsg.). MMI-Interaktiv, Aufmerksamkeit und Situation Awareness im Fahrzeug, 11, 2006, ISSN 1439-7854, 3-13. Levy, J., & Pashler, H. (2001). Is dual-task slowing instruction dependent? Journal of Experimental Psychology: Human
Perception and Performance, 27, 4, 862-869. Mattes, S. (2003). The lane change task as a tool for driver distraction evaluation. In H. Strasser, H. Rausch & H. Bubb (Eds.), Quality of work and products in enterprises of the future. Stuttgart: Ergonomia Verlag. Mayhew, D. J. (1999). The Usability Engineering Lifecycle. San Francisco: Morgan-Kaufmann. Mehler, B., Reimer, B. & Zec, M. (2012). Defining workload in the context of driver state detection and hmi evaluation. In Proc.
AutomotiveUI`12, pages 187-191, New York, NY, USA, 2012. ACM. Meyer, D. E., & Kieras, D. E. (1997a). A computational theory of executive cognitive processes and multiple-task performance: Part 1. Basic mechanisms. Psychological Review, 104, 3-65. Meyer, D. E., & Kieras, D. E. (1997b). A computational theory of executive cognitive processes and multiple-task performance:
Part 2. Accounts of psychological refractory period phenomena. Psychological Review, 104, 749-791. Moreno, R. & Mayer, R.E. (2002). Learning Science in Virtual Reality Multimedia Environments: Role of Methods and Media.
Journal of Educational Psychology, 94(3), 598-610. Nechvatal, J. (2009). Immersive Ideals / Critical Distances.LAP Lambert Academic Publishing. 2009, pp. 48-60. Salvucci, D. D. (2005) A multitaksing general executive for compound continuous tasks. Cognitive Science, 29, 457-492. Salvucci, D. D. & Taatgen, N. A. (2008). Threaded Cognition: An Integrated Theory of Concurrent Multitasking. Psychological Review, 2008, Vol. 115, No. 1, 101–130. Scheuchenpflug, R. (2001). Measuring presence in virtual environments. In M.J. Smith, G. Salvendy, & M. R. Kasdorf (Eds.).
HCI International 2001, pp. 56-58. New Orleans: HCI International. Schindler, J., Kelsch J., Heesen, M., Dziennus, M., Temme G. & Baumann, M. (2013). A Collaborative Approach for the Preparation of Co-operative Multi-User Driving Scenarios. 10. Berliner Werkstatt Mensch-Maschine-Systeme, 10.-12. Okt. 2013, Berlin, Germany. Schneegass, S.; Pfleging, B.; Broy, N.; Heinrich, F.; Schmidt, A. (2013). A Data Set of Real World Driving to Assess Driver
Workload. In:Proceedings of the 5th International Conference on Automotive User Interfaces and Interactive Vehicular Applications, pp. 150-157. Shahrokhi, M. & Bernard, A. (2004). A fuzzy approach for definition of dangerous zone in industrial systems. In: 2004 IEEE International Conference on Systems, Man, & Cybernetics, Vol. 7, 6318-6324. Taatgen, N.A. (2005). Modeling parallelization and speed improvement in skill acquisition: from dual tasks to complex dynamic
skills. Cognitive Science, 29, 421-455. Weber, L. & Wetzel, I. (2013). Eignung unterschiedlicher Versuchsumgebungen für die Erfassung der wahrgenommenen Qualität von Flugzeugkabinen. In E. Brandenburg, L. Doria, A. Gross, T. Günzler & H. Smieszek (Hrsg.). Grundlagen und Anwendungen der Mensch-Maschine-Interaktion. 10. Berliner Werkstatt Mensch-Maschine-Systeme, ZMMS Spektrum Band 34, 2013 (S. 259-263). VDI-Verlag. Wittmer, B.G. & Singer, M.J. (1998). Measuring presence in virtual environments: A presence questionnaire. Presence:
Teleoperators and Virtual Environments, 7, 225-240.
LISTED IN THE AHFE DIGITAL BOOKSTORE CATALOGUE
Explore the complete digital volume
Advances in Human Aspects of Transportation: Part II
Read this individual research paper free through the original publisher, or explore the full digital proceedings book.
ISBN 978-1-4951-2098-5
Explore this ISBN in the AHFE Bookstore ↗Listed in the July 2026 bookstore catalogue; search by ISBN to confirm current availability · Digital book purchase optional