Christian Wullems, Narelle Haworth, Gregoire Larue, Andrew Haines, Matthew Gildersleeve (2022). Effects of Driver Familiarity and Prolonged or Intermittent Right-Side Failure on Level Crossing Safety. In: Advances in Human Aspects of Transportation: Part III. AHFE Open Access, vol. 17. https://doi.org/10.54941/ahfe100748
This paper investigates the adverse effects of familiarity and human factors issues associated with the reliability of low-cost warning devices at level crossings. The driving simulator study featured a repetitive, low workload, monotonous driving task in which there were no failures of the level crossing (control) or prolonged or intermittent right-side failures (where the device reverts to a safe failure mode). The results of the experiment provided mixed support for the familiarity hypothesis. Four of the 23 participants collided with the train when it first appeared on trial 10 but safety margins increased from the first train to the next presentation of a train (trial 12). Contrary to expectations, the safety margins decreased with repeated right-side failure only for the intermittent condition. The limited head movement data showed that participants in the prolonged failure condition were more likely to turn their head to check for trains in the right-side failure trials than in earlier trials where there was no signal and no train. Few control participants turned their head to check for trains when no signal was presented. This research highlights the need to consider repetitive tasks and workload in experimental design and accident investigation at railway level crossings.
In Australia many collisions between road vehicles and trains occur at level crossings with passive controls but the cost of replacing these with traditional active crossings is prohibitive. Often the driver is a local resident who has driven through the crossing many times but rarely encountered a train (ITSR, 2011; Wigglesworth, 2001). The current paper investigates this familiarity effect as well as other human factors issues associated with implementing low-cost level crossing warning devices (LCLCWDs). LCLCWDs have often attracted criticism regarding their ability to meet safety and reliability targets. While wrong-side failure (e.g. undetected train) can potentially result in catastrophic outcomes and therefore should be addressed accordingly, the potential outcomes of prolonged or intermittent right-side failure (i.e. failures that cause the warning device to revert to a safe failure mode, where the flashing lights are activated and boom barriers lowered where applicable) are not as apparent.
System Reliability and Driver Behavior
The target environment for deployment of LCLCWDs includes regional areas where maintenance and timely restoration can be significant challenges, potentially resulting in a system remaining in a failure state for prolonged periods of time. When a level crossing warning device enters a state of right-side failure, the warning device activates the signals and closes boom gates (if present). From a purely technical and engineering perspective, this is safer (more restrictive state) than the previous operating state, as road vehicles are no longer permitted to traverse the crossing (Wullems, Nikandros and Nelson-Furnell, 2013). According to the Queensland road rules (Office of the Queensland Parliamentary Counsel, 2009), a driver must not enter a level crossing if warning lights are operating or bells are ringing, or a gate, boom or barrier is closed, closing or opening. The problem with this assumption is that humans cannot be expected to wait indefinitely and will inevitably engage in risk-taking behavior – i.e. driving past flashing lights or around boom gates, putting occupants of both cars and trains at risk.
To further complicate matters, in Australia, the train approach warning is indistinguishable to road users from the failure mode, effectively creating a situation of mode-confusion. Frequent or prolonged right-side failures may further influence driver performance, causing road users to lose confidence in the warning. This potentially facilitates the creation of mental models of when the train approach warning is credible based on other factors such as known train schedules, resulting in a mismatch between real risk and perceived risk. Such biases can result in a transference effect, where performance at other level crossings in the network may also be affected.
Evidence of these effects can be seen anecdotally in the Rungoo level crossing accident (DTMR, 2009), where level crossings in right-side failures may have contributed to a loss of confidence that the flashing lights indicated the approach of a train. A simulation study conducted by the Volpe National Transportation Systems Center for the Federal Railway Administration (FRA) scrutinized the influence of active warning reliability on road user actions at conventional rail level crossings (Gil, Multer and Yeh, 2007). The study included right-side and wrong-side failure and showed that a decline in warning reliability led to diminished motorist compliance. The authors suggested that correcting the motorist perception of warning reliability might prevent such risk taking.
Understanding the human factors aspects of frequent and prolonged right-side failure is important in determining appropriate system performance targets for LCLCWDs.
Expectation and Familiarity It is a consistent finding that familiarity with level crossings is associated with violations and accidents. An early analysis of coronial records for motor vehicle fatalities at Victorian level crossings found that 86% of the fatalities occurred within one mile of their home address (Wigglesworth, 2001) and more recently, 57% of vehicle–train collisions in NSW during 2000–2010 occurred within 10 km of the drivers’ home postcodes (ITSR, 2011). Similar findings have been reported in US studies (Abraham, Datta and Datta, 1998; NTSB 1998b). For example, among drivers observed to commit violations at 37 level crossings in Michigan, 68% reported that they used the specific crossing at least four times a week, with another 19% using the crossing two to four times a week (Abraham, Datta and Datta, 1998). Drivers who use level crossings regularly come to develop expectations about train frequency, and the likelihood of encountering a train. In cases when drivers do not encounter a train on repeated occasions, they may come to develop low expectations about trains crossing. Several reports have shown that drivers generally have low expectations about encountering trains at level crossings (Dolan, 1996). Specifically, 75% of 500 Minnesotan drivers surveyed reported ‘rarely’ expecting to see a train at a crossing, even though 66% of the sample reported encountering level crossings at least five times a week (Dolan, 1996).
Low expectancy is more likely to occur for drivers who frequently use passive crossings, given that these crossings have low daily train volumes (Cairney, 2003). Drivers may even come to know train timetables for crossings with low train volumes, and may only visually search for a train at times consistent with their mental timetable (a factor which was attributed to one of the fatalities analysed in Wigglesworth, 1979). Thus, greater familiarity with level crossings can reduce the perception of risk, and encourage drivers to engage in greater risk-taking behavior.
Research aims and hypotheses The research reported here aimed to investigate how familiarity and how the temporal pattern of right-side failure at railway level crossings influence driver behavior at railway level crossings. It was hypothesized that (1) driver safety margins would decrease with repeated encounters of a level crossing with no warning signal activated and no train, (2) driver safety margins would decrease with repeated right-side failures, (3) prolonged right-side failure would produce a larger decrease in the safety margin variable than intermittent right-side failure because drivers in Human Aspects of Transportation III (2022) the prolonged failure condition would learn that the warning is unreliable, and (4) that safety margin will increase after participants observe a train at the railway level crossing.
METHOD
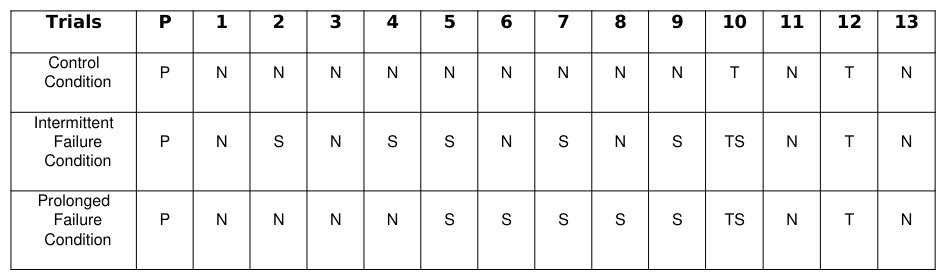
Experimental Design Given the importance for the research hypotheses of experience on previous trials, a between-groups design was necessary for the study. Each participant was assigned to one of three conditions: control (C), intermittent failure (I) or prolonged failure (P). Table 1 outlines the scenarios presented to participants in each condition, for each of the 14 trials that were completed within one experimental session of two hours. On some trials there was no warning activated and no train at the crossing (N), other trials included the warning active with no train (right-side failure) (S), the warning active with a train approaching and the warning does not extinguish after the train has passed the crossing (TS), and the warning active with a train approaching and the warning extinguished 3 seconds after the train passed the crossing (T).
Table 1: Experimental Trials for each condition Trials P 1 2 3 4 5 6 7 8 9 10 11 12 13
Participants in all conditions were exposed to trains at the crossing on only two of the 13 trials during the experimental session. The two trials containing trains approaching the crossing were on the same trial number (10 and 12). Within the two conditions that involved right-side failure (all except control condition), the warning was activated when no train was present on 5 occasions (55% failure rate for trials 1-9). No train arrived on 6 trials and in the failure conditions (prolonged and intermittent) the first trial with a train arrival (trial 10) concludes with a warning failure (warning does not extinguish after the train passes the crossing). The schedule of right-side failure for the (I) and (P) conditions was manipulated so both experienced 5 failures before a train arrived on trial 10. During the control condition the warning maintained 100% reliability (only activated twice for the actual train arrivals).
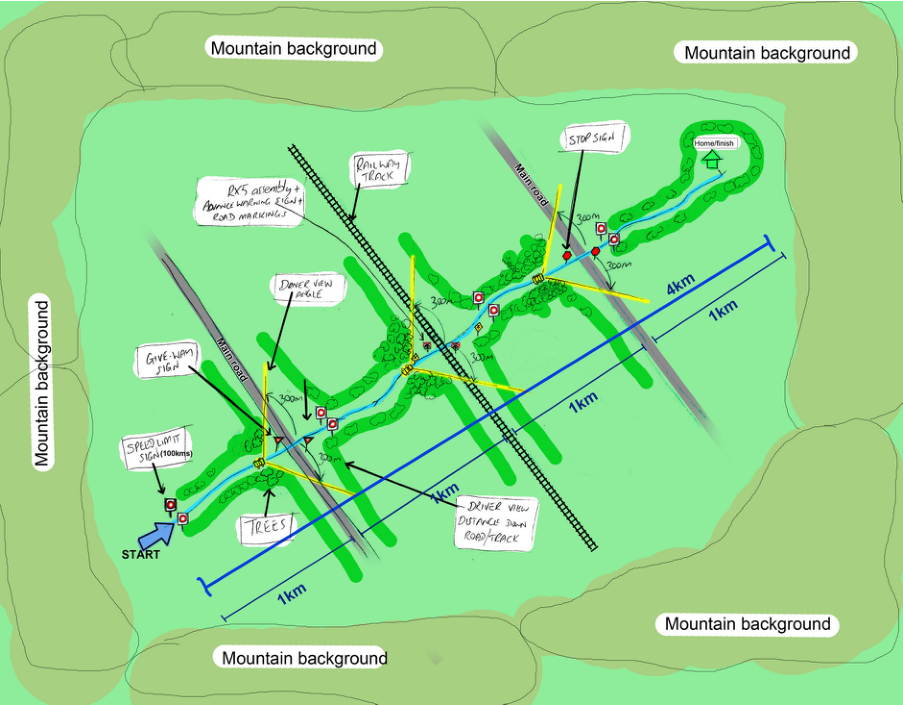
Simulation Scenario The monotonous rural highway scenario contained one level railway level crossing, one stop sign and one give way sign and there were no other cars (Figure 1). A rural house near the end of the road served as a nominal destination. At the end of the experimental road there was a house which participants were asked to park outside. The bitumen road consisted of two lanes. The distance between the start of the road and the give way intersection was 1km, the distance between the give way intersection and railway level crossing was 1km, the distance between the railway level crossing and the stop sign intersection was 1km and the distance between the stop sign intersection and the house was 1km. The backdrop to the road included heavy forestry on either side of the road, which was cleared for the required sighting distances at each intersection and the level crossing. Mountains could be seen in the distance. The level crossing contained only one track. There were also 4 speed limit signs (100km/hr) spread out through the road layout. The road/crossing or intersection interfaces were 90 degrees. The road gradient was level throughout with slight curves to the left and right. Participants typically took around 4-5 minutes to traverse depending upon their average speed, their compliance with two road intersection signals and their interaction with the railway crossing signal.
Figure 1. Experimental road layout and features.
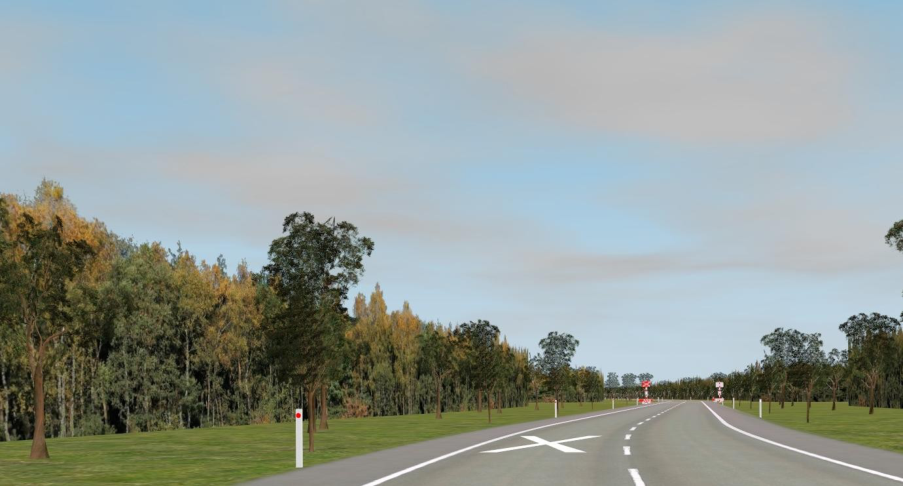
The level crossing characteristics simulated those at Rungoo in Northern Queensland, Australia where a fatal collision between the Cairns Tilt Train and a B-double truck occurred on 27 November 2008. Specific features of that location were replicated in the simulation, especially the limited ability to view approaching trains at any distance due to obscuring trees (see Figure 2). All railway crossing related signage and road markings in the simulation complied with the Manual of uniform traffic control devices (Queensland) – Part 7: Railway crossings (Queensland Government, 2013b). The 100 km/h speed limit signs and the STOP and GIVE WAY signs complied with the appropriate standards (Queensland Government, 2013a).
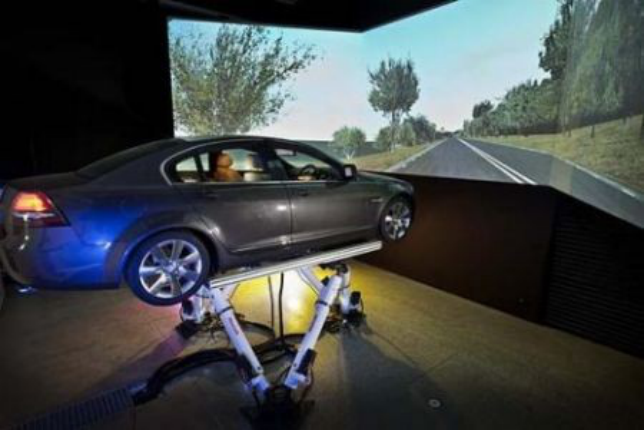
Driving Simulator The CARRS-Q advanced driving simulator consists of a complete Holden VE Calais vehicle body, with working vehicle controls and instruments, to provide a realistic control cabin and the ability to include up to 5 vehicle occupants (maximum 300kg total weight) during a simulation (see Figure 3). The vehicle body is mounted on a Bosch Rexroth E-Motion-1500 Electric Motion System, providing motion with 6 degrees of freedom (surge +716,- 602mm, sway +/-603mm, heave +407,-422mm, roll +/-27º, pitch +27,-24º, yaw +/-39º) and capable of supporting a combined load of up to 1500kg.
Figure 2. Central portion of the driver’s view on approach to the simulated railway crossing.
OKTAL’s SCANeRTM Studio v1.0 simulation software provides simulator control and data acquisition. The simulator is operated by six HP Z800 workstations, each with an XFX GeForce GTX285 1Gb graphics card, running components of the SCANeRTM simulation software in a distributed fashion. The forward images are provided by three Projection Design F22 sx+ 2100 Lumens projectors, projecting onto three flat 4m x 3m screens at 1400x1050 resolution to give a forward field of view of approximately 180° horizontal and 45° vertical. Three 8- inch LCD screens replace the side and central mirrors, each displaying a simulated rear view at an 800x600 resolution. Simulated vehicle and external sounds are provided by using the vehicle’s existing stereo speaker system and an additional subwoofer, which also supports Doppler effect.
Figure 3. CARRSQ Advanced Driving Simulator.
Research Participants Potential participants were approached using an invitation letter on the Queensland University of Technology classified advertising website. Interested participants contacted the research team and were given an Information Sheet that outlined the purpose of the study, what the participant was requested to do, and the confidential and voluntary nature of the participation. In total, 23 participants (13 male, 10 female) aged from 19 to 49 (mean 24) participated in the experiment. 9 participants were allocated to prolonged failure condition, 8 were allocated to the baseline condition and 6 were allocated to the intermittent failure condition. Participants were required to have a driving licence to take part, and all participants reported having no disability that would influence the driving task. Participants were asked to ensure they received 6-8hrs sleep the prior night before testing. Participants were not informed of the expected results or hypotheses. The recruitment flyer stated the purpose of the research was to investigate driver behaviors in rural road environments. The Queensland University of Technology Human Research Ethics Committee approved the study, and written informed consent was obtained from all participants prior to data collection.
Experimental Procedures The experimental session typically lasted 120 minutes: 75 minutes collecting data related to the driving task; 30 minutes setting up the equipment and explaining the tasks; and 15 minutes for introductions, questionnaires and debriefing. Participants were instructed on the driving task and the controls (steering wheel, accelerator and braking pedal) while seated in the simulator. Participants were told their task was to drive along the straight road ahead of them until they reached a white house on the left side of the road. Participants were provided practice driving for 5 minutes which involved driving from the house to the starting position of the experiment (reverse of experimental task). Participants were instructed to drive as they normally would in a similar situation. The practice drive had no trains, warning activations at the crossing or any other traffic.
After completing the familiarization session, in compliance with standard operating procedures for the simulator (approved by QUT‘s Human Research Ethics Committee), participants completed a simulator motion sickness questionnaire (Brooks et al., 2010) to evaluate whether they were able to continue with the experiment. If the participant decided to continue with participation, the Facelab equipment was calibrated to the participants’ facial characteristics. Once this was completed, the simulation scenario began.
The 13 trials of the designed route were completed in the session with a short (30-60 seconds) break in between. During the break, participants sat in the car and completed a task workload questionnaire (NASA TLX) about the previous trial. After the 13 trial scenarios were completed, participants completed the motion sickness questionnaire, Driver Behavior Questionnaire, Demographics and Driving Experience questionnaire and were asked if they had any other comments about the drive. Participants received $50 at the end of the experimental session to thank them for their participation.
Data Analysis Data collected from the driving simulator was imported into a relational database using a software tool developed specifically for this purpose due to the large quantities of data (several gigabytes of instrumentation data) that needed to be cleaned and processed. Database queries were used to clean the data and create a set of views for data analysis including parameters such as safety margin. IBM SPSS Statistics 21 software was used to support the data analysis via a connection to the database.
The safety margin value (meters) was calculated from an emergency braking curve, with the assumption being that any negative value would result in a crash if a train were at the level crossing. From the simulator data file, the speed (m/s) for each participant on each trial was found when the car was 50m from the railway level crossing. The required braking distance at 50m from the crossing was then calculated using the speed the car was travelling at 50m from the crossing with the application of emergency braking. The safety margin was then found by subtracting the braking distance of that participant on a specific trial from 50m. A positive value indicated the participant would stop the vehicle before the railway level crossing and a negative value indicated the degree to which the vehicle would not be able to stop at the level crossing. The calculations are shown below.
Equation reproduced from the original PDF.
2−u 2) 2a ) Where s is the safety margin in meters, v is the initial velocity in m/sec, u is the final velocity in m/sec and a is the acceleration in m/sec2. Deceleration values for a car were obtained from the American Association of State Highway and Transportation Officials Green book (AASHTO p111, 2004), which defines hard braking (emergency) as 4.5 m/sec2 and comfortable braking as 3.4 m/sec2.
Facelab data was unable to be extracted for all participants for a range of technical reasons, and particularly because the experimental procedure involved looking to the side screens and the eyes were then outside of the range of the Facelab system that was currently implemented in the simulator. However, accurate head movement data could be extracted for 4 participants in the control group and 5 participants in the prolonged condition.
RESULTS
Figure 4 below displays the mean safety margin values for each condition on trials 1-13. On trials 1-9 a negative safety margin value (indicating that a crash would have occurred if a train was present) was recorded for 11 of the 54 drives in the intermittent condition and 2 of the 81 drives in the prolonged condition. A one way ANOVA to determine if there were any pre-existing differences between the groups found no significant differences in the safety margin variable between the three groups for trial 1, F (2, 20) = 1.524, p = 0.242. Given that the scenarios on trials 1-4 are the same (no train, no warning) for the control and prolonged failure group, an additional analysis was conducted to investigate whether there were pre-existing differences between these groups. The analyses showed that the difference approached significance, F (1, 14) = 3.456, p = 0.084.
40
30
20
10
Baseline Prolonged Intermittent
Safety Margin
0
1 2 3 4 5 6 7 8 9 10 11 12 13
-10
-20
Trial
Figure 4. Mean Safety Margin Values for each condition on trials 1-13 To examine whether safety margins decreased with repeated encounters with no signal activated and no train (Hypothesis 1), the trend from trial 1 to trial 9 for the control group was examined. As Figure 4 indicates, there was no significant linear component in the ANOVA, F (1, 7) = 0.064, p = 0.445 (or any significant difference among the
Figure available in the original PDF paper.
means, F (1, 7) = 0.001, p = 0.975). An additional analysis examined safety margins on trials 1 to 4 for the prolonged failure condition, which all had no signal activated and no train. The ANOVA showed that the significant linear component in the ANOVA, F (3, 21) = 4.302, p = 0.077 approached significance (although there was no overall difference F (3, 21) = 1.142, p = 0.355).
To examine whether safety margins decreased with repeated right-side failure (Hypothesis 2), a two-way ANOVA compared the safety margins on trials 5, 7 and 9 for the intermittent and prolonged failure condition (right-side failure occurred on each of these trials). To test whether the decrease in safety margin was greater for prolonged than intermittent right-side failure (Hypothesis 3), an interaction term was included in this analysis. The repeated- measures ANOVA showed that there was no significant difference in the safety across trials 5, 7 and 9, F (2, 26) = 0.224, p = 0.801, but the interaction term approached significance, F (2, 26) = 3.223, p = 0.056 (see Figure 5). There was also no overall difference in safety margins between the two conditions, F (1, 13) = 1.898, p = 0.198.
30
27.164 28.312
25
21.923
20
19.132
15
Prolonged
10.575
Intermittent
10
Safety Margin
5.757
5
5 7 9 0
Trial
Figure 5. Mean safety margins for the prolonged and intermittent conditions for trials 5, 7, and 9.
Figure available in the original PDF paper.
To examine whether the safety margin increased after participants observed a train at the railway level crossing (Hypothesis 4), several analyses were conducted. For the control condition, the safety margin on trial 11 was compared with the safety margins on trials 7 to 9 (all of these trials had no signal and no train) using a repeated measures ANOVA. There was no difference in safety margins among these trials, F (2, 14) = 0.286, p = 0.756. Testing of Hypothesis 4 for the intermittent and prolonged failure conditions was complicated by the lack of equivalent scenarios in the trials preceding trial 10. However, for the intermittent condition, it was possible to compare the safety margins on trials 9 and 11. Again, there was no difference in safety margins among these trials, F (1, 5) = 0.174, p = 0.693. A paired T-Test showed a significant increase in the mean safety margin across all groups from trial 10 (the first time a warning is activated and a train appears, mean = 24.45) to trial 12 (the second time this occurs, mean = 33.29), t (22) = -2.172, p = 0.041.
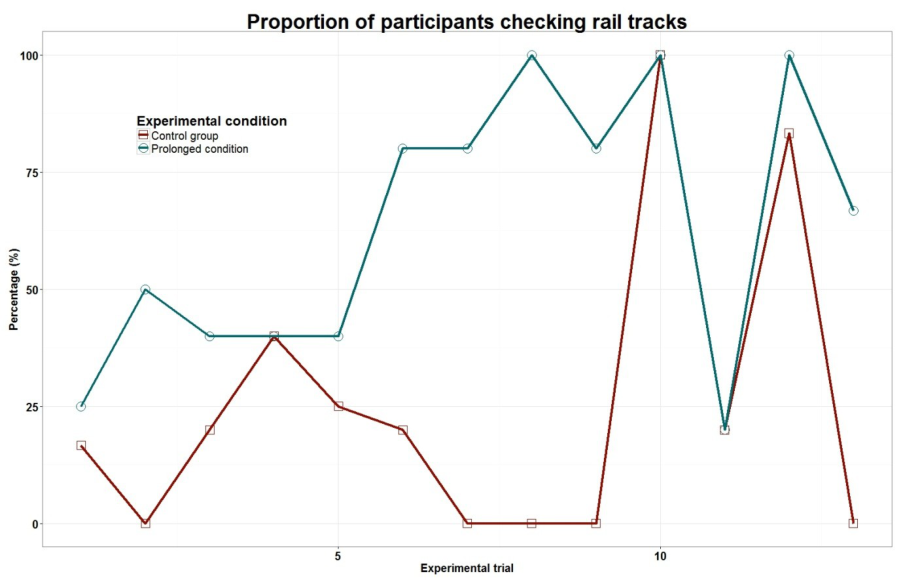
The limited head movement data that was able to be extracted showed that the proportions of participants in the control and prolonged conditions who checked the rail tracks was similar in Trial 5 (the first right-side failure for the prolonged group) but the proportions of participants in the prolonged condition who checked the rail tracks increased following right-side failure (see Figure 6). This data, while limited, suggests that drivers do modify their gaze behavior following right-side failure.
Figure 6. Percentages of participants who checked rail tracks according to head movement data.
DISCUSSION
This research sought to study the effects of familiarity and compare two types of right-side failure to better understand the likely safety impacts of low cost level crossing warning devices. The simulation scenario was based on the circumstances of a real collision. Informal observation of the participants as they drove, using an in car camera, confirmed the effective immersion of the participants in the simulation. Almost no participants were able to stifle the onset of yawning after driving 5 or more of the trials, due to the onset of monotony. The observed expressions on the faces of participants when they realized a collision with the train was inevitable clearly indicated a high degree of realism had been achieved.
Familiarity A key aspect of this research was to replicate a state of familiarity in the manner the driving task was executed by the participant. The design involved a repetitive, low workload, monotonous task that is characteristic of the rural environments in which low cost level crossings are installed. The results of the experiment provided some support for the familiarity hypothesis, with a trend towards decreases in the safety margins across the first four trials (in which there was no signal activation and no train) among participants in the prolonged failure condition. However, participants in the control condition had very low safety margins throughout the trials on which there was no train and showed no decrease over trials (no familiarity effect). However, four out of 23 participants collided with a train at the railway level crossing on trial 10, suggesting that the experiment was able to induce false environmental expectations in the participants. Given the relatively small sample size, these initial results suggest that the experimental manipulation was appropriate and that repeating the experiment with a larger sample is merited. It is possible that stronger familiarity effects would be observed if the number of trials was increased, and this should be considered in later studies.
Prolonged versus intermittent right-side failure Upon inspection, the patterns of mean safety margins across trials seem to be quite different but the relatively small sample sizes and potential pre-existing differences between participants in the three groups meant that many analyses did not reach statistical significance.
The hypothesized decrease in safety margins with repeated right-side failure (Hypothesis 2) was only observed for the intermittent condition. This was the opposite to the pattern of results proposed in Hypothesis 3. It may be that prolonged failure would make drivers more certain that the device was unreliable and therefore more cautious. This is supported by the limited head movement data that showed that the proportion of participants in the prolonged failure group who turned their head to check for trains was higher in the right-side failure trials than in earlier trials where there was no signal and no train. Interestingly, the proportion of control participants who turned their head to check for trains was very low when no signal was presented. In conjunction with their low safety margins, this suggests that they would have been at high risk of colliding with a train had wrong-side failure occurred.
The final hypothesis tested in this study was that the safety margin would increase after participants observed a train at the railway level crossing. This was not supported by comparisons of safety margins on the trial immediately after the first appearance of a train (trial 11, no signal, no train) compared earlier trials with no signal and no train (trials 7 and 9 for the control condition and trial 9 for the intermittent condition). However, it was reassuring to note that the safety margin increased from the first train (trial 10) to the next presentation of a train (trial 12).
Despite the challenge of possible pre-existing between-group differences that was experienced in this experiment, it is still considered necessary to utilize a between-group design to study the issues associated with right-side failure. A promising approach for the future would be to conduct a multi-session experiment in which all participants experience many trials in which there is no signal activation and no train and then allocate participants to groups in a way that the groups are matched on their safety margins in the first session.
Limitations Constraints on simulator availability resulted in the experiment having fewer participants than originally anticipated. While many of the findings were statistically significant, suggesting that sample size was adequate, the small group sizes meant that some findings might not be generalizable to a wider population. Therefore extending the research to a larger sample would be recommended.
The results presented here focus on safety margin as the prime performance measure. While it was chosen for its real-world relevance in that negative values represent crashes, a large range of other measures could be calculated from the simulator data and further examination of other useful measures may prove fruitful.
Technical issues related to projector screen resolution, color and brightness contrasts meant that the driver in the simulator must be closer to the crossing than in reality to clearly observe whether the signal was active. Observations of simulator runs suggested that some drivers were able to traverse the crossing multiple times without appearing to notice that the signal was active. This may have led drivers in the prolonged failure group to be more likely to observe that the signal was active even if they missed seeing it on the previous run. Further experimentation with better measurement of eye gaze may be needed to assess the extent to which this occurs.
CONCLUSIONS
Overall, these results have a number of theoretical and practical implications for road and rail safety research. In particular, these results provide an example of an environmental context that can be used to investigate the factors that can lead to risk taking by road users at railway level crossings. Secondly, the results demonstrate that road user expectations of the railway crossing environment can be influenced by the type of right-side failure. Further analyses will examine other measures collected in the simulator such as eye gaze to better understand how drivers are responding to these two types of right-side failure. Nevertheless, this research highlights the need to consider repetitive tasks and workload in experimental design and accident investigation at railway level crossings.
REFERENCES
Abraham, J., Datta, T., Datta, S. (1998). Driver Behavior at Rail-Highway Crossings. Transportation Research Record: Journal of the Transportation Research Board, 1648(-1), 28-34. American Association of State Highway and Transportation Officials (2004). A Policy on Geometric Design of Highways and
Streets (AASHTO Green Book). Washington D.C. USA. Brooks, J. O., Goodenough, R. R., Crisler, M. C., Klein, N. D., Alley, R. L., Koon, B. L., et al. (2010). Simulator sickness during driving simulation studies. Accident Analysis & Prevention, 42(3), 788-796. Cairney, P. (2003). Prospects for improving the conspicuity of trains at passive railway crossings. Canberra: Australian Transport
Safety Bureau. Department for Transport Energy and Infrastructure. (2006). Low Cost Level Crossing Warning Device Comparative Field Trial, Walkerville, South Australia. Department of Transport and Main Roads. (2009). Final Report - Rail Safety Investigation - QT2459: Fatal Collision between the
Cairns Tilt Train and B-Double Truck, Rungoo Level Crossing, Queensland, 27 November 2008. Brisbane, Australia Dolan, L. (1996). Are Minnesotans Aware of the Dangers of Railroad Crossings? Diane Publishing Company. Gil, M., Multer, J., Yeh, M. (2007). Effects of Active Warning Reliability on Motorist Compliance at Highway-Railroad Grade Crossings. Volpe National Transportation Systems Center. Federal Railroad Adminstration. Independent Transport Safety Regulator. (2011). Level crossing accidents in Australia. Transport Safety Bulletin.
http://www.transportregulator.nsw.gov.au/rail/publications/transport-safety-bulletins/level-crossing-accidents-in-australia/ view National Transportation Safety Board. (1998). Safety study: Safety at passive grade crossing volume 1: Analysis. Safety at Passive Grade Crossing. National Transportation Safety Board, Washington. Office of the Queensland Parliamentary Counsel (2009), Queensland Transport Operations (Road User Management – Road
Rules) Regulation, Queensland, Australia. Queensland Government (2013a). Manual of Uniform Traffic Control Devices - Part 2: Traffic Control Devices for General Use.
Department of Transport and Main Roads, Brisbane, 2013. Queensland Government (2013b). Manual of Uniform Traffic Control Devices - Part 7: Railway Crossings. Department of Transport and Main Roads, Brisbane, 2013. Roop, S. S., Roco, C.E., Olson, L.E., Zimmer, R.A. (2005). An Analysis of Low-Cost Active Warning Devices for Highway-Rail
Grade Crossings. . Texas A&M University, Texas. Silmon, J., Roberts, C. (2010). Using functional analysis to determine the requirements for changes to critical systems: Railway level crossing case study. Reliability Engineering & System Safety, 95(3), 216-225. Wigglesworth. (1979). The epidemiology of road-rail crossing accidents in Victoria, Australia. Journal of Safety Research, 11(4),
162-171. Wigglesworth. (2001). A human factors commentary on innovations at railroad-highway grade crossings in Australia. Journal of Safety Research, 32(3), 309-312. Wullems, C., Nikandros, G., Nelson-Furnell, P. (2013). How safe is safe enough? A socio-technical view of low-cost level
crossing safety. Paper presented at the Institution of Railway Signal Engineers Australasia AGM and Technical Meeting, Glenelg, South Australia
LISTED IN THE AHFE DIGITAL BOOKSTORE CATALOGUE
Explore the complete digital volume
Advances in Human Aspects of Transportation: Part III
Read this individual research paper free through the original publisher, or explore the full digital proceedings book.
ISBN 978-1-4951-2099-2
Explore this ISBN in the AHFE Bookstore ↗Listed in the July 2026 bookstore catalogue; search by ISBN to confirm current availability · Digital book purchase optional