Andreas Gregoriadesa, Christos Floridesa, Smaragda Christodoulou, Maria Pampakab, Harris Michaelc (2022). Requirements Discovery for Smart Driver Assistive Technology Through Simulation. In: Advances in Human Aspects of Transportation: Part III. AHFE Open Access, vol. 17. https://doi.org/10.54941/ahfe100753
Smart driver assistive technologies (DAT) have been developed to alleviate accident risk by either reducing driver workload or assessing driver attentiveness. Such systems aim to draw drivers’ attention on critical cues that improve their decision making. In some cases, these systems can have a negative effect to the driver due to the extra information load they incur to the user. Therefore, in addition to specifying the functional requirements there is an urgent need to address the human requirements of such system which include workload and SA. The first step in improving drivers’ SA is to enhance driver’s capability of perceiving and interpreting information from traffic and environmental cues. These constitute Level 1 and 2 of the SA model. However, most DAT systems, facilitate high (i.e. level 3) SA for navigation, but as highlighted earlier, they might decrease drivers’ attention and hence, level 1 SA due to secondary task execution that undermines attention to primary task of operational or tactical driving behaviours (e.g. braking, lane changing, gap acceptance etc.). To that end, three important issues need to be addressed prior to departing in any DAT development. These are: the identification of the driver’s information needs that could enhance SA and the specification of a DAT feedback metaphor (type of feedback and appropriate time for issuing warnings) that will support those needs without impairing driver attention. These constitute the requirements discovery phase. The third step in the process is the evaluation of the effect of a prospective DAT on traffic safety. This however, is a complex process and in most cases it’s only feasible once a prototype of the system is available. Developing a prototype however, is time consuming and expensive. An alternative is thus the development of a simulation model that will mimic the system’s functional and non-functional requirements. This enables testing of candidate system designs and the evaluation of their effect on human requirements prior to implementation. In this study we address the requirements discovery phase through experimental analysis of drivers’ needs that are expressed in terms of workload and SA.
Human factors and requirements have a lot to share, however few studies apply human factors knowledge to requirements engineering. Most requirements are specified for people, either in the sense that requirements reflect users’ goals, or that requirements specify people’s cognitive workload or SA while interacting within a sociotechnical system. We define in-vehicle system requirements as goals that the sociotechnical system as a whole (driver, vehicle, and infrastructure) should achieve independently of how they are implemented by software, Human Aspects of Transportation III (2022) https://openaccess.cms-conferences.org/#/publications/book/978-1-4951-2099-2 machines or human actions. An important non-functional human requirement in such systems which is in direct relation to SA and workload is functional allocation, the process of deciding whether system-level requirements should be automated, partially automated or specified as manual procedures. The rationale for choosing functional requirements as fully automated software or as collaborative functions for user decision support is not explicitly addressed in requirements engineering methods (Gregoriades et al., 2004). While non-functional requirements such as performance and maintainability are considered for software functions and non-functional requirements, requirements for people, such as driver SA and workload, have received less attention in systems engineering. However, such requirements have been proven very significant in preventing system failure which is articulated as accident occurrence. Therefore, the systematic analysis of these requirements prior to any system implementation is considered vital. The main problem in evaluating these requirements is the need of an implemented hardware- software system prior to making an analysis of the holistic system performance under a number of test scenarios that involve people and tasks. This however is expensive and risky, hence the use of virtual reality (VR). One of the most important applications of VR technology has been using virtual prototypes for requirements analysis (Stone, 2001). The appeal of using VR is saving the cost of physical mock-ups and prototypes, especially for complex systems.
People requirements are specified based on the limited cognitive and physical capabilities of humans. These capabilities are put to the test when processing dynamically changing information during driving. If these capabilities are reached then this in effect increases the likelihood of committing an error due to high workload. Workload, however, is directly related to SA and the link between the two has been established in the literature (Salvendy et al, 2012). Situation awareness defines the process of perceiving information (level 1) from the environment, comprehending its meaning (level 2) and projecting it into the future (level 3). If the information that is perceived is increased then people tend to prioritise which increases the risk of an incorrect comprehension. In traffic safety, SA constitutes a major critical factor, since it provides the driver with the ability to anticipate events given perceived driving and environmental conditions.
Road accidents have become a daily hazard in Europe and worldwide (Konstantopoulos et al., 2010). According to Eksler et al. (2008), around 1.2 million fatalities and more than 50 million injuries occur in roads worldwide every year. Given the current trends, the accident fatalities are projected to become the second most common cause of death in 2020 if no drastic measures are taken. To that end, EU set the goal to reduce road fatalities and injuries by 50% by 2020. In addition to fatalities, traffic accidents result in high economic losses due to traffic congestions which in turn lead to a wide variety of adverse consequences such as, traffic delays, supply chain interruptions, travel time unreliability, increased noise pollution, as well as deterioration of air quality.
Road accidents are caused by many factors, and the problem is approached from different perspectives. Eksler et al. (2008) argue that accidents are influenced by demographic, infrastructural and political factors. At the other end of the spectrum human factors experts associate accidents with human error. Human error is defined as the human activity or absence of activity that leads to incorrect system behaviour (Hollnagel et al., 2004). It may occur due to human beings’ physical, perceptual and cognitive limitations (Montella et al., 2010) and is directly related to visual attention (Konstantopoulos et al., 2010) and workload (Gregoriades et al., 2010) which in turn affect situation awareness. The analysis of accidents accounting for human error can be carried out from two perspectives: the designers’ and the users’. The former addresses the system designing flaws that hinder human activity due to usability problems whereas the latter analyzes internal cognitive processes of human operators to identify decision making bottlenecks caused by reduced situational awareness (Endsley, 1995) induced by increased workload. According to Bailey (1996), workload is defined as the demand placed upon people which could be a behavioural response to events, communication and interactions among humans or between humans and technology, or humans and the environment. High levels of workload degrade the driver's concentration, information processing and decision making, leading to increased errors (Williams, 1988; Endlsey, 1995; Norman, 1988).
The focus of this study is on the identification of the requirements of smart situation enhancement systems requirements based on drivers’ workload analysis. The study is conducted using local drivers in Cyprus using a driving simulator that was designed for this purpose. The analysis is based on phenotype driver behaviour data collected through experiments in controlled settings. The workload assessment method used is task-performance based. In particular, this investigation focuses on the impact of different types of driver distractions, such as advertisements, and music on the primary task (driving) and the investigation of the contribution of smart in-vehicle situation enhancement systems.
Human Aspects of Transportation III (2022) https://openaccess.cms-conferences.org/#/publications/book/978-1-4951-2099-2
The use of a driving simulator in studies, like this, is inevitable, firstly due to ethical reasons and secondly, since controlling infrastructural parameters in the real world requires huge investment in time and money (Davenne et al., 2012) which is usually prohibitive. Moreover, ruling out confounding effects to examine the influence of control measures on workload is very difficult in field experiments. Driving simulators provide the researcher with a powerful tool to test driving behaviour under controlled settings. Apart from the usually high cost of the simulator, outsourcing of experiments to analyze driving behavior using native users is difficult, if not impossible in some cases, due to the large number of subjects needed for reliable results. On the other hand, low cost driving simulators do not provide a sufficient level of realism to analyse human factors. Unrealistic conditions may affect the driving behaviour which effectively could influence the validity of the experimental study. The method proposed herein demonstrates the design of a driving simulator that exploits 3D modeling tools in a module-based approach to promote realism and interactive 3D representation of road networks. The approach simplifies the process of implementing 3D road infrastructure models through the utilization of reusable modules that represent different in- vehicle technologies or infrastructural components. This simplifies the process of designing/modifying the simulation model by reusing model constructs in a plug and play fashion, which enables the analyst to easily design a range of experimental conditions to evaluate assumptions and hypotheses from different perspectives.
The paper is organized as follows: related work is firstly reviewed, followed by the presentation of the driving simulator design along with the design of the experiment. The results are then presented followed by the specification of the smart situation enhancement systems requirements. The paper concludes with a brief discussion of the implications.
RELATED WORK
Requirements implicit in the relationship between people and systems are addressed by requirements engineering modelling languages such as i*, which represent social relationships such as authority, capability and commitment (Mylopoulos et al, 1999). Requirements can be discovered by inspecting the dependencies between agents, goals and soft goals in i*. However, there is little active support for analysing requirements related to human performance.
Road accidents are usually attributed to human error (Gregoriades et al., 2010) that is induced from low SA caused by increased workload. Humans have limited information processing abilities and must rely on three fallible mental functions: perception, attention and memory (Fuller, 2002). Drivers commit errors because a situation exceeds the limitations of one or more of these three functions. At the same time, the bandwidth of their information processing capabilities declines with age. Human factors in driving are usually distinguished in those addressing driving behaviour and driving task. Task-related factors concern information perception, analysis, decision making and action at the operational level while behaviour-related factors concern the tactical and strategic level. The driving task requires information processing and motor skills, which improve with time while, driving behaviour refers to the style of driving that is not necessarily time-dependent. Driving behaviour is manifested by phenotype behaviours such as speed, gap acceptance and lane changing while the primary driving task is supported or hindered by secondary tasks induced by visual, tactile and auditory information.
Drivers’ information processing needs increase with distractions from endogenous and/or exogenous parameters. Exogenous parameters relate to the environment, the vehicle, the road infrastructure and the traffic conditions, whilst endogenous parameters include, but are not limited to, passenger distractions, noise, mobile phones, and use of in-vehicle information systems (Young et al., 2003). According to Miller (1996), people can process seven (plus or minus two) discrete information chunks at a given point in time. This approximates the boundary of our cognitive capacity in terms of memory. Therefore, increased demand for cognitive resources may result in drivers failing to attend to critical information on the road. Humans, as information processing systems, have a number of information flow channels (visual, auditory, tactile) processing various information sources (e.g. a navigation system display, the forward view through the windscreen) of varied bandwidths (e.g. high-density traffic will require a higher sampling rate than low-density traffic). Our cognitive capacity is limited, and in return there is an upper threshold to the amount of information we can process per second and channel (Gregoriades et al., 2007, 2010). Therefore, we tend to share our attention among a few information sources. An overloaded driver is less likely to deal effectively with an unexpected event. Fuller (2002; 2005) also expresses accident risk as a function of the driver’s cognitive resources and task-demand in the driver-road system.
The link between overloading and driver distraction is established within the existing literature, (e.g. Dingus et al., 2006; Jamson et al., 2004; Gregoriades et al., 2010). Distraction in driving is a frequently reported cause of road Human Aspects of Transportation III (2022) https://openaccess.cms-conferences.org/#/publications/book/978-1-4951-2099-2 accidents. According to Dingus et al. (2006), distractions contribute to 78% of accidents and to 65% near-crashes. Distractions can emerge from outside or inside the car. While, much research has investigated in-car distractions (Jamson et al., 2004), relatively little work has been reported for exogenous distractions emerging from outside the car (Young et al., 2003). Roadside advertising billboards are one of the many distractions, which could pose a crucial risk for road safety. The evidence that accident risk increases with roadside advertising is increasing, with estimates making advertisements responsible for up to 10% of all road traffic accidents. According to Young et al. (2009) roadside advertising adversely affects lateral control which is one manifestation of driver overloading. In the same vein, visual search reaction times increase with distractors (Holohan, 1978). Hence, distracted drivers take longer to react to stimulus. This consequently yields support to the claim that drivers’ visual attention is attracted by advertisements (Horberry et al., 2004). This increases significantly the risk of accident in the case that the driver’s visual workload is already compromised. As a result, the driver may fail to sufficiently attend to the needs of the primary task which is driving. Driver phenotype behaviours associated with workload include, but are not limited to, the following: lane deviation, number of lane departures, lane departure durations and speed deviation. Hence, monitoring these phenotypes can give a good estimation of driver workload. In our case we assess lane deviations. Another driver distraction is listening to music while driving. This is one of the most common auditory stimuli that drivers are exposed to. Listening to music is often a habitual behaviour and is perceived as helping drivers to easily pass the time. Therefore drivers do not tend to perceive music as a distraction that could impair their driving performance (Dibben, 2007). The literature, however, points to the fact that music affects driving style more when the driving conditions are complex. This is mainly articulated in peripheral vision which in effect reduces drivers’ situation awareness. Research on the influence of music on driving behaviour yielded contradictory results. Music, on one hand, positively impacts driving behaviour by soothing people's emotions (Mackenzie, 2004) and hence easing drivers’ aggression. On the other hand, there is evidence (Kazak, 2009) that listening to music while driving may distract drivers' attention and concentration, both of which are necessary preconditions for safe driving. McKenzie (2004) highlights that more than 25% of traffic accidents occur due to distractions caused by music. Certain qualities of music can interact with the driving task (North, 1999). Hence, listening to music and engaging in a concurrent task negatively influences cognitive load, since both compete for the same limited cognitive resources. In addition, listening to music results in an intense emotional experience that leads to a change in heart and breathing rates. This in turn could cause aggressive driving behaviour (Wark et al., 2002). Moreover, the combination of music and driving may result in erratic, and possibly dangerous, driving behaviour (Dibben et al., 2007). Dalton (2007) states that even though music impairs driving performance, it is still unknown which elements of music affect driving performance.
Driver distractions, as explained, can emerge from either outside (billboards) or inside the car (music). Despite the isolated analyses of individual distracters, limited efforts have been made to investigate the combined effect of both endogenous and exogenous distractions on workload. Therefore, it is important to investigate the joint effect of both types of distractions on driver behaviour and accident probability. This work contributes to fill in this gap through the empirical analysis of the effect of distractions on driving behaviour and accident risk using native road users. This in effect acts as the foundation based on which future smart situation enhancement systems is specified. Currently in vehicle driver assistive technologies include: adaptive cruise control, collision notification, driver monitoring, traffic signal recognition, night vision, lane departure warning systems and blind spot monitoring. The use of local users tailors the analysis using native driving behaviours that could vary in different contexts. The analysis is based on data collected during an experiment of phenotype driver behaviour using a driving simulator. In particular, this investigation focuses on the impact of different types of driver distractions such as advertisements and music along a critical point of a road network in Cyprus. The use of a driving simulator is inevitable for such type of experiments because of ethical reasons and due to the fact that the control of parameters in the real world requires prohibitive investment in time and money (Davenne et al., 2012). Moreover, to rule out confounding effects it is necessary to control influences to human error that are irrelevant to the study. This, however, is very difficult in field experiments. Therefore the use of a driving simulator provides the researcher with a powerful tool to test driving behaviour under controlled settings (Gregoriades et al, 2013).
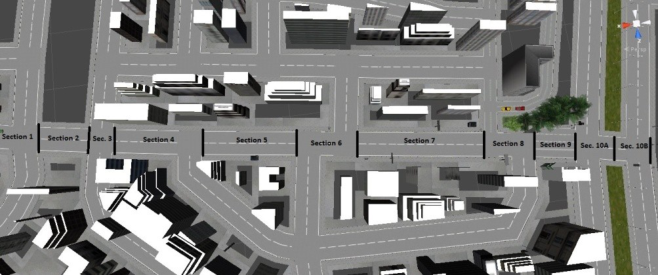
DESIGNING THE DRIVING SIMULATOR The first part of this work involved the design and development of a modular driving simulator that would enable the analysis of traffic conditions and driving behaviours using native users. Given these needs it was imperative that the method for designing the simulator and its inherent models should have been generic, utilizing libraries of Human Aspects of Transportation III (2022) https://openaccess.cms-conferences.org/#/publications/book/978-1-4951-2099-2 components representing assets that make up the driving conditions and infrastructure in Cyprus. Therefore, the design and development of the driving simulator utilized the following software packages to enhance the quality and reduce implementation time: Unity 3D game engine, City Engine, Autodesk Maya, and Tree[d]. Unity is a 3D game engine software application that enables the development of 3D computer games and interactive virtual environments. It has a powerful rendering with a complete set of intuitive tools and rapid workflows to create interactive 3D content. The Unity 3D game development ecosystem was chosen, mainly because it homes a built-in physics engine useful for animating vehicle manoeuvring. Unity 3D comes with a combined functionality that enables changing the graphical environment either using an editor or by manipulating it directly in graphical view. It also provides the designer with the ability to define behaviours through a powerful scripting language. In our case JavaScript scripting was used to define the interactivity between the user and assets of the simulator. The first challenge in the design of the simulator was the modelling of the road network. To achieve this we extracted a section of the Nicosia road network from OpenStreetMap by cropping the area of interest using a polygon on the map. Subsequently the extracted XML file was imported into the CityEngine application, a 3D procedural modelling software application, specializing in the generation of 3D urban environments through the manipulation of objects and existing GIS data. In our case City Engine was used to manipulate the XML file from OpenStreetMaps and the conversion of its 2D format into 3D using CGA Shape Grammar. Through the use of the grammar, the tool’s codes were adjusted accordingly until the required result was achieved. The final model was exported into fbx format that is recognized by Unity 3D (Figure 1).
Figure 1. The GIS model of the black spot (top) and its realization in the 3D driving simulator, with the road divided into sections 1-10b (bottom) Autodesk Maya graphics software was then utilized for 3D modelling and animation, as it provides a comprehensive feature-set for 3D computer animation, modelling, rendering, and compositing on a highly extensible production platform. Maya was utilized for the development of the vehicles and other assets (e.g. traffic lights, advertisement billboards) that have been imported into the game engine. After the development of the city model, the next step involved the specification of the static and dynamic models. These refer to the traffic lights, street lamps, street signs, the traffic signs, road stakes and advertising billboards in Unity 3D. For advertising billboards a dynamic model has been used to refer to animated advertisements. These models were designed in Autodesk Maya. For all the 3D models used in the simulator, attention was paid to keep the geometric complexity relatively low, in order to allow the simulator to be running in high frame rates. Additional car assets have been imported in the simulator through car models, from digital libraries, to provide variety. The selection of the car models was based on car types and brands currently used in Cyprus, in order to enhance the realism factor of the simulator (figure 3). The imported car models were modified accordingly to abide with the driving regulations of the Cypriot authorities. For the development of the surrounding environment and vegetation, the tree[d] software was used as it specializes in trees design. The final part for the test scenario was the specification of the routing of traffic. Maya software was utilized, for this task, to create car movements as overlay animation. Car wheels were manipulated using MEL scripting language (i.e. the scripting language of Expression Editor) to make them rotate according to speed, in order to be
Human Aspects of Transportation III (2022) https://openaccess.cms-conferences.org/#/publications/book/978-1-4951-2099-2 more realistic. The movements of cars were specified through Motion Path. The vehicle paths specified were based on a preliminary analysis of traffic routing on the selected black spot. The time distribution of accidents at the black spot was used to pinpoint the most critical time on the selected black spot. This was necessary to replicate the traffic conditions when the majority of the accidents occur.
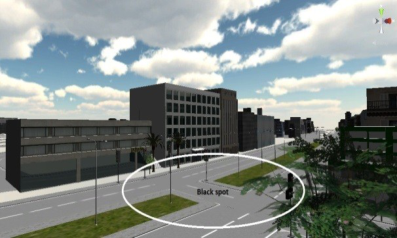
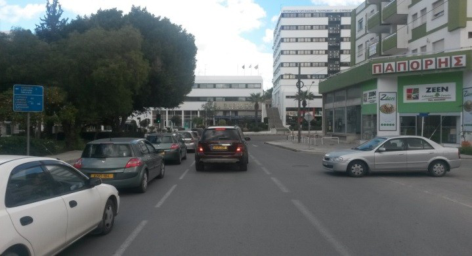
Figure 2. Screenshots of the virtual road design in UnityFigure 3. Real photo of the black spot under study that verifies the similarity of the real and immersive environment shown in figure 2 and 4
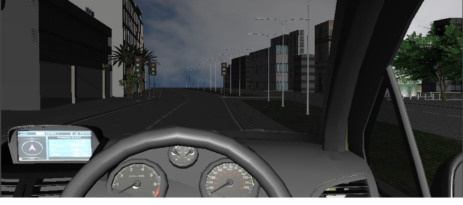
The final part of the simulator design was the development of the functionality that would enable the interactivity between the user and the simulator. This is realised in Unit through JavaScripting. Upon completion, the user was able to drive the vehicle in the designed environment, by controlling its direction and speed using a steering wheel and pedals. A screenshot of the simulator's user interface from the driver’s perspective is depicted in Figure 4.
Figure 4. The interface of the developed driving simulator with an animated advert on the right hand side
RESEARCH DESIGN The aim of this study was to specify the design requirements of candidate smart in-vehicle situation awareness enhancement system design. To achieve this, two experimental conditions (i.e. roadside advertising billboards and in-vehicle music) were examined at an accident black spot (Figure 2) in Nicosia-Cyprus to evaluate that drivers’ workload and consequently SA were at acceptable levels. In essence, the human requirement that was validated stated that the drivers should maintain satisfactory level of situation awareness throughout the experiment. SA was assessed based on phenotype driver behaviours such as lateral deviations and failure to recall important information
Human Aspects of Transportation III (2022) https://openaccess.cms-conferences.org/#/publications/book/978-1-4951-2099-2 of primary task after the experiment. To investigate these aspects it was imperative to design and develop the driving simulator and the corresponding infrastructure model as illustrated in the previous section. Using this simulator, the research design then employed an experimental evaluation to test the effects of roadside advertising billboards and in-vehicle music. Participants drove a pre-specified route in the designed road network both with and without billboards and in-vehicle music at a major intersection that has been identified by the police as a safety critical point. The music used in the vehicle during the second condition had a pop genre with upbeat rhythm. The driving scenario used, included a number of slow vehicles preceding the host vehicle. This aimed to test the driving style of users under such situations and in combination with the experimental conditions. Prior to the experiment, participants were familiarized with the simulator and briefed of the task they had to perform. The road network used for simulator training was different from the model used during the experiment. Each participant had to complete a set of four scenarios to cover the different combinations of experimental conditions: with/without music and with/without animated advertisements. Data were collected at different stages: pre-experiment, during experiment and post-experiment. The pre-experiment data collection stage concentrated on participants demographics, driving experience and historical data relating to driving. The post experiment data collection focused on recall of advertisement types and location. During the drivers’ engagement with the experimental conditions, information was recorded relating to driver workload and driving behaviour. Specifically, manifestations of workload, such as lateral deviations, crash location and speed, were recorded on a time-location plot. Driver behaviour was recorded in terms of lane change, headway, car overtaking and speed. Headway expresses the distance from the preceding vehicle and is a typical indicator of aggressive driving that is related to accidents. The method used to capture the data was analyst observation along with video recordings. To facilitate the data collection task the road was divided into 11 sections as illustrated in Figure 1. The specification of these sections was based on infrastructural properties and billboard locations. On completion of the experiment the analyst studied each video and verified the correctness of the recorded data during the experiment.
ANALYSIS AND RESULTS Twenty (20) participants (10 male) took part in the present study, with a mean age of 35 years (SD = 18). All participants had held a full driving license. The age range of participants in the experiment was based on the mean age of drivers from historical records at the black spot under study. Their mean driving experience was 15.2 years (SD = 16.1). All participants were Cypriot residents and hence familiar with the local traffic regulations. As deducted from the aforementioned description of the experiment, this involved a repeated measures experimental design since each of the 20 took part in 4 experimental conditions. The data collected during the different stages of the study were merged into one dataset, which included the background information for the participants (e.g. gender, age, driving experience) as well as their behavioral measures during the four experimental conditions (e.g. accident occurrence, speed, headway, etc). The design, is illustrated schematically in Table 1, and shows how we resulted with 80 (correlated) observations in total.
TABLE I. THE REPEATED MEASURES EXPERIMENTAL DESIGN Music Music YES NO Advertisement Advertisement Advertisement Advertisement
Analysis, which is restricted here to the descriptive/exploratory findings, was performed with the help of the widely used statistical package SPSS (version 20) and Microsoft Excel Package. The findings highlight that human requirements are not satisfied and hence, the need of a smart SA system.
Before the experiment, participants were asked to rate their knowledge about the highway traffic code. The vast majority (90%) reported that they know it well (20%) or very well (70%) with only 2 participants reporting less confident with it. 80% also perceived themselves as familiar with the particular road, whereas almost half (45%) consider this road-section accident-prone compared to only 30% stating the opposite and a 25% reporting unsure. The majority (75%) are frequent drivers (i.e. they drive almost daily). Post-experimental questionnaires also provided some information that could be used in further analysis: When asked whether they noticed any advertisements, 14 out of the 20 participants (70%) responded positively. The vast majority (N=17, 85%) considered the final road section (10a) as the most dangerous. When asked whether the music influenced their concentration only 8 (40%) reported no influence. From the 12 who responded that music had an influence, an investigation into their more detailed statements in regards to influences indicated that they were positive (i.e. increase in Human Aspects of Transportation III (2022) https://openaccess.cms-conferences.org/#/publications/book/978-1-4951-2099-2 concentration) with one negative (i.e. increase in speed); however it should be noted that detailed information was not reported from all. Finally, when asked about the slow cars, most participants (N=14, 70%) considered them as nuisance for their driving (describing them as ‘annoying’, getting them angry or increasing their desire to overtake, amongst others).
Results are presented next regarding the relationships between phenotype behaviours that indicate overloading and accidents occurrence. Areas of overloading indicate failure to satisfy the minimum human requirements of the sociotechnical system under study. The problems that are identified are used as the basis to specify the requirements of a prospective in-vehicle situation awareness enhancement system. We also investigate relationships between these measures and the experimental conditions as well as driver’s background variables with the outcome variable (accident) as well as some potentially confounding variables. The results overall indicate that at certain sections of the road drivers were underperforming on their primary task of driving and hence fail to satisfy the minimum requirements of the sociotechnical system. This indicates that they were overloaded, which reduced their SA. These observations were more evident at billboards locations. Similarly at certain sections users demonstrated low headway that indicates aggression and enthusiasm which could have been induced by music. Both conditions (i.e. music and advertisements), however, affect SA which makes the driver vulnerable to errors. Evidence of these observations is presented next. Driving Speed
Figure 5 presents descriptive statistics for the recorded speed at each road section. When comparing the mean speeds per section, analysis of variance (ANOVA) showed significant differences (F(10,879)=3.543, p<0.001), and post-hoc test showed that these differences were between section 1 and the rest of sections (with speed at Section 1 lower, as expected).
Figure 5. Descriptive Statistics (left) and confidence intervals (right) for driving speed by section What is of more interest, however, is how music (and adverts) affects speed. The average speed under the Music experimental condition (with and without) is illustrated in Figure 6, where the position of advertisements is also shown. The statistically significant differences, are also indicated in the figure, and these refer to sections 2 (t=-2.43, p=0.018), 3 (t=-2.79, p=0.007), 7 (t=-2.76, p=0.007) and section 10b (t=-2.36, p=0.021). It should be emphasised that in all these sections the higher speed was observed when the participants were listening to music. Similar analysis was performed based on the advertisement condition where a more uniform patter was identified: up to Section 6 higher average speed was recorded when an advert was present, whereas from Section 7 till the end the trend was reversed (with higher speeds recorded when no advert was present). The biggest (and also the only statistically significant) differences (around 10km/h) were noted for Sections 3 to 5, which were also found to be statistically significant (Section 3: t=-2.46, p=0.016; Section 4: t=-2.69, p=0.009; Section 5: t=-2.11, p=0.038).
Figure available in the original PDF paper.
Human Aspects of Transportation III (2022) https://openaccess.cms-conferences.org/#/publications/book/978-1-4951-2099-2
Figure 5. Mean speed per road section, with and without music (left), and with or without advertisements (right)
Figure available in the original PDF paper.
Lane Deviation and Overtaking The estimated proportions of participants overtaking other cars and deviating from the lane at each section are shown in Figure 6. As can be seen, there is a tendency to overtake more and deviate from the lane less between sections 4 and 7. These sections were also found to be responsible for the statistically significant differences in post hoc tests during ANOVA between sections (F(lane)=12.25, p<0.001, F(overtake)=15.86, p<0.001).
0.8
0.7
0.6
Overtake-NoMusic Overtake- Music Lane-NoMusic Lane-Music
0.5
0.4
0.3
Proportion of Participa
0.2
0.1
0
S 1 S 2 S 3 S 4 S 5 S 6 S 7 S 8 S 9 S 10a S 10b
Figure 6. Lane deviation and overtaking, with/without music
Figure available in the original PDF paper.
Headway When looking at the proportion of participants who keep safe headway (Figure 7), we observe the same pattern in regards to sections differences, as those reported above for lane deviation. No statistically significant differences were found in regards to experimental conditions, even though some patters are noted in Figure 7 (e.g. under the advert condition, music seems to lead to decreased safe headway proportions).
Occurrence of Accidents Finally, we present some results in regards to the main outcome variable of interest; that is accident occurrence. Figure 8 illustrates how the chances for accident vary across road sections, and under the two experimental conditions. Further statistical analysis for the differences across sections showed that sections 10a and b present the higher (statistically significant, F=16.84, p<0.001) accident proportions. No statistically significant differences were found in regards to experimental conditions.
0.35
0.4
0.35
0.3
0.3
0.25
0.25
0.2
0.2
0.15
0.15
Accident Proport
Accident Proport
0.1
0.1
0.05
0.05
0
0
S 1 S 2 S 3 S 4 S 5 S 6 S 7 S 8 S 9 S 10a S 10b
S 1 S 2 S 3 S 4 S 5 S 6 S 7 S 8 S 9 S 10a S 10b
Figure 8. Accident occurrence with/without music and advertisements
Figure available in the original PDF paper.
At this point we should also note the limitations of the current analysis (due to lack of space): most of these preliminary results, even though indicative of some patterns fail to account for the inter-relationships between Human Aspects of Transportation III (2022) https://openaccess.cms-conferences.org/#/publications/book/978-1-4951-2099-2 different variables (i.e. the interaction of the experimental conditions), and they do not take into account the repeated measures design and the resulting correlation between the observations for each subject. These limitations will be overcome with repeated measures regression models, following the methodology we introduced in our earlier work with a similar experiment (Hutcheson & Sofroniou, 1999).
DESIGN SPECIFICATION FOR THE SMART SITUATIONAL AWARENESS ENHANCEMENT SYSTEM The results highlight that the existence of animated advertisement billboards in combination with in-vehicle music could increase the accident risk, which could be due to decreased SA because of overloading. Specifically, the results highlight the increased workload at points where advertisements and music are present. This is expressed by headway, lane deviations and speed phenotype driving behaviours. The majority of accidents occurred during lane changing while overtaking. Again a significant contributing factor to that is low SA either due to overloading or due to incomplete information caused by vehicles blind spot. The third observation from the experiments is that accidents statistics increased at the intersection. This is caused mainly by lateral movements of surrounding vehicles.
Results from the experiments above highlight the need for SA enhancement through automation. The system should be providing drivers with extra critical information that will make driving safer and less stressful. The system should abide to the fact that modern vehicles are being loaded up with even more distracting technologies as their multiple displays are becoming more complex. At the same time, older drivers have slower reaction times and problems with perception of speed and distance.
Moreover, the highest percentage of accidents occurred at the section where the traffic was increased. This is not surprising since at these locations drivers are expected to process increased volume of information. This highlighted the need of a SA enhancement system that would alleviate the workload of drivers at such situations by helping them to concentrate on more critical information cues. The criticality of these cues is defined based on proximity to other vehicles, other vehicle trajectories and predicted position of surrounding vehicles and the projected impact. Another important SA gab in driving is the vehicles blind spot. Blind spot is the area to the back side of the vehicle where you may not see a car because the mirror does not cover it or is obscured by the vehicle’s middle pillar the so called b-pillar. Drivers are taught to look over their shoulder before changing lanes to improve their situation awareness. However, what they may miss during a quick glance, is what a smart situational awareness enhancement system can pick up. Such driver assistance technology senses cars coming up in the blind spot and accordingly alerts the driver not to change lanes. The driver is warned by a flashing light on the side view mirror and then a beep or steering wheel vibration. If they are not planning to change lanes (there is no turn signal on), the warning light glows steadily but does not flash and there is no audible alert. Such smart technology provides 360 degrees of coverage around a vehicle, combined with adaptive cruise control, and lane departure warning. These system recommendations are presented on an interface that is an augmented-reality head-up display viewed through a vehicle's windshield.
Based on the results, a smart SA enhancement system should be designed to support the information needs of drivers by reducing their workload. The challenges in designing such systems are many. The one addressed in this paper is the design of the user interface so that it not distractive to the driver. This could be achieved by providing drivers with important situational cues that are critical for maintaining acceptable levels of SA. The type of automation is selected at the level-1 of SA which is information perception, a necessary task for improved decision making. This in essence could reduce the likelihood of accidents. The identified problems from the experiments point to the need of a system that will not be intrusive and at the same time will enhance SA. To that end the use of augmented reality overhead display is considered as a suitable option. The visualisations of the display should aim to provide the driver with enhanced peripheral vision with a dynamic assessment of the most critical entities within the immediate periphery of the vehicle.
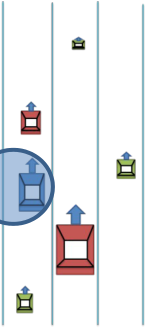
One of the candidate designs that is proposed and modelled in the virtual environment after analysing the results from the experiments is the one depicted in figure 9. The host vehicle is in the middle (blue shaded circle) surrounded by red and green vehicles of different sizes. These correspond to high and low risk vehicles accordingly. For instance vehicles that are in the driver’s blind spot are represented by big red cars. Low risk cars are depicted by small green icons. High proximity or hidden vehicles at intersections are also high risk and hence are big and red.
Human Aspects of Transportation III (2022) https://openaccess.cms-conferences.org/#/publications/book/978-1-4951-2099-2
Information regarding the rear vehicles can be obtained through on-board sensors. Vehicles at intersections can be obtained through vehicle to vehicle communication. The visualization metaphor presented in figure 9 will be depicted on the vehicles windshield.
Figure 9. Visualization of the proposed design of the situation awareness enhancement system for two traffic scenarios: a 3 lane road (left) and an intersection (right). The host vehicle is depicted in a circle.
CONCLUSIONS
To our knowledge this is the first study that was conducted in Cyprus for black spot analysis using a driving simulator and local road users. The method provides us with valuable insights on the design of smart in-vehicle technology to enhance drivers’ SA. The simulation based requirements capturing method enables the design and customization of the road infrastructure for what-if analyses in a modular fashion. This enables the design of the experimental settings for the analysis of a variety of possible system designs. Preliminary results from this study highlight a relationship between music and driving speed and, consequently accident occurrence probability. A relationship between lateral deviations of road users and advertisement is also observed. Overall the results inform the design of a smart situation awareness enhancement system that will reduce drivers’ workload induced from in- vehicle and out-vehicle distractions.
The use of situation enhancement technology such as the one specified herein could alleviate these problems. The validation of the requirements of the proposed designs however needs further experimental simulation studies. This constitutes the next phase of our work in which a series of participants will use the system in a similar study. The results will be compared with the current to find whether the technology improves drivers’ workload and SA.
Limitations of this work involve the realism and immersion factors that laboratory methods are suffering from. Simulated settings currently do not offer the resolution of the real world, and these may affect driving behaviour. Future work includes the use of immersive driving conditions using virtual reality. This will enhance realism and hence improve observational accuracy.
ACKNOWLEDGEMENTS This work is part of the IPE/NEKYP/0311/02 "VR CAVE" project and is financially supported by the Cyprus Research Promotion Foundation and the European Structural Funds. (http://www.vrcave.com.cy)
REFERENCES
Bailey R. (1996). Human Performance Engineering. Englewood Cliffs, NJ: Prentice-Hall. Brookhuis K.A., & De Waard, D. (2002) .On the assessment of (mental) workload and other subjective qualifications. Ergonomics, 45, pp. 1026–1030 Dalton, B. H., & Behm, D. G. (2007). Effects of noise and music on human and task performance: A systematic
review. Occupational Ergonomics, 7, 143–152. Davenne D., Lericollais R., Sagaspe P., Taillard J., Gauthier A., Espié S., Philip P. (2012). “Reliability of simulator driving tool for evaluation of sleepiness, fatigue and driving performance”, Accident Analysis and Prevention, 45, pp.677-682.
Human Aspects of Transportation III (2022) https://openaccess.cms-conferences.org/#/publications/book/978-1-4951-2099-2
Dibben, D., Williamson, V.J. (2007). An exploratory survey of in-vehicle music listening. Psychology of Music, 35, pp. 571–589 Dingus, T. A., Klauer, S. G., Neale, V. L., Petersen, A., Lee, S. E., Sudweeks, J., et al. (2006). “The 100-car
naturalistic driving study: Phase II – Results of the 100-car field experiment”, (report no. DOT HS 810 593). Washington, DC: National Highway Traffic Safety Administration. DOT (2006) Driver workload metrics project, final report 810 635, www.nhtsa.gov DOT (2011), “Reported Road Causalities, Great Britain:2011”, annual report, National Statistics Eksler V., Lassarre S., Thomas I. (2008). “Regional analysis of road mortality in Europe”, Public Health, 122, pp.826-837. Endlsey M. R. (1995). “Toward a theory of situation awareness in dynamic systems”, Hum. Factors, 37, n.1, pp.32–
64. Fuller R. (2005). “Towards a general theory of driver behaviour,” Accident Anal. Prev., 37, n.3, pp.461–472. Fuller R. and Santos J. (2002). Human Factors for Highway Engineers. New York: Pergamon Gregoriades. A and Sutcliffe. A. (2007). “Workload prediction for improved design and reliability of complex systems,” Reliab. Eng. Syst. Saf., 39, n.4, pp.530–549. Gregoriades A, Sutcliffe A, Papageorgiou G, Louvieris P. (2010) “Human-Centred Safety Analysis of Prospective
Road Designs”, IEEE Transactions on Systems, Man and Cybernetics, Part A, Vol 40, 2, pp 236-250. Gregoriades A Florides C Pampaka M.,(2013) “Driver Behaviour Analysis through Simulation” IEEE SMC 2013 Hollnagel E., Woods D., and Leveson N. (2004). Resilience Engineering and Management. Aldershot, U.K.: Ashgate. Holohan, C., Culler, R., & Wilcox, B. (1978). “Effects of visual distraction on reaction time in a simulated traffic
environment”, Human Factors, 20, pp.409–413. Horberry, T., Castro, C., Martos, F., & Mertova, P. (2004). “An introduction to transport signs and overview of this book”, In C. Castro & T. Horberry (Eds.), The human factors of transport signs (pp. 1–15). Boca Raton, FL: CRC. Hutcheson, G. D. and Sofroniou, N. (1999). The Multivariate Social Scientist: Introductory statistics using
generalized linear models. Sage Publications. Jamson, A. H., Westerman, S. J., Hockey, G. R. J., & Carsten, O. M. J. (2004). “Speech-based e-mail and driver behaviour: Effects of an in-vehicle message system interface”, Human Factors, 46, pp.625–639. Kazak, S. (2009). Kuwait’s newest misdemeanour: Driving under the influence of music Konstantopoulos P., Chapman P., Crundall D. (2010). “Driver’s visual attention as a function of driving experience
and visibility. Using a driving simulator to explore drivers’ eye movements in day, night and rain driving”, Accident Analysis and Prevention, 42, pp.827-834. McKenzie, K. C. (2004). The effects of music amplitude and tempo on simulated driving performance. Merat, N., Antilla, V., Luoma, J., (2005). Comparing the driving performance of average and older drivers.
Transportation Research Part F(8), 147–166. Miller G. (1956). “The magic number seven plus or minus two: Some limits on our capacity to process information”, Psychol. Rev., 63, n.2, pp.81–97. Montella A., Ariab M., D’Ambrosiob A., Galantea F., Maurielloa F., Pernettic M. (2011). “Simulator evaluation of
drivers’ speed, deceleration and lateral position at rural intersections in relation to different perceptual cues”, Accident Analysis and Prevention, 43, pp.2072-2084. Mylopoulos,J., Chung, L., & Yu, E. (1999). From Object- Oriented to Goal-Oriented Requirements Analysis.Communications of the ACM, 42, pp. 31-37.Norman D. (1988). The Psychology of Everyday Things. New York: Basic Books. North, A. C., & Hargreaves, D. J. (1999). Music and driving game performance. Scandinavian Journal of
Psychology, 40, 285–292. Salvendy, G., Vidulich, M.A., & Tsang, P.S. (2012). Mental Workload and Situation Awareness. London: John Wiley & Sons. Stone, R. J. ( 2001). Virtual Reality for Interactive Training: An Industrial Practitioners Viewpoint, International
Journal of Human-Computer Studies, vol. 55, pp. 699-711. Wark, R. I., Lucke, R. E., & Raub, R. A. (2002). Aggressive driving: Appendix 6, Northwestern University Center for Public Safety Williams J. C. (1988). “A data-based method for assessing and reducing human error to improve operational
performance”, in Proc. Human Factors Power Plants, Monterey, CA, pp.436–450. Young M. S., Mahfoud J. M., Stanton N. A., Salmon P. M., Jenkins D. P.,. Walker G. H. (2009). “Conflicts of interest: The implications of roadside advertising for driver attention”, Transportation Research, 12, pp.381-388.
Human Aspects of Transportation III (2022) https://openaccess.cms-conferences.org/#/publications/book/978-1-4951-2099-2
Young, K. L., Regan, M. A., & Hammer, M. (2003). “Driver distraction: A review of the literature”, (report no.
206). Victoria, Australia: Monash University Accident Research Centre.
Human Aspects of Transportation III (2022) https://openaccess.cms-conferences.org/#/publications/book/978-1-4951-2099-2
LISTED IN THE AHFE DIGITAL BOOKSTORE CATALOGUE
Explore the complete digital volume
Advances in Human Aspects of Transportation: Part III
Read this individual research paper free through the original publisher, or explore the full digital proceedings book.
ISBN 978-1-4951-2099-2
Explore this ISBN in the AHFE Bookstore ↗Listed in the July 2026 bookstore catalogue; search by ISBN to confirm current availability · Digital book purchase optional