Markus Gödker, Thomas Franke (2024). Assessing Energy-Related Situation Awareness Using Self-Controlled Occlusion During Electric Vehicle Driving Scenes. In: Advances in Human Factors of Transportation. AHFE Open Access, vol. 148, pp. 286–296. https://doi.org/10.54941/ahfe1005219
Optimal eco-driving in electric vehicles (EVs) can be challenging due to volatile, bidirectional energy flows and the difficulty of directly sensing energy flows. The present research investigates energy-related situation awareness (Energy Dynamics Awareness, EDA) as a pilot study. EDA is a theoretical concept that helps to describe and understand how visual energy feedback displays inform energy-efficient vehicle control decisions. We compared three methods (estimation tasks, subjective EDA rating scale, and gaze behavior metric) to assess EDA under two different workload conditions, using a video-based online study displaying EV driving scenes (N = 29). We developed a novel approach to collect gaze behavior indicators using self-controlled (i.e., manually directed) occlusion through keyboard input. Participants were asked to estimate and compare the energy consumed in EV driving scenes while performing a parallel visuospatial n-back task to induce cognitive load. Based on our findings, the n-back task successfully induced cognitive load and self-directed occlusion showed to be a promising method for energy display evaluation studies. The performance of the consumption estimation task and display fixations were influenced by cognitive workload, which has important implications for ecodriving interface design. As the subjective and performance-related measures of EDA did not correlate, the results contribute to the discussion on the divergence between subjective and objective measures of situation awareness. This pilot study encourages further research with a larger sample and adapted methods.
Electric vehicles (EVs) offer sustainable transportation, with drivers playing a crucial role in determining the ultimate actual energy efficiency of EVs while driving through their individual ecodriving behavior (Galvin, 2017; Sureth et al., 2019). Ecodriving has a utility on a social (e.g., reduction of CO2 emission) and individual level (e.g., reduction in energy costs, poten- tial coping skill for situations facing limited remaining range; Rauh, Franke and Krems, 2017) but can be challenging due to volatile, bidirectional energy flows (i.e., regenerative braking; Arend and Franke, 2017) and the difficulties
Assessing Energy-Related Situation Awareness Using Self-Controlled Occlusion 287
for humans to directly sense energy dynamics (in contrast to other physical phenomena such as light or sound with dedicated human sensory capabil- ities). Therefore, to support drivers, energy displays that provide access to energy information are a standard built-in feature and have already been the subject of scientific debate and empirical research in the field of human factors (Dahlinger et al., 2018; Sanguinetti et al., 2020; Moll and Franke, 2021). The human-machine interaction context of drivers executing ecodriving behavior inside the vehicle based on available information can psycholog- ically be conceptualized as an action regulation control loop, similar to other control-theoretic models of facets of driving behavior (Fuller, 2011) or self-regulation in general (Carver and Scheier, 1982), in which drivers con- tinuously perceive the vehicle and the environment, and act accordingly to perceived information and current driving goals (Franke et al., 2016). We assume that in this context of ecodriving an energy-specific situation aware- ness (Endsley, 1995, 2015), which we refer to as Energy Dynamics Awareness (EDA; Gödker, Dresel and Franke, 2019; Gödker, Moll and Franke, 2024), supports energy-efficient decisions and actions in electric vehicles and that visual energy feedback interfaces can support EDA by providing information to perceive, understand, or predict energy dynamics.
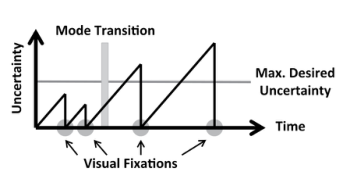
Here, workload plays a significant role as a limiting factor in conscious cognitive and attentional processes. The closed-loop model of Johnson et al. (2017) is an adaptation of the SEEV model (Wickens et al., 2003), and has been designed to help understand and predict visual attention, cognitive load, and situation awareness. Following this model, a lack of knowledge about current system states (e.g., energy consumption) leads to uncertainty, prompting operators to seek information from interfaces to clarify the state of relevant elements (e.g., speed) and improve awareness. The longer opera- tors refrain from looking at the interface, the more uncertainty grows until it reaches a limit, which is the maximum desired uncertainty. Beyond this limit, the situation awareness decreases significantly, and ultimately, performance.
Therefore, EDA and cognitive load in energy information processing are central elements in the supporting effects of energy displays on ecodriving and important to examine. In the present work, we focus on video-based online studies. They are highly controllable, as they offer identical stimuli for all participants (as opposed to field studies). In addition, they are a safe and economical way to evaluate energy displays in early development stages. However, gaze-based metrics such as uncertainty are difficult to measure when eye tracking technology is unavailable.
Figure 1: Schematic representation of the relationship between visual fixations and uncertainty from Johnson et al. (2017, p. 231).
288 Gödker and Franke
We adapted occlusion to assess indicators of gaze behavior, which is an established method in information processing demand experiments with in- vehicle displays (Krems et al., 2000; Baumann et al., 2004). Occlusion is the temporary covering of information or visualizations to control the visual attention on displays or on the traffic. Normally, occlusion is manipulated and introduced by the experimenter, and participants do not control what is occluded and when. But when participants can control when the occlusion occurs, it is possible to infer with some accuracy the visual attention foci of participants (i.e., self-controlled occlusion).
To sum up, since energy-related situation awareness can be assumed to be influenced by workload and related to visual attention and behavior, we tested whether we could link uncertainty as a gaze behavior metric during the use of energy displays under different workload conditions to different EDA measures in a pilot study.
Therefore, the present research had three research objectives: RO1. To build and test an experimental setting to examine EDA under different workload conditions. RO2. To integrate and test self-controlled occlusion as a gaze data collection method to quantify drivers’ energy information acquisition. RO3. To examine any empirical link between visual attention towards the energy information and (self-assessed) EDA.
METHOD
Sample We recruited participants through the online learning platform of the Univer- sity of Lübeck and by personally approaching colleagues and acquaintances. Of the 43 full participations, we had to exclude 14 because the self-controlled occlusion data could not be obtained or validated correctly due to technical reasons. The final sample (N = 29, 16 female, 12 male, 1 not stated) had an average age of M = 29.9 years (SD = 14.1) and an average affinity for technology interaction (ATI) of M = 3.58 (SD = 1.32), which was almost exactly equal to the distribution of a quota sample assumed to represent the general population in Germany (M = 3.61; Franke, Attig and Wessel, 2019).
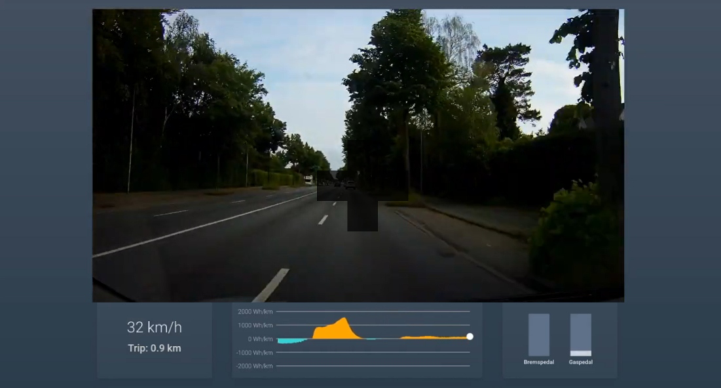
Driving Scenes In this online experiment, participants viewed driving scenes (videos) of EV trips from the driver’s field of view, along with an instantaneous consump- tion display that has been designed for a previous study (for more details, see Gödker, Moll and Franke, 2024). In addition, current speed as well as brake and throttle pedal position were presented (Figure 2). For the driving scenes, we collected OBD-II data and dashcam footage of the driver’s view in a Renault ZOE EV in urban conditions. Participants had to watch five driv- ing scenes: one test driving scene to introduce the setting and task, then four experimental driving scenes to measure the dependent variables. Of these, two driving scenes each shared the same route (“Route A” or “Route B”) but
Assessing Energy-Related Situation Awareness Using Self-Controlled Occlusion 289
differed in consumption due to the driver using two different driving strate- gies: (1) driving-to-keep-distance (constant distance to vehicle ahead), that is, inefficient or (2) driving-to-keep-inertia (constant speed), that is, efficient (adapted from Blanch Micó et al., 2018; Lucas-Alba et al., 2020).
To produce the final videos, driving data was imported into a Web app that displayed velocity, trip distance, pedal positions, and an energy display along with a synchronized video of the dashcam recordings. The trips lasted between 142 and 282 seconds, and the average energy consumption was between 5.14 and 18.09 kWh/100km.
Figure 2: Screenshot of the video of the electric vehicle driving scene..
Measurement We first assessed EDA using two performance-related energy consumption estimation tasks. First, after each driving scene, participants had to estimate as accurately as possible how many watt hours per kilometer were consumed on average during this trip (ConsEst). Then, after the second driving scene of the same route, participants were additionally asked to indicate on which of the two trips of the same route more energy was consumed (EffIdent). The second method to assess EDA was an adaptation of the EDA scale (Gödker, Moll and Franke, 2024) as a subjective self-rating scale assumed to assess experienced EDA (Table 1). The internal consistency of this scale was overall good (Cronbach’s α =.881). The six items had an α-if-item-deleted value below 0.881, which means that no item should be excluded from the analysis.
As a third method to assess EDA, we used the sampling period and the uncertainty metric by Johnson et al. (2017). The sampling period is defined as the average duration between two fixations on the display. The uncer- tainty is determined by the extent to which the sampling period exceeds the baseline sampling period. We defined the latter as the sampling period under normal circumstances without additional workload. The uncertainty met- ric was calculated by dividing the sampling period by the baseline sampling
290 Gödker and Franke
period. Following the assumptions of Johnson et al. (2017), if the sampling period exceeds the baseline (uncertainty > 1), important information cannot be perceived and situation awareness decreases.
Table 1. EDA scale items used in the present study, adapted item wording based on (Gödker, Moll and Franke, 2024).
Table available in the original PDF paper.
Item Text (translated from German) 1 By using the display during the previous two trips, I got a very good overview of the energy dynamics of the system. 2 By using the display during the previous two trips, I was able to precisely estimate the influence of various factors on the energy consumption. 3 By using the display during the previous two trips, I understood which of my actions influence the energy dynamics. 4 Using the display during the previous two trips allowed me to correctly predict the energy consumption in future situations. 5 By using the display during the previous two trips, I knew exactly what can influence the flow of energy. 6 By using the display during the previous two trips, I felt very able to increase energy efficiency if I had the opportunity.
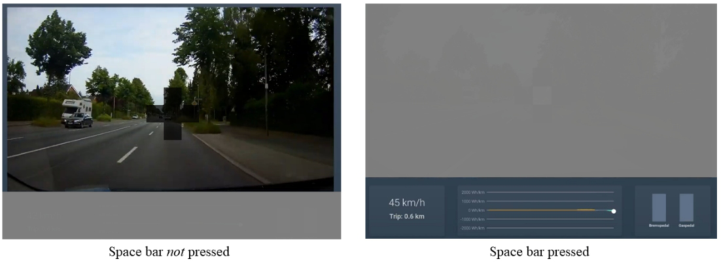
We implemented self-controlled occlusion so that at any time either the entire view from the windshield was obscured by a gray box or the displays in the lower area. By pressing the space bar, participants could decide which area was covered and could change this as often as they wished and at any time. The sampling period was then calculated by averaging the time between two space bar presses, which indicated an active removal of the display occlusion (see both occlusion states in Figure 3).
Figure 3: Screenshots of the two occlusion states that could be changed by pressing the space bar.
N-Back Task During each driving scene, participants had to perform a parallel visuo- manual n-back task in two variations to induce two workload conditions as independent variable (0-back = low workload and 1-back = high workload).
Assessing Energy-Related Situation Awareness Using Self-Controlled Occlusion 291
The n-back task was to press the keys W, A, S, or D according to a visual sig- nal. The visual signal was a gray cross, semi-transparent in the view from the windshield. At variable time intervals (between 3 and 10 seconds), one side of the cross was highlighted white for 1.5 seconds. In the 0-back condition, the response was to be given directly via W (up), A (left), S (down), D (right); in the 1-back condition, the first visual stimulus was not responded to at all, and from the second stimulus onward, the correct reaction had to be given to the previously seen stimulus. A correct response was indicated with a green square surrounding the cross, and a false response was indicated with a red square. Giving no response at all was counted as false. If the windshield view was occluded during a stimulus, the stimulus was indicated by highlighting the middle of the cross to give participants the opportunity to change the occlusion for the n-back task (right screenshot in Figure 3).
Procedure Participants began by providing demographic information. The experiment proceeded in two blocks, each presenting a different workload condition (low or high). In each block, participants watched the two driving scenes (high and low efficiency) while performing the n-back task with self-controlled occlu- sion. Consumption estimation accuracy (ConsEst and EffIdent), self-assessed EDA (EDA scale), and the NASA-TLX scale (Hart and Staveland, 1988) were queried in each block. After completing both workload conditions, the par- ticipants’ affinity for technology interaction (ATI) and technical knowledge were queried.
Manipulation Check Regarding RO1, we checked whether the manipulation of different work- load conditions was successful in this setup. The accuracy of the responses to the n-back task was significantly higher in the low workload condition (Mdn = 92.9%) than in the high condition (Mdn = 87.6%, p = .004, r = .52). Furthermore, although the NASA-TLX total score does not differ as indicated by a Wilcoxon signed-rank test (p = .176, r = .25), the mental load item was significantly higher in the high workload condition (M = 11.59, SD = 3.86) than in the low condition (M = 10.24, SD = 4.00, t(28) = −2.11, p = .044, d = −0.39). Both results implied a successful workload manipulation by the n-back task.
RESULTS
Our first research objective (RO1) was to assess EDA under different work- load conditions. Neither the average EDA scale mean score (Mlow = 4.09, SDlow = 0.86, Mhigh = 4.18, SDhigh = 0.74, t(28) = −0.9, p = .824, d = −0.18) nor the share of correct efficiency identifications (EffIdent, Mlow = 93%, SDlow = 26%, Mhigh = 93%, SDhigh = 26%, that is, identical) showed significant differences. But the accuracy of the absolute consumption estimation (a higher value indicates more absolute difference to the correct value, that is, less accuracy) was significantly higher in the low workload condition (Mlow = 38.9, SDlow = 19.9) than in the high workload condition
292 Gödker and Franke
(Mhigh = 61.8, SDhigh = 24.6, t(28) = −3.62, p = .001, d = −0.67). This implies a reduced understanding of energy dynamics with higher cognitive workload.
Regarding RO2, the sampling period (showing a non-normal distribution, hence, we used non-parametric analysis methods) was significantly different (Mdnlow = 5.35, IQRlow = 5.0 Mdnhigh = 7.63, IQRhigh = 5.0) in the two workload conditions, tested using a Wilcoxon signed-rank test (p = .001, r = .58) and indicating a negative effect of workload on visual attention to energy-relevant information. This is remarkable, as the demands for visual attention are identical in the two workload conditions. We also calculated the uncertainty metric for each person by dividing the sampling period for the high workload condition by the sampling period for the low workload condition. If there were no uncertainty, this value would be 1. In our sample, the median Mdn = 1.37 (IQR = 0.95) was significantly higher than 1 as indicated by a one-sample Wilcoxon test (p <.001, r =.64), which implies that the higher workload condition affected gaze behavior. This, in turn, could potentially have led to an information acquisition deficit due to the reduced visual attention allocated to the energy feedback display to obtain necessary energy information.
Regarding RO3, the three EDA measurements (ConsEst/EffIdent, EDA scale, and the uncertainty / sampling period) did not show significant cor- relations with each other (−.07 < r <.19, .148 < p < .606), implying no empirical relationship between the EDA measures and gaze behavior in the present study.
DISCUSSION
The results showed differences in consumption estimation and the sampling period in the two workload conditions. However, the self-assessed EDA and efficiency identification did not differ due to the workload condition. Further- more, no correlation was found between the EDA measures. Consequently, the present study presents methodological, theoretical, and practical impli- cations for understanding the processing of energy-related information by drivers under varying workload conditions.
Methodologically, the research successfully built and tested an experimen- tal online setting to test human information processing in the context of understanding energy efficiency under varying workload conditions (RO1). This method can be used to evaluate energy display concepts in the early development stages. Moreover, we introduced self-controlled occlusion as a novel gaze data collection technique in an online video-based setting (RO2). This innovative approach enables the calculation of fixation-based eye- tracking metrics without any camera or sensor technology. Furthermore, the present study applied three different methods to assess and quantify energy- related situation awareness (EDA), providing insights on the properties and potential applications of these measures.
Theoretically, the lack of correlation between self-assessed EDA and performance-based EDA measures, along with the absence of a difference in
Assessing Energy-Related Situation Awareness Using Self-Controlled Occlusion 293
self-assessed EDA between workload conditions, hints at a conceptual diver- gence in subjective and objective measures of EDA (RO3). This suggests that individuals’ experience of their energy-related situation awareness may not accurately reflect their actual comprehension. This finding contributes to the discussion of the theoretical divergence of subjective and objective situation awareness measures (Endsley, 2020).
Practically, the findings suggest that visual attention and comprehension of energy consumption are influenced by workload, as evidenced by the differing sampling periods under the two conditions and the difference in the accuracy of consumption estimation. This indicates a dynamic interplay between task demand and information processing in the ecodriving con- text. In turn, this suggests the need for careful selection of displays or even the use of situation-adaptive energy displays in complex driving situations. Instead of displays supporting the understanding of energy consumption, more action-oriented displays might be favorable (e.g., indicating the optimal speed).
Limitations and Outlook The present study served primarily as a feasibility test for self-controlled occlusion as a gaze indicator assessment method and to obtain first results on any empirical link between visual attention towards the energy informa- tion and (self-assessed) EDA. The rather small sample size (N = 29) limits the generalizability of our findings to some extent. Our different EDA measures did not show correlation with each other. This might signal a methodological concern, such as issues with the reliability or validity of our measures (also discussed in Gödker, Moll and Franke, 2024). Alternatively, it could reflect a conceptual divergence between subjective, objective, direct, and indirect measurements. Detailed investigations are necessary to discern and under- stand these nuances. Furthermore, our pilot study did not involve real driving behavior but focused solely on the acquisition and comprehension of energy- related information. While this provides valuable insights, the transferability of our findings to actual driving scenarios cannot be answered based on the present study. Additionally, the scenes used in the present study were not the- oretically derived, which means they were not selected based on their energy relevance (i.e., where ecodriving makes a difference in consumption) or other characteristics of driving situations such as complexity (leading to additional cognitive workload).
Although the present pilot study only used one energy display, different displays or display variations should be incorporated into future studies. This could increase understanding of the effect of single display elements on human information processing and the resulting behavior (Sanguinetti, Dombrovski and Sikand, 2018). Additionally, the successful manipulation of cognitive workload and the sensitivity of the sampling period data provided a solid foundation for further analyses and empirical studies. In the present study, participants watched driving scenes and energy information on the computer screen. As eye movement in real vehicles is different, subsequent research should also compare the present results with eye tracking data in
294 Gödker and Franke
real or simulated driving scenarios. Transfer to driving simulator studies or field studies would not only enhance the ecological validity of the findings but would also allow for a more nuanced understanding of how EDA influences actual driving behavior and energy efficiency.
Finally, future studies should ensure that the scenarios used are carefully selected and recorded based on their energy relevance and complexity. This would ensure that the research context closely mirrors real-world driving conditions, thereby enhancing the practical applicability and impact of the research. Furthermore, the omission of irrelevant situations could further increase the diagnosticity and economy. Established catalogs of driving situa- tion requirements should be used for such a definition and selection of driving situations (e.g., Fastenmeier and Gstalter, 2007) to inform optimal design of driving scenes to advance understanding of human-energy interaction.
In summary, the present pilot study offers a promising basis for future research. While this study represents an important first step in evaluating human energy information processing in electric vehicles, much remains to be explored to better understand and support ecodriving, energy display design, and electric vehicle use, ultimately contributing to more energy-efficient and sustainable driving behavior.
ACKNOWLEDGMENT
The authors thank Mona Dietzel and Hannah Küpper for their contribu- tions to the success of this work. This research was funded by the Deutsche Forschungsgemeinschaft (DFG, German Research Foundation) under the name “AMORi”, project number 498999989.
REFERENCES
Arend, M. G. and Franke, T. (2017) ‘The Role of Interaction Patterns with Hybrid Electric Vehicle Eco-Features for Drivers’ Eco-Driving Performance’, Human Factors: The Journal of the Human Factors and Ergonomics Society, 59(2), pp. 314–327. Available at: https://doi.org/10.1177/0018720816670819. Baumann, M. et al. (2004) ‘Evaluation of in-vehicle HMI using occlusion tech-
niques: experimental results and practical implications’, Applied Ergonomics, 35(3), pp. 197–205. Available at: https://doi.org/10.1016/j.apergo.2003.11.011. Blanch Micó, M. T. et al. (2018) ‘Car following: Comparing distance-oriented vs.
inertia-oriented driving techniques’, Transport Policy, 67, pp. 13–22. Available at: https://doi.org/10.1016/j.tranpol.2017.05.008. Carver, C. S. and Scheier, M. F. (1982) ‘Control theory: A useful conceptual framework for personality–social, clinical, and health psychology.’, Psychological Bulletin, 92(1), pp. 111–135. Available at: https://doi.org/10.1037/0033-2909. 92.1.111. Dahlinger, A. et al. (2018) ‘The impact of abstract vs. concrete feedback design on
behavior insights from a large eco-driving field experiment’, in Proceedings of the 2018 CHI Conference on Human Factors in Computing Systems. CHI ‘18: CHI Conference on Human Factors in Computing Systems, Montreal QC Canada: ACM, pp. 1–11. Available at: https://doi.org/10.1145/3173574.3173953.
Assessing Energy-Related Situation Awareness Using Self-Controlled Occlusion 295
Endsley, M. R. (1995) ‘Toward a theory of situation awareness in dynamic systems’, Human Factors, 37(1), pp. 32–64. Available at: https://doi.org/10.1518/ 001872095779049543. Endsley, M. R. (2015) ‘Situation awareness misconceptions and misunderstandings’,
Journal of Cognitive Engineering and Decision Making, 9(1), pp. 4–32. Available at: https://doi.org/10.1177/1555343415572631. Endsley, M. R. (2020) ‘The Divergence of Objective and Subjective Situation Awareness: A Meta-Analysis’, Journal of Cognitive Engineering and Decision Making, 14(1), pp. 34–53. Available at: https://doi.org/10.1177/1555343419874248. Fastenmeier, W. and Gstalter, H. (2007) ‘Driving task analysis as a tool in traffic
safety research and practice’, Safety Science, 45(9), pp. 952–979. Available at: https://doi.org/10.1016/j.ssci.2006.08.023. Franke, T. et al. (2016) ‘Ecodriving in hybrid electric vehicles – Exploring challenges for user-energy interaction’, Applied Ergonomics, 55, pp. 33–45. Available at: https://doi.org/10.1016/j.apergo.2016.01.007. Franke, T., Attig, C. and Wessel, D. (2019) ‘A personal resource for technology
interaction: Development and validation of the affinity for technology interac- tion (ATI) scale’, International Journal of Human–Computer Interaction, 35(6), pp. 456–467. Available at: https://doi.org/10.1080/10447318.2018.1456150. Fuller, R. (2011) ‘Driver Control Theory’, in Handbook of Traffic Psychology.
Elsevier, pp. 13–26. Available at: https://doi.org/10.1016/B978-0-12-381984-0. 10002-5. Galvin, R. (2017) ‘Energy consumption effects of speed and acceleration in electric vehicles: Laboratory case studies and implications for drivers and policymakers’, Transportation Research Part D: Transport and Environment, 53, pp. 234–248. Available at: https://doi.org/10.1016/j.trd.2017.04.020. Gödker, M., Dresel, M. and Franke, T. (2019) ‘EDA scale - Assessing awareness for
energy dynamics’, in F. Alt, A. Bulling, and T. Döring (eds) Mensch und Com- puter 2019 - Tagungsband. New York: ACM. Available at: https://doi.org/10. 1145/3340764.3344891. Gödker, M., Moll, V. E. and Franke, T. (2024) ‘Energy Consumption Displays in Electric Vehicles: Differential Effects on Estimating Consumption and Experi- enced Energy Dynamics Awareness’, Human Factors: The Journal of the Human Factors and Ergonomics Society, p. 00187208231222154. Available at: https: //doi.org/10.1177/00187208231222154. Hart, S. G. and Staveland, L. E. (1988) ‘Develpoment of NASA-TLX (task load
index): Results of empirical and theoretical research’, Advances in Psychology, 52, pp. 139–183. Available at: https://doi.org/10.1016/S0166-4115(08)62386-9. Johnson, A. W. et al. (2017) ‘A Closed-Loop Model of Operator Visual Attention, Situation Awareness, and Performance Across Automation Mode Transitions’, Human Factors: The Journal of the Human Factors and Ergonomics Society, 59(2), pp. 229–241. Available at: https://doi.org/10.1177/0018720816665759. Krems, J. F. et al. (2000) ‘Evaluating Visual Display Designs in Vehicles: Advantages
and Disadvantages of the Occlusion Technique’, in L. M. Camarinha-Matos, H. Afsarmanesh, and H.-H. Erbe (eds) Advances in Networked Enterprises. Boston, MA: Springer US, pp. 361–368. Available at: https://doi.org/10.1007/978-0-387- 35529-0_34. Lucas-Alba, A. et al. (2020) ‘Distressed in the queue? Psychophysiological and behavioral evidence for two alternative car-following techniques’, Transportation Research Part F: Traffic Psychology and Behaviour, 74, pp. 418–432. Available at: https://doi.org/10.1016/j.trf.2020.09.011.
296 Gödker and Franke
Moll, V. E. and Franke, T. (2021) ‘Biased energy efficiency perception based on instantaneous consumption displays – Indication for heuristic energy information processing’, Applied Ergonomics, 94, p. 103399. Available at: https://doi.org/10. 1016/j.apergo.2021.103399. Rauh, N., Franke, T. and Krems, J. F. (2017) ‘First-time experience of critical range
situations in BEV use and the positive effect of coping information’, Transporta- tion Research Part F: Traffic Psychology and Behaviour, 44, pp. 30–41. Available at: https://doi.org/10.1016/j.trf.2016.10.001. Sanguinetti, A. et al. (2020) ‘Average impact and important features of onboard eco-driving feedback: A meta-analysis’, Transportation Research Part F: Traffic Psychology and Behaviour, 70, pp. 1–14. Available at: https://doi.org/10.1016/j. trf.2020.02.010. Sanguinetti, A., Dombrovski, K. and Sikand, S. (2018) ‘Information, timing, and
display: A design-behavior framework for improving the effectiveness of eco- feedback’, Energy Research & Social Science, 39, pp. 55–68. Available at: https: //doi.org/10.1016/j.erss.2017.10.001. Sureth, A. et al. (2019) ‘The golden rules of ecodriving? The effect of providing hybrid electric vehicle (HEV) drivers with a newly developed set of ecodriving- tips’, Transportation Research Part F: Traffic Psychology and Behaviour, 64, pp. 565–581. Available at: https://doi.org/10.1016/j.trf.2019.07.003. Wickens, C. D. et al. (2003) ‘Attentional Models of Multitask Pilot Performance
Using Advanced Display Technology’, Human Factors, p. 21.
LISTED IN THE AHFE DIGITAL BOOKSTORE CATALOGUE
Explore the complete digital volume
Advances in Human Factors of Transportation
Read this individual research paper free through the original publisher, or explore the full digital proceedings book.
ISBN 978-1-964867-24-3
Explore this ISBN in the AHFE Bookstore ↗Listed in the July 2026 bookstore catalogue; search by ISBN to confirm current availability · Digital book purchase optional