Naomi J. Dunn, Jeffery S. Hickman, Richard J. Hanowski (2022). Crash Trifecta: A Complex Driving Scenario Describing Crash Causation. In: Advances in Human Aspects of Transportation: Part III. AHFE Open Access, vol. 17. https://doi.org/10.54941/ahfe100754
The aim of this study was to investigate the crash trifecta concept to determine if the convergence of multiple elements--rather than a single, unitary critical reason--has greater value in explaining the complexities of crash genesis. Seven existing naturalistic driving (ND) data sets, four of which were from truck-based ND studies and three from light-vehicle ND studies, were combined to ensure a sufficient number of safety-critical events (SCE) for analyses. Two of the three crash trifecta elements (i.e., “unsafe pre-incident behavior” and “transient driver inattention”) were previously reduced and coded; thus, new data reduction was only required for the “unexpected traffic event” variable. After reduction was completed, SCEs were classified in terms of the joint presence or absence of the three trifecta elements. Results indicated the majority of SCEs can be attributed to the combination of at least two of the crash trifecta components. However, higher severity SCEs (i.e., crashes) were more likely to include all three crash trifecta elements. This illustrates that convergence concepts, such as the crash trifecta concept, may lead to a better understanding of the differences in the formation and origin of a crash compared to the traditional approach of assigning a unitary reason, such as the critical reason.
Crash databases compiled from police accident reports and naturalistic driving (ND) studies emphasize the critical reason (CR) as a primary proximal cause in a safety-critical event (SCE) and do not allow room for the specification of any factor other than the CR as directly contributing to crash/event genesis. However, in reality, there is often more than one factor that contributes to the formation of an SCE, which may include ongoing pre-event behaviors or transient, precipitating errors (Bocanegra et al., 2010). An SCE is an event that may be classified as either a crash, near-crash, or crash-relevant conflict (Blanco et al., 2009). The crash trifecta concept does not consider crash genesis as a simple unitary element, but rather a convergence of elements. Specifically, the crash trifecta is defined as three separate, but converging, elements:
1. Unsafe pre-incident behavior or maneuver (e.g., speeding, tailgating, unsafe turn); 2. Transient driver inattention (which may be driving related, such as mirror use, or unrelated, such as reaching for an object); and 3. An unexpected traffic event (e.g., unexpected stopping by the vehicle ahead).
A number of other models exist in the injury prevention field that can be adapted and applied to investigate crash causation. The most widely known of these would be James Reason’s “Swiss Cheese” Model, which moved away from earlier models of human error by accepting that accidents were not solely due to individual operator error (i.e., active errors) but instead involved wider systemic organizational factors (i.e., latent conditions). Active errors were those “where the effect is felt almost immediately,” and latent conditions “tended to lie dormant in the system largely undetected until they combined with other factors to breach system defenses” (Reason, 1990; p. 173). Reason’s model visualized multiple layers of defenses, barriers, and safeguards to prevent error. However, these layers, like slices of Swiss cheese, contain holes. Some of these holes are due to active errors and some are due to latent conditions, but when the holes become aligned, an accident occurs (Reason, 1990). When using this model to investigate crash causation, Knipling (2009) proposed changing the layers from “defenses” to aspects of driver behavior, performance, and the road environment. Thus, the holes in the layers represent driver errors or driving threats, such as driving too fast, tailgating, distraction, slippery patches on the road, and cars cutting in to traffic. When using this model to investigate crash causation, the main drawback is that the holes in the multiple layers need to align for a crash to occur. That is, if there are three layers in the model, then the model can only account for crashes that are the result of errors or conditions occurring in every one of those layers. It cannot account for crashes that are the result of a single error, such as speeding or slippery patches on the road. The crash trifecta concept, on the other hand, classifies SCEs in terms of the presence or absence of each of the three elements. Thus, it accounts for SCEs that are due to a single element or a convergence of elements.
The Haddon Matrix was initially developed as an injury prevention tool but has also been adapted for use in the road safety arena (Mohan et al., 2006). The matrix identifies risk factors before the crash, during the crash, and after the crash, relative to the person, vehicle, and environment. Each phase (i.e., pre-crash, crash, and post-crash) can be analyzed systematically for human, vehicle, road, and environmental factors, thus allowing for the identification of interventions and prevention strategies by phases in time of the event. For the pre-crash phase, interventions or countermeasures would be aimed at preventing the crash from occurring (e.g., vehicle warning systems, such as lane-departure warning systems). For the crash phase, interventions or countermeasures would prevent injury from occurring or reduce the severity of any injury that did occur (e.g., vehicle safety devices, such as airbags or seatbelts). Interventions or activities that occur during the post-crash phase are aimed at reducing the adverse outcomes of the crash (e.g., appropriate medical care and/or rehabilitation; Mohan et al., 2006). The Haddon Matrix is essentially a brainstorming tool designed to generate ideas about interventions, whereas the crash trifecta concept provides a structure for understanding the complexities involved in the genesis of a crash.
The crash trifecta is not a new concept (Knipling, 2009). It has been well established in the transportation safety field that crash genesis involves a convergence of several factors. For example, driving while distracted diverts attention away from the task of driving towards a competing activity (Regan et al., 2009). If the driver is not paying attention to the road, he/she is much less likely to notice an unexpected event, such as a sudden stop in traffic ahead, thereby increasing the likelihood that he/she would be involved in a crash. Thus, the crash trifecta concept implies that the probability of a crash is greater if the three crash trifecta elements are present than if only one of the crash trifecta elements is present. Indeed, a pilot study of the crash trifecta concept by Bocanegra et al. (2010) showed there was a trend in the percent of all three crash trifecta elements being present as the severity of the SCE increased. They analyzed 272 SCEs from two naturalistic truck datasets and found the presence of all three trifecta elements increased with the severity level of the SCE (9.4 percent in crash-relevant conflicts, 20.0 percent in near- crashes, and 25.0 percent in crashes). These pilot results suggest higher severity SCEs are more likely to involve the convergence of multiple elements, and lower severity SCEs may be attributed to a unitary element. Although Bocanegra et al. (2010) also found that only 2.6 percent of SCEs had none of the crash trifecta elements present, nearly half of the SCEs had at least two of the crash trifecta elements present. This study was limited in sample size and used truck-specific data; thus, further research is needed to study the crash trifecta elements in a larger, more diverse data set.
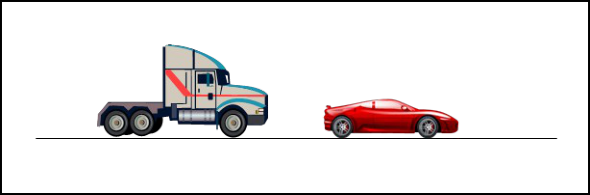
Figures 1 to 4 (adapted from Knipling, 2009) illustrate the crash trifecta concept as a model for an at-fault crash, although it must be noted that it can apply to other types of crashes and all three elements do not need to be present for a crash to occur. Figure 1 depicts the first element in the crash trifecta, which is the unsafe pre-incident behavior. This is essentially a voluntary behavior in which the driver chooses to engage (i.e., the behavior is under the driver’s control) and may be ongoing prior to the SCE. For example, going too fast in relation to other vehicles and/or tailgating are both behaviors that are ongoing and under the driver’s control.
Figure 2 depicts the second element of the crash trifecta, which is transient driver inattention. Transient inattention can occur to any driver. However, the rate and length of these periods of inattention can be diminished by reducing behaviors that are associated with inattention. For example, sending a text message on a cell phone while driving results in the driver taking his/her eyes off the forward roadway for an extended period of time, thereby increasing the risk of being involved in an SCE (Olson et al., 2009).
Figure 2. Transient Driver Inattention (e.g., sending a text).
Figure 3 depicts the third element of the crash trifecta, which is an unexpected traffic event. This refers to a completely random event or unexpected action made by another vehicle. These are events over which the driver has no control, such as a deer running out in front of the vehicle, although such events are more likely to be anticipated in time if the driver is paying attention (Knipling, 2009). As can be seen in Figure 4, the individual elements add together to create a scenario that results in an at-fault crash for the truck driver. It is possible for any one of the crash trifecta elements to be missing for the crash to be avoided. For instance, if the truck driver had his eyes on the forward roadway, he may have noticed the deer on the road; despite the fact that he was tailgating, he may have been able to stop in time or engage in an evasive maneuver that would prevent him from making contact with the lead vehicle. Similarly, if the truck driver had not been tailgating the lead vehicle when the deer appeared on the road, he would have had more time to focus his attention back on the forward roadway and engage in an evasive maneuver to avoid a collision. However, the combination of all three crash trifecta elements creates a scenario whereby a crash is almost unavoidable.
Figure 3. Unexpected Traffic Event (e.g., deer on the road causes lead vehicle to brake suddenly).
Figure available in the original PDF paper.
Figure 4. Outcome: Truck At-Fault Crash.
Figure available in the original PDF paper.
Although the crash trifecta concept seems intuitive, until recently it has been difficult to measure. The data acquisition system used in ND studies collects continuous video and parametric data pertaining to the vehicle, its location, and its distance to surrounding objects during an extended period of time. This presents researchers with the unique opportunity to directly observe driver behavior and vehicle status prior to SCEs to determine convergences of multiple elements, such as the common pattern outlined above in the crash trifecta. The value of the crash trifecta concept and convergence concepts in crash causation is that these concepts provide a structure for understanding the complexities of crash genesis. Thus, the crash trifecta concept may help explain the differences between the genesis of a crash and lower severity SCEs. Additionally, a better understanding of converging elements that lead to a crash may result in countermeasures aimed at preventing or reducing the severity of crashes.
METHOD
Data Set Formatting The crash trifecta model was applied to the SCEs found in existing ND data sets from studies conducted by the Virginia Tech Transportation Institute (VTTI). To increase the statistical power of the study and ensure there were sufficient SCEs for the purposes of analyses, crashes, curb strikes, near-crashes, and crash-relevant conflicts were identified in seven existing ND data sets, four of which were from truck-based ND studies and three from light- vehicle ND studies. Each data set comprised SCEs defined as follows:
Crash: Any contact with an object, either moving or fixed, at any speed in which kinetic energy is measurably transferred or dissipated. Includes other vehicles, roadside barriers, objects on or off the roadway, pedestrians, cyclists, or animals (Fitch et al., 2011).
Curb Strike: Any contact with a curb or median (Fitch et al., 2011).
Near-crash: Any circumstance requiring a rapid, evasive maneuver by the subject vehicle, or any other vehicle, pedestrian, cyclist, or animal to avoid a crash, or any circumstance that results in extraordinarily close proximity of the subject vehicle to any other vehicle, pedestrian, cyclist, animal, or fixed object where, due to apparent unawareness on the part of the driver(s), pedestrian(s), cyclist(s), or animal(s), there is no avoidance maneuver or response. A rapid evasive maneuver is defined as steering, braking, accelerating, or any other combination of control inputs that approaches the limits of the vehicle capabilities (Fitch et al., 2011).
Crash-relevant Conflict: Any circumstance that requires a crash avoidance response on the part of the subject vehicle, any other vehicle, pedestrian, cyclist, or animal that is less severe than a rapid evasive maneuver (as defined above), but greater in severity than a “normal maneuver” to avoid a crash or any circumstance that results in close proximity of the subject vehicle to any other vehicle, pedestrian, cyclist, animal, or fixed object where, due to apparent unawareness on the part of the driver(s), pedestrian(s), cyclist(s), or animal(s), there is no avoidance maneuver or response. A crash avoidance response can include braking, steering, accelerating, or any combination of control inputs (Fitch et al., Human Aspects of Transportation III (2022)
2011).
It is worth noting that curb strikes were technically defined as crashes due to the transfer of kinetic energy that occurs when a vehicle hits a curb. However, there was a great deal of variance in the severity of these SCEs, which sets them apart from the traditional “crash” and warrants the need for a separate grouping. Some curb strikes were less severe than a crash-relevant conflict, such as hitting the curb at a very low speed while parking a vehicle; others were similar to a near-crash, such as hitting the median at a high speed on a freeway.
Data Reduction Data reduction was previously completed on each of the seven ND data sets, which provided one of the variables of interest (i.e., driver behavior). The individual data sets were merged, and an indicator variable was created using the driver behavior variable to allow for easy detection of an unsafe driving behavior. Examples of unsafe driving behavior included: speeding; aggressive driving; improper turning; stop sign or signal violation; drowsy, inattentive, or distracted driving; excessive or sudden braking/stopping; following too close; and illegal passing. Eye-glance data were also previously collected, reduced, and coded; thus, these data were used to assess transient driver inattention. The total time the driver’s eyes were off the forward roadway during the five seconds prior to the SCE was calculated. Similar to Bocanegra et al. (2010), the current study used a threshold of more than one second for the determination of transient driver inattention. Using a threshold of more than one second for the determination of transient driver inattention was consistent with the threshold for a significant increase in the odds of involvement in an SCE, as documented in Olson et al. (2009). Thus, if the driver’s eyes were off the forward roadway for a total of more than one second prior to the triggering event, transient driver inattention was deemed to be present.
The remaining crash trifecta element (i.e., the presence of an unexpected event prior to, or during, the SCE) required new data reduction to be completed. Data analysts examined the 10 seconds of video data prior to the SCE to determine if an unexpected event occurred (with respect to the driver of the instrumented vehicle). An unexpected traffic event would indicate that something unforeseen occurred during the SCE. Examples of an unexpected traffic event included: an animal, object, or debris on the road; another vehicle pulling out in front of the subject vehicle; the lead vehicle braking suddenly; another vehicle cutting in front of the subject vehicle; and changes in traffic occurring while the subject was not paying attention (e.g., traffic moving freely, subject driver looks away, and traffic stops).
RESULTS
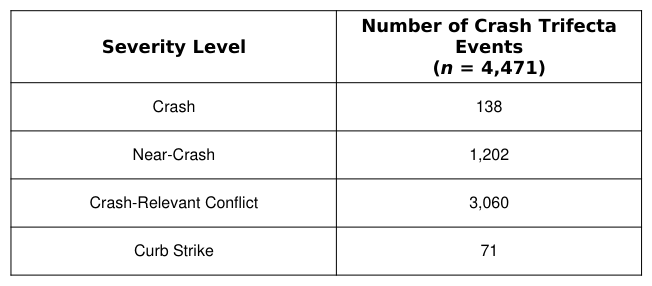
Only those SCEs with data available for all three of the crash trifecta elements were included in the analysis. These were then classified in terms of the joint presence or absence of the three trifecta elements. Table 1 shows the severity level of the 4,471 SCEs included in the crash trifecta analysis.
Table 1: Crash Trifecta Event Classification Number of Crash Trifecta
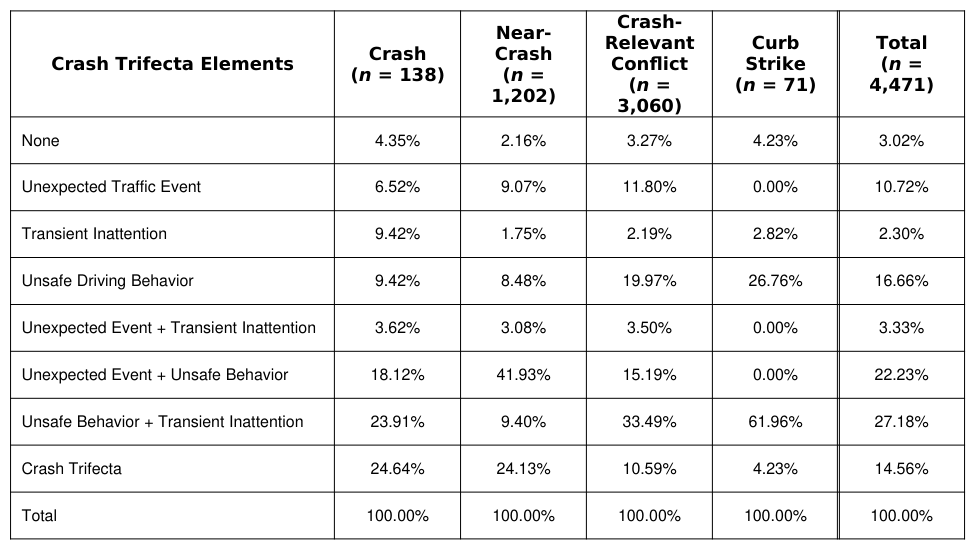
Table 2 shows the presence of crash trifecta elements by the SCE severity. Although only 3 percent of the SCEs had none of the crash trifecta elements present, two-thirds of the SCEs had at least two of the crash trifecta elements present. An example of an SCE displaying none of the crash trifecta elements would be the subject vehicle stopping at a red traffic signal and being rear-ended by the vehicle behind. Approximately one-third of the crash-relevant conflicts were attributable to a combination of unsafe pre-incident driving behavior and transient driver inattention and another one-third had only one of the crash trifecta elements present. More than 40 percent of near-crashes were the result of an unexpected traffic event and unsafe pre-incident driving behavior, and one-quarter of near-crashes included all three crash trifecta elements. Curb strikes were largely attributable to unsafe pre-incident driving behavior and transient driver inattention (62 percent). The majority of crashes (approximately 70 percent) had at least two crash trifecta elements present, and one-quarter included all three crash trifecta elements. The percentage of SCEs having all three crash trifecta elements increased as the severity of the SCE increased (10.6 percent in crash-relevant conflicts, 24.1 percent in near-crashes, and 24.6 percent in crashes [curb strikes were excluded due to the variance in severity]).
Table 2: Crash Trifecta Components by Event Classification Crash- Relevant
CONCLUSIONS
The results of this study clearly show that multiple converging elements need to be considered when investigating crash causation. Although less than one-third of all the SCEs had only one crash trifecta element present (i.e., equivalent to a single CR for an event), approximately two-thirds of all the SCEs had at least two crash trifecta elements present. Additionally, similar to the results of Bocanegra et al. (2010), the results of the current study show that the presence of all three crash trifecta elements increased as the severity of the SCE increased. Almost one- quarter of crashes and near-crashes included all three crash trifecta elements compared to 10 percent of crash- relevant conflicts.
Thus, when determining crash causation, assigning a single, unitary CR as the proximal cause of the SCE without considering additional contributing factors is likely to be a limitation that does not address the complexities involved in the genesis of a crash. Assigning a CR may be suitable for lower severity SCEs, but when investigating higher severity SCEs, the convergence of multiple elements needs to be recognized to adequately represent the complexities involved in the origins and formation of a crash event. Moreover, the crash trifecta concept may be able to assist researchers in determining why a crash occurred compared to a similar situation that resulted in a successful avoidance maneuver, such as a near-crash.
REFERENCES
Blanco, M., Bocanegra, J.L., Morgan, J.F., Fitch, G.M., Medina, A., Olson, R.L., Hanowski, R.J., Daily, B., Zimmerman, R.P.
(2009). “Assessment of a Drowsy Driver Warning System for Heavy-Vehicle Driver: Final Report” (Report # DOT HS 811 117), Washington, D.C.: Federal Motor Carrier Safety Administration. Bocanegra, J., Hickman, J.S., Hanowski, R.J. (2010). “Comparative Analysis of the Large Truck Causation Study and Naturalistic Driving Data” (Contract # DTMC75-07-D-0006), Washington, D.C.: Federal Motor Carrier Safety Administration. Fitch, G.M., Blanco, M., Camden, M.C., Olson, R.L., McClafferty, J., Morgan, J.F., Wharton, A.E., Howard, H.E., Trimble, T.,
Hanowski, R.J. (2011). “Field Demonstration of Heavy Vehicle Camera/Video Imaging Systems: Final Report” (Report # DOT HS 811 475), Washington, D.C.: Federal Motor Carrier Safety Administration. Knipling, R.R. (2009). “Safety for the Long Haul: Large Truck Crash Risk, Causation & Prevention”, Arlington, VA: American Trucking Associations Inc. Mohan, D., Tiwari, G., Khayesi, M., Nafukho, F.M. (2006). “Road Traffic Injury Prevention Training Manual”, Geneva,
Switzerland: World Health Organization. Olson, R.L., Hanowski, R.J., Hickman, J.S., Bocanegra, J. (2009). “Driver Distraction in Commercial Motor Vehicle Operations” (Report No. FMCSA-RRR-09-042), Washington, D.C.: Federal Motor Carrier Safety Administration. Reason, J.T. (1990). “Human Error”, Cambridge, UK: Cambridge University Press. Regan, M.A., Lee, J.D., Young, K.L. (2009). “Driver Distraction: Theory, Effects, and Mitigation”, Boca Raton, FL: CRC Press.
LISTED IN THE AHFE DIGITAL BOOKSTORE CATALOGUE
Explore the complete digital volume
Advances in Human Aspects of Transportation: Part III
Read this individual research paper free through the original publisher, or explore the full digital proceedings book.
ISBN 978-1-4951-2099-2
Explore this ISBN in the AHFE Bookstore ↗Listed in the July 2026 bookstore catalogue; search by ISBN to confirm current availability · Digital book purchase optional