Richard J. Hanowski, Justin F. Morgan, Susan Soccolich, Scott A. Tidwell (2022). Comparing Truck Driving Performance in a Simulator and Instrumented Vehicle. In: Advances in Human Aspects of Transportation: Part III. AHFE Open Access, vol. 17. https://doi.org/10.54941/ahfe100755
Instrumented vehicles record driver behavior and performance as it occurs in the real world. Driving simulators also capture performance, but in conditions meant to approximate the real world. It is unclear the extent to which simulators elicit performance that is comparable to the real world. This study compared driving performance measures that were collected behind the wheel (BTW) of a truck in the real world and from a truck-driving simulator. Both the road and simulator trucks were instrumented with the same data collection equipment and recorded the same driving performance measures. Comparison of overall scores on the road and range tests by test method (BTW and simulator) found test scores differed as a function of test method for drivers trained in a real truck, and in range tests for drivers trained in the simulator. Non-parametric tests indicated the mean rate of lane departures was significantly different between BTW and simulator road tests (p = 0.01); the lane departure rate per minute was 250% greater in the simulator than on the actual road (0.48 vs. 0.19, respectively). Significant differences in scores and measures between BTW and simulator testing indicates that simulation may not be an appropriate platform for testing on-road performance.
The commercial motor vehicle (CMV) industry has forecasted demographic trends that indicate a likely reduction in the number of available qualified CMV drivers (Howard, Zuckerman, Strah, & McNally, 2009). These demographic trends, coupled with a traditionally high driver turnover rate (characteristic of the industry), creates a strong demand for qualified CMV drivers. Dugan (2008) noted that simulation-based training is a potential way of increasing the number of qualified drivers.
For more than a decade, high-fidelity truck driving simulators have become commercially available at steadily decreasing prices. Hartman et al. (2000) reported on two European countries that have successfully implemented simulators as part of CMV driver-training programs. The first, a public/private partnership in France, the Association for the Development of Professional Training in Transport – Institute of Training and Warehousing Techniques (AFT-IFTIM), offers a curriculum combining simulator- and computer-based training in addition to behind-the-wheel (BTW), real-road training. The second, the Stora Holm vocational center in Göteborg, Sweden, uses a similar combination of simulator-, computer-, and BTW-based training for entry-level CMV drivers. In both the AFT-IFTIM and Stora Holm implementations of CMV simulators, results have suggested benefits to simulationbased training. In particular, Hartman et al. report that the AFT-IFTIM program considers 1 hour of simulated driving and 4 hours of BTW driving to be more effective than 8 hours of BTW driving.
Successful implementations such as these have led some motor carriers and driver-training programs in North America to implement CMV simulator-based training programs (Robin et al., 2005a). However, many questions about how these programs are implemented in the much different CMV driver-training and testing environment of the United States remain. Additionally, the comparability of the simulation with regard to real-road performance is not clearly understood.
Simulator and Commercial Driver’s License (CDL) Training A study by Carroll and Dueker (1996) reviewed the state-of-the-art in commercial driving simulation and assessed its readiness for use in commercial driver training. Due to the rapid development of driving simulator technology through the late 1990s, Pierowicz and colleagues (2002) reexamined simulation technologies in order to assess the state-of-the-art and evaluate the capabilities of various simulators to meet commercial driver training needs. The effort involved several tasks, including an extensive literature review, the selection of a candidate truck-driving- training school, selection of an appropriate simulator, and the development and initial testing of training and evaluation units.
A number of benefits from the use of driving simulators to train truck drivers have been identified. For example, driving simulators provide a realistic, yet non-hazardous, replication of the driving experience and have been noted as an area that promises to assist in training future CMV drivers (Brock, Jacobs, Van Cott, McCauley, & Norstrom, 2001). In addition, simulators offer the opportunity to obtain measures of driver performance and behavior in situations that would be rare, difficult, or dangerous to replicate in BTW training. Robin et al. (2005b) summarized the potential benefits of simulator-based driver training as providing for the safety of the driver and vehicle, reproducing driving maneuvers that would be difficult and/or dangerous (even on a skidpad), introducing scenarios that are infrequent within the roadway environment or that would be dangerous for a novice driver, and allowing for a higher level of standardization and repeatability in training curriculums.
Brock et al. (2001) concluded that the effectiveness and efficiency of simulator-based training are its greatest strengths. The efficiency of training is typically higher with simulator-based approaches compared with real truck training. One reason for this is student throughput. While most full-mission truck simulators require a relatively low student-to-instructor ratio, simulation also provides the ability to decrease the amount of time between each student’s training. Additionally, compared with real-truck training, the time required to service and prepare real trucks is reduced, weather-related delays are reduced, and cost savings may be realized due to reduced use of real trucks (reducing maintenance and fuel costs).
However, simulators also bring certain disadvantages, including “simulator sickness” and financial costs. Simulator sickness is a cluster of physical symptoms, such as retinal image slip, nausea, and disorientation associated with the improper stimulation of the vestibular organs (Pausch, Crea, & Conway, 1992). Efforts to predict which simulator users will experience these symptoms have a long history (Kennedy, Fowlkes, Berbaum, & Lilienthal, 1992; Golding, 2006), yet even with advances in simulator capabilities some users still experience simulator sickness. There are also financial costs specifically associated with simulator-based training. Computer-based driving simulators have maintenance and reliability costs associated with the hardware and software. Additional costs are associated with training for instructors, maintenance, and instructional designers. Therefore, simulators have associated costs beyond the initial purchase of the equipment.
Entry-level CDL Training As of the time of this study, there were different types of entry-level training options available to CDL candidates in the United States. The primary goal of this training is to teach CDL candidates about basic vehicle operation so that they can pass a standardized CDL exam. Training options include:
Conventional Training – Defined as conventional, BTW (i.e., real-world) training certified by the Professional Truck Driver Institute (PTDI; 1999).
Simulator Training – Defined as simulator-based, PTDI-certified, training with 58% of driving time spent in a simulator and 42% of driving time spent BTW.
Informal Training – Defined as unstructured training provided outside of formal training settings, with non- professional trainers (e.g., drivers trained by friends or family members).
CDL-focused Training – Defined as short, CDL-exam focused, truck-driver-training courses.
A study funded by the Federal Motor Carrier Safety Administration (FMCSA) in the United States was conducted to determine how these four different entry-level training types compare in terms of skill acquisition and forward transfer of training to on-the-job driver performance (Morgan et al., 2011). The Morgan et al. study investigated the relationship between type of training method and actual job performance through a longitudinal follow-up of participants in the entry-level study. In addition, the Morgan et al. study demonstrated the advanced capabilities of a training simulator to determine the appropriateness of simulation for testing CMV drivers on particular maneuvers (e.g., emergency maneuvers and extreme conditions) and vehicle configurations (e.g., vans, tankers, and doubles trailers).
The current paper is based on a previous examination of two (conventional and simulator training) of these four training types (Morgan et al., 2011). While the previous work examined skill acquisition, the current work focuses on comparing the unique set of driver performance measures that were collected during the study. In particular, the aim of this paper is to present driving performance data to compare and contrast measures collected with the simulator and in the real world. The comparison of these two approaches (simulator and real world) is important in terms of simulator validation. Only with simulator validation can results collected from simulators be generalized to the real world, and simulator validity can only be thoroughly understood by comparing the same driver’s performance in both the simulator and real-world driving. Validating driving simulators allows for a better understanding of the strengths, limitations, and proper applications of these tools.
METHODS
Participants
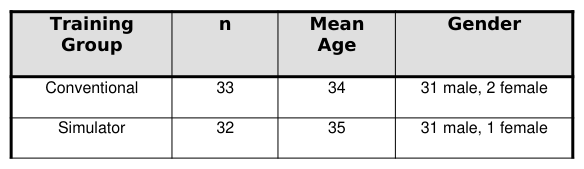
Table 1 outlines the participants in the Morgan et al. (2011) study used in the present analysis. A total of 65 participants were included across the two groups. Participants were enrolled in an entry-level truck-driver-training program (training in preparation for testing for a Class-A CDL) at a community college, Delaware Technical Community College (DTCC). DTCC agreed to integrate simulation into their curriculum as part of this study, and the program’s PTDI certification was extended to participants training in the simulator for the purposes of the study. No participant had prior experience operating a CMV of this type or operating other large articulated vehicles (with the exception of off-road/farm equipment). All research participants were volunteers and provided with informed consent prior to participation. Due to simulator sickness, data from a small number of participants was not included on a per-analysis basis.
Table 1: Participant demographics for entry-level training groups Training n Mean Gender
Entry-level Training Curriculum Participants in the conventional training group received full-curriculum, entry-level training. These participants received 50 hours of BTW training in an actual tractor-trailer and 147 hours of classroom instruction during this PTDI-certified program. The entire duration of the training course was 8 weeks, including all classroom instruction (which includes instruction on vehicle systems, theory of vehicle operations, log books, and FMCSA regulations), range driving (backing maneuvers), and road driving. Similar to the conventional group, participants in the simulator group followed the same full-curriculum, entry-level training. However, they received 42% (23 hours) of their practice driving time in a real tractor-trailer and 58% (32 hours) in a simulator while also receiving the same 147 hours of classroom instruction.
Over the 8 weeks of training, participants were enrolled in an 8-week-long range training course and two 4-week- long road driving courses. The instructors followed the same road and range course syllabi, objectives, and lesson plans while training students in the simulator. These instructors trained and “coached” the students just as they would in the real truck; however, the additional features available through simulation (e.g., overhead view and replay) were used. No training or “coaching” was provided on testing days for either BTW or simulator. Only route directions (i.e., road test) and testing procedures were explained to the students. A full description of the curriculum and training process is provided in Morgan et al. (2011).
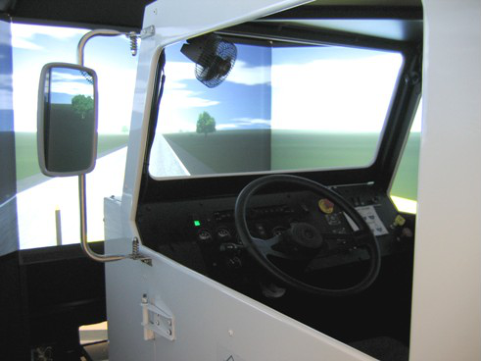
Driving Simulator and BTW Tractor-Trailers An FAAC, Inc., model TT-2000-V7 driving simulator was selected for use in this study. This simulator provided a 225° seamless (borderless screens) forward field of view with five forward visual channels. Two rear visual channels provided views through the use of real mirrors (Figure 1). Multiple transmission configurations, different trailer length settings, and multiple engine configurations were also provided. These requirements were established during earlier research efforts (Robin et al., 2005a; Robin et al., 2005b). Additional details of the simulator and simulator scenarios can be found in Morgan et al. (2011).
Figure 1. The TT-2000-V7 driving simulator (left) and the rear visual channel as viewed through the simulator mirrors (right).
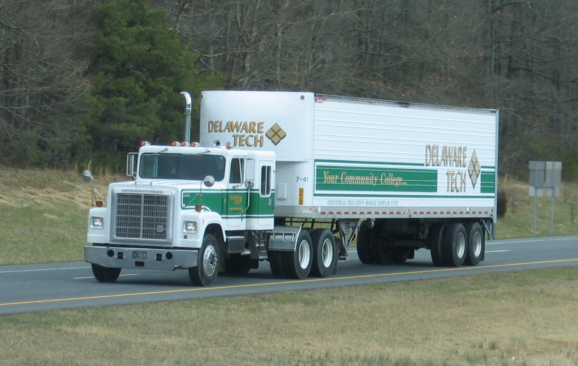
The training program had three Class-8 tractors with trailers for road use, along with other tractors for range driving, that were used for this study. Figure 2 shows a photo of one of the training road trucks used in the study. Road trucks were a 2001 Freightliner Business Class (four door) with a Meritor-Wabco 10-speed transmission, a 1984 International Transtar with an Eaton-Fuller 9-speed transmission, and a 1990 International Transtar with an Eaton- Fuller 9-speed transmission. The trailers used by students included a 40-foot (12.2 m) van, a 45-foot (13.7 m) flatbed, and a 48-foot (14.6 m) refrigerated van.
Figure 2. One of three Class-8 tractors used on roads at the DTCC facility.
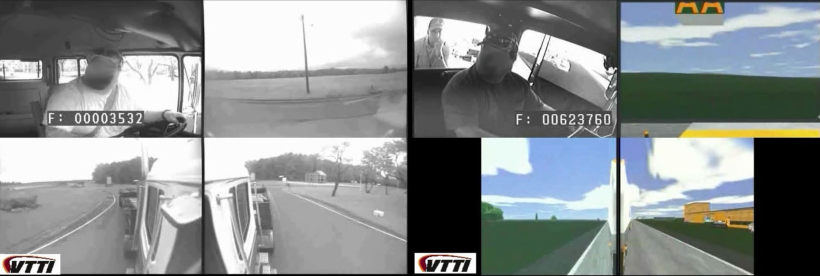
Data Acquisition System Each truck was outfitted with a full suite of instrumentation and a data acquisition system (DAS). The DAS is a centralized data collection device that has been successfully used in a number of naturalistic driving studies (see Blanco, Hickman, Klauer, & Hanowski, 2006). The DAS unit was mounted unobtrusively and was not visible to the driver or passengers. The DAS collected all data continuously at 10 Hz. Four video cameras were installed on each truck to provide a wide angle of the truck cab and driver’s face, the forward-facing view out the windshield, and the view down each side of the truck (from two cameras). In addition to being installed in each of the three road trucks and one range truck, an identical DAS was used to collect data from the driving simulator network. Besides collecting equivalent sensor data from the simulator network, the video recording on the simulator DAS was configured to record views similar to those recorded in BTW driving. This allowed for a comparison of data collected from the real trucks with data collected in the driving simulator using the same analysis tools. An example of the video recorded from the DAS installed in the real truck and in the driving simulator is provided in Figure 3.
Figure 3. Split screen image of the camera views for the BTW (left) and simulator (right).
Measures
A number of measures were collected from drivers, including both performance and subjective measures. Details of these can be found in Morgan et al. (2011). For the purpose of the analysis for this paper, the road and range tests administered BTW and in the simulator are examined. Both BTW and simulated road and range tests were administered at the training facility and scored using the same criteria as the Delaware Division of Motor Vehicles (DMV) tests (the test score sheets can be found in Morgan et al.). Additionally, both tests were administered using the American Association of Motor Vehicle Administrators (AAMVA) CDL examiner’s manual (AAMVA, 2005). The road test events were captured by the DAS (video and sensors) and independently validated by an external examiner.
The road test involved the participant driving the vehicle on a predetermined route while being observed by the CDL examiner. Participants were scored on 13 aspects of driving performance: (1) general driving (e.g., shifting, gear grinding, steering, and braking), (2) left lane changes, (3) right lane changes, (4) left turns, (5) right turns, (6) road side pull-offs, (7) railroad crossings, (8) serious errors (e.g., traffic violations, dangerous actions, putting the vehicle on sidewalks or curbs), (9) road sign compliance, (10) stopping/braking performance, (11) intersection performance, (12) left curves, and (13) right curves. This test was administered in an identical fashion across the two platforms by the same instructors.
In addition, the DAS data captured as part of the test were examined for instances of lane departure (LD), defined as an event in which the truck or trailer crossed the boundaries of the intended travel lane due to improper driver control or driver inattention. LDs are an interesting safety surrogate measure for entry-level truck drivers as the process of controlling an articulated vehicle that can exceed 20 m in length is novel for all drivers in the study. These LD data were obtained from the side-mounted cameras (directed toward the lateral edges of the truck and trailer) or the simulator image generators and the DAS’s onboard lane detection system.
The range test is an assessment of the participant’s ability to back the articulated vehicle (i.e., drive in reverse) into common parking and docking configurations safely and without damage to the truck, trailer, or facility. Participants were scored on six range maneuvers: (1) straight line backing, (2) off-set left backing, (3) off-set right backing, (4) alley docking, (5) side-sight parallel parking, and (6) conventional parallel parking. As with the road test, this test was administered in the same fashion across the two platforms by the same instructors.
RESULTS
The results presented herein focus on three analysis areas: (1) overall scores on road and range tests, (2) scores on the 13 items of the road test, and (3) road test “events,” defined here as LDs. Each analysis area is presented in turn.
Overall Scores on Road and Range Tests
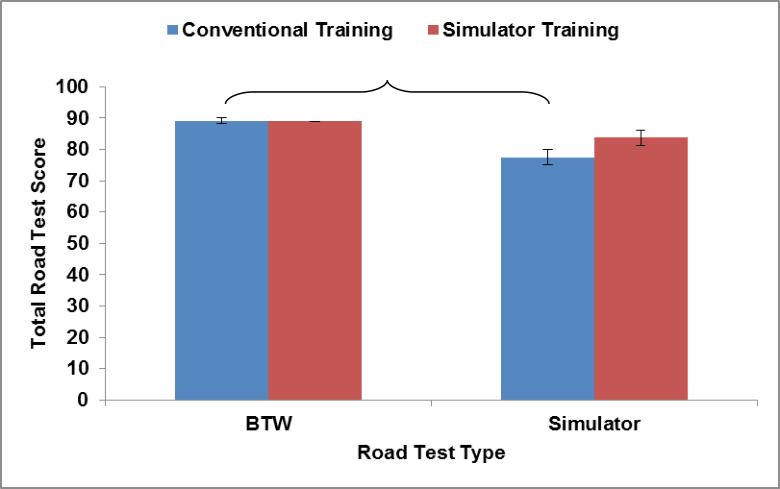
Figure 4 shows the results of the tests of the conventional and simulator groups for the road test. The two columns on the left are for the road test that occurred BTW, while the two right columns represent the scores for the road test in the simulated world. As can be seen, for the BTW road test, the scores for both groups were almost identical. The conventional group had a mean BTW road test score of 89.1% (SD = 5.5), while the simulator group had a mean test score of 88.9% (SD = 0.1). No statistically significant differences between groups were present. Similar results were found for the simulated road test, with the conventional group having a mean test score of 77.5% (SD = 13.6) and the simulator group having a mean test score of 83.7% (SD = 13.8). As before, this difference was not statistically significant. Comparing performance of each group across the two test methods revealed that performance on the two versions of the road test differed significantly for the conventional group, t(28) = 3.56, p = .001, with higher performance demonstrated in the BTW test. This was not the case for the simulator group, which did not show a significant difference between BTW and simulator road tests, t(31) = 1.53, p = .137. Note that data were only included for participants who completed both tests.
Figure 4. Mean BTW truck and simulator road test scores, by group. Error bars represent standard error.
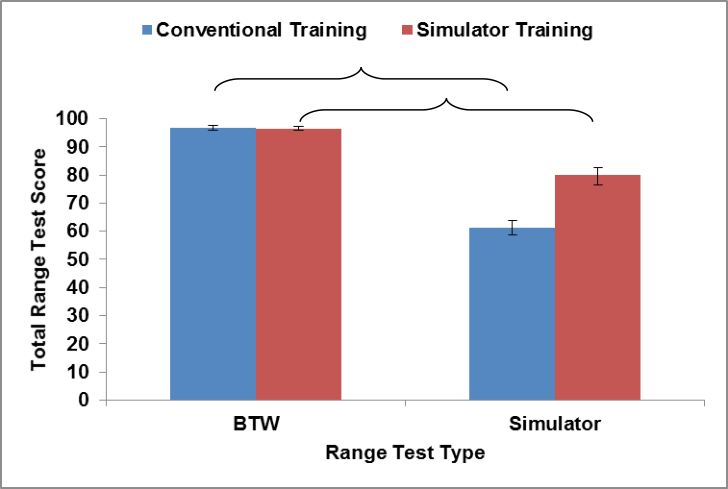
Figure 5 outlines the results for the range tests for the conventional and simulator groups, for each of the test environments (BTW and simulator). For the BTW range test, the conventional group had a mean score of 96.7% (SD = 5.23), while the simulator group had a mean score of 96.5% (SD = 3.83). This difference was not statistically significant. For the simulated range test, the conventional group had a mean score of 61.1% (SD = 14.6), while the simulator group had a mean score of 79.9% (SD = 19.9). This difference was statistically significant, t(63) = 4.35, p < .0001. Comparing performance of each group between the two test methods revealed that performance on the two versions of the road test differed significantly for both the conventional group, t(28) = 12.84, p < .0001, and the simulator group, t(31) = 5.14, p < .0001. Performance was higher in the BTW test for both groups. Note that data were only included for participants who completed both tests.
Figure 5. Mean BTW truck and simulator range test scores, by group. Error bars represent standard error.
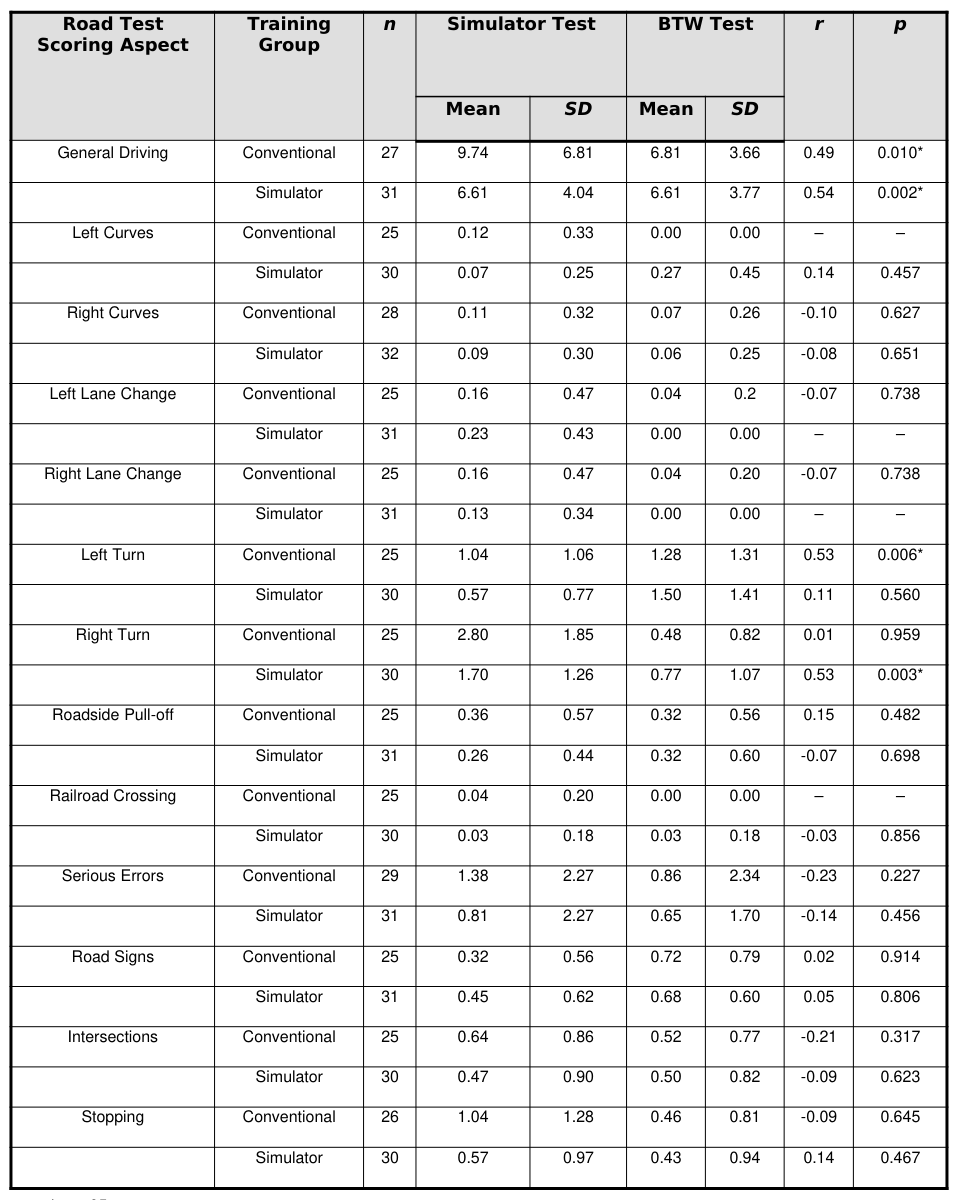
Scores on the 13-item Road Test This section provides an examination of the 13 items composing the overall road test score. Pearson product– moment correlations and descriptive statistics for both BTW and simulator road test scores across groups are provided in Table 1. Correlations between the scored aspects of the BTW and simulator road tests were calculated. Significant correlations were observed in the conventional training group in the general driving and left turn categories (r = 0.49 and 0.43, respectively). Significant correlations were observed in the simulator training group in the general driving and right turn categories (r = 0.54 and 0.53, respectively). In some cases no participants in a group passed the section or all participants in a group passed a section; thus, some correlations could not be calculated.
Proceedings of the 5th International Conference on Applied Human Factors and Ergonomics AHFE 2014, Kraków, Poland 19-23 July 2014 Edited by T. Ahram, W. Karwowski and T. Marek
Table 1: Descriptive statistics and correlations for scored aspects of simulator and BTW test scores by training group
* p < .05
Using a Wilcoxon signed rank test performance on the BTW road and the simulator road test, scoring aspects
Proceedings of the 5th International Conference on Applied Human Factors and Ergonomics AHFE 2014, Kraków, Poland 19-23 July 2014 Edited by T. Ahram, W. Karwowski and T. Marek
(shown in the Road Test Scoring Aspects column of Table 1, above) were individually compared for the conventional and simulator training groups. For the conventional training group, results indicated that significant differences were present for general driving, t(26) = −2.55, p = 0.02; road sign compliance, t(24) = 2.09, p = 0.048; and right turns, t(24) = −5.76, p < 0.0001. The conventional training group had more general driving demerit points, more right turn error points, and fewer road sign error points, when testing in the simulator versus BTW road testing.
For the simulator training group, significant differences were present for left curves, t(29) = 2.26, p = 0.03; left turns, t(29) = 3.34, p = 0.002; right turns, t(29) = −4.47, p = 0.0001; left lane changes, t(30) = −2.96, p = 0.006; and right lane changes, t(30) = −2.11, p = 0.04. The simulator training group had fewer left curve and left turn errors, and greater right turn, left lane change, and right lane change errors, when testing in the simulator versus BTW road testing.
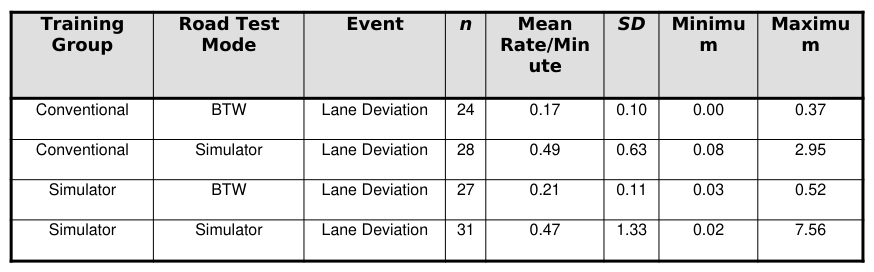
Lane Departure Events Using the frequency of LDs and the duration (in minutes) of each test, rates were calculated. Table 2 shows the rate per minute of LDs for each test mode across both groups. As can be seen, the rate values were higher in the simulation compared with the BTW test. Collapsing over the training group conditions, the mean LD rate per minute for the BTW test was 0.19 (SD = 0.11), while the rate for the simulated road test was 0.49 (SD = 1.06).
Table 2: Event rates by group membership and test modality
DISCUSSION
With the expectation of a future shortage of qualified CMV drivers, coupled with the high turnover rate that is typical of the trucking industry, the interest in training entry-level drivers has become a prominent issue. Advancements in driving simulator technology hold promise in efficiently training CDL candidates on tractor-trailer operation. However, before simulator-based training programs are implemented, it is imperative to understand the performance differences between simulator and real-world driving, yet limited research has been conducted to validate measures collected from CMV simulators with BTW, real-world driving. This study adds to the body of literature on this topic.
This paper focused on three analyses from data collected from a larger study on CMV driver training using simulation (Morgan et al., 2011). These analyses aimed to compare the driving performance of CDL students between simulator and real-truck platforms. To compare driving performance across platforms, the research (1) compared scores from the road and range tests, (2) compared scores on the 13 items that constitute the road test, and (3) compared road test “events,” which were unintended LDs. For the first focus area, for both the road test and the range test, test scores varied across platforms. Drivers, regardless of training type, performed worse on the simulator implementation of the range test compared with the BTW implementation of the same test. Additionally, drivers who trained BTW had worse performance on the road test in the simulator compared with the same test in a physical (BTW) truck. Interestingly, though perhaps not surprising, drivers who trained in the simulator had equivalent performance between simulator and BTW truck implementations of the road test. These findings suggest that the simulator is not likely to be a good mechanism for testing drivers for either road or range tests as performance in the simulator environment is lower across both groups, yet not in a uniform fashion. Thus, testing in a simulator is likely
Proceedings of the 5th International Conference on Applied Human Factors and Ergonomics AHFE 2014, Kraków, Poland 19-23 July 2014 Edited by T. Ahram, W. Karwowski and T. Marek
to provide an outcome that may not generalize to real-road driving. Although no difference between road tests was found for drivers who trained in the simulator, differences between BTW and simulator tests were still observed in the range test. However, it should be noted that drivers trained in the simulator had skill performance equivalent to those trained in a real truck when tested in the real world, suggesting that there was no disbenefit to simulator training for these drivers.
The second analysis focus area looked deeper into the road test results and examined scores on the 13-items of the road test. Scores for each group in both the simulator and the BTW road tests were compared. The results show that very few aspects of driving displayed significant correlations between the two environments. Of the 13 items, only general driving displayed a significant correlation between testing environments for both training groups. The conventional group had a correlation of r = .49 (p = .01), while the simulator group had a correlation of r = .54 (p = .002). Significant correlations were also observed in the conventional group for left turns (r = .53, p = .006) and in the simulator group for right turns (r = .53, p = .003). This comparison further illustrates whether a simulator-testing environment may be appropriate for drivers trained in a BTW environment, and if simulator-trained drivers can be tested in a simulator. This finding suggests that the tests were not equivalent, and that drivers trained in a BTW setting will not have equivalent performance in simulator and BTW tests of road-driving skills. Similarly, drivers trained in a simulator will not have equivalent performance in simulator and BTW tests of road-driving skills.
The third analysis area looked at unintended LD “events” recorded across platforms in the road test. For this analysis, LD was used as a surrogate safety measure for its utility as a measure of driver performance as well as a comparative measure of safety in other on-road studies. Poor validity was found in this comparison whereby the rate for LDs was much higher in the simulator compared to the BTW road test. Strikingly, LDs were 250% greater in the simulator compared to the BTW road test (0.48 LDs/min vs. 0.19 LDs/min, respectively). Interestingly, the group that trained on the simulator had an equivalent LD rate per minute as the group that had no simulator training (0.47 LDs/min for the simulator-trained group versus 0.49 LDs/min for the conventional group; p > .05).
Collectively, these results suggest that there are notable differences in driving performance measures when comparisons are made between simulator and BTW platforms. Moreover, the differences between the two platforms suggest that simulation may not be an appropriate platform for evaluating (testing) on-road performance. Drivers may not perform in the real world as they perform in a simulator, even in test conditions, where (albeit presumably) drivers are trying their best. Differences in measures suggest that the two platforms are not interchangeable and do not, in all conditions, capture driving performance equivalently.
As the findings of the Morgan et al. study (2011) reveal, no negative transfer-of-training was found for the entry- level CDL candidates who were trained primarily in the driving simulator. BTW test scores (both road and range) indicate no significant effects between the training method (simulator versus conventional), thus showing a positive transfer-of-training from the use of the driving simulator. However, understanding the differences between driver training and empirical research are critical. Beyond training, the results of the study indicate that caution is warranted when generalizing driving performance results from simulators to real-world operation. The magnitude, and potentially direction, of findings can differ between simulator and real-world driving performance. Researchers who utilize driving simulators in their studies must be aware that findings from the simulator will not necessarily transfer to real-world driving. Therefore, the generalizability of simulator findings, particularly those that have not been validated against a road vehicle, must be carefully considered.
REFERENCES
American Association of Motor Vehicle Administrators (AAMVA). (2005). Model CDL Examiner’s Manual; Field Test Version.
Arlington, VA: Author. Blanco, M., Hickman, J. S., Klauer, S. G., & Hanowski, R. J. (2006). The new generation human factors naturalistic driving research: A proactive approach to enhance safety. Proceedings of the 6th Annual Intelligent Vehicle Systems Symposium. National Defense Industrial Association. Brock, J. F., Jacobs, C., Van Cott, H., McCauley, M. E., & Norstrom, D. M. (2001). Simulators and bus safety: Guidelines for
acquiring and using transit bus operator driving simulators (Transit Cooperative Research Program, Report 72). Washington, DC: Transportation Research Board. Carroll, R. J., & Dueker, R. L. (1996). Commercial Motor Vehicle Simulation Technology to Improve Driver Training, Testing, and Licensing Methods (Report No. FHWA-MC-96-003). Washington, DC: USDOT, FHWA Office of Motor Carriers. Dugan, R. T. (2008, October 6). Training, turnover [Letter to the editor]. Transport Topics, p. 9.
Proceedings of the 5th International Conference on Applied Human Factors and Ergonomics AHFE 2014, Kraków, Poland 19-23 July 2014 Edited by T. Ahram, W. Karwowski and T. Marek
Hartman, K., Pritchard, R., Jennings, K., Johnston, J., Knipling, R. R., et al. (2000). Commercial Vehicle Safety – Technology and Practice in Europe (Document no. FHWA-PL-00-010). Washington, DC: USDOT, FHWA, Office of International Programs. Howard, J., Zuckerman, A., Strah, T. M., & McNally, S. (2009, February 16). Trucking’s growing job losses. Transport Topics,
p. 6. Kennedy R. S., Fowlkes, J. E., Berbaum K. S., & Lilienthal M. G. (1992). Use of a motion sickness history questionnaire for prediction of simulator sickness. Aviation, Space, and Environmental Medicine, 63(7), 588–593. Morgan, J. F., Tidwell, S. A., Medina, A., Blanco, M., Hickman, J. S., & Hanowski, R. J. (2011, April). Commercial motor
vehicle driving simulator validation study (SimVal): Phase II (Report No. FMCSA-RRR-11-014). Washington, DC: Federal Motor Carrier Safety Administration. Retrieved from: http://www.fmcsa.dot.gov/facts-research/research-technology/report/ Simulator-Validation-Study-report.pdf Pausch, R., Crea, T., & Conway, M. (1992). A literature survey for virtual environments: Military flight simulator visual systems and simulator sickness. Presence: Teleoperators and Virtual Environments, 1, 344–363. Pierowicz, J., Robin, J., Gawron, V., Watson, G., Nestor, B., & Murphree, W. (2002). Commercial truck simulators re-
assessment and evaluation (Report No. FMCSA RT-03-008). Washington, DC: USDOT, FMCSA Office of Research and Technology. Professional Truck Driver Institute (PTDI). (1999, September). Curriculum standard guidelines for entry-level tractor-trailer driver courses. Alexandria, VA: Author. Robin, J. L., Knipling, R. R., Tidwell, S. A., McFann, J., Derrickson, M. L., & Antonik, C. (2005a). FMCSA Commercial Truck
Simulation Validation Study Phase I Pilot Test: Driving Scenario Definition and Development. Driving Simulation Conference, North America 2005. Orlando, FL. Robin, J. L., Knipling, R. R., Derrickson, M. L, Antonik, C., Tidwell, S. A., & McFann, J. (2005b). Truck simulator validation (“SimVal”) training effectiveness study. Proceedings of the 2005 Truck & Bus Safety & Security Symposium (pp. 475–483). Alexandria, VA: National Safety Council.
LISTED IN THE AHFE DIGITAL BOOKSTORE CATALOGUE
Explore the complete digital volume
Advances in Human Aspects of Transportation: Part III
Read this individual research paper free through the original publisher, or explore the full digital proceedings book.
ISBN 978-1-4951-2099-2
Explore this ISBN in the AHFE Bookstore ↗Listed in the July 2026 bookstore catalogue; search by ISBN to confirm current availability · Digital book purchase optional