Nick Reed, Charlene Hallett, Stephanie Cynk, David Jenkins (2022). An Evaluation of the Use of Odds Ratios to Estimate the Association between Mobile Phone Use and Safety Critical Driving Events. In: Advances in Human Aspects of Transportation: Part III. AHFE Open Access, vol. 17. https://doi.org/10.54941/ahfe100758
This paper investigates the odds ratios for mobile phone use when driving for a sample of vehicles from fleets in the USA, UK, and New Zealand, employing a similar protocol to that used by Hickman, Hanowski & Bocanegra (2010). The event data was collected from vehicles of various types, ranging from commercial to private vehicles. Vehicles used the SmartDrive in-vehicle camera and telematics systems to record video, audio, location and speed information in response to kinematic triggers. Data was reviewed at SmartDrive by trained observers and coded for the safety criticality of the event (safety critical event (SCE) vs. baseline epoch (BE)) and the associated factors observed over the time-course of the event. The SmartDrive dataset comprised a total of 103,264 epochs recorded from the start of April 2012 until mid-October 2013 and was evaluated by SmartDrive expert reviewers. Of this total number of epochs, 14,097 were classified as SCEs and 89,167 as BEs. SmartDrive provided data on the incidence of events and associated factors to TRL for further analysis, particularly for tasks relating to mobile phone use. Similar to the findings of Hickman, Hanowski & Bocanegra (2010), handsfree mobile phone use was associated with a significant odds ratio of less than one for the occurrence of a SCE. In contrast to the findings of Hickman et al. (2010), results from this investigation revealed that both handheld mobile phone use and manual interaction with the mobile phone (texting/dialling) were also associated with a significant odds ratio of less than one. These results are used to discuss the advantages and disadvantages of the use of naturalistic driving data, the method of classification employed by trained observers, and the use of odds ratios as an approach for investigating the effects of engagement in secondary tasks while driving has on driver behaviour and driving performance.
Driver distraction and inattention are assigned as contributory factors in a significant number of vehicle incidents. In the UK, statistics about contributory factors in vehicle collisions are recorded in a standardised form, known as STATS19. This enables police officers attending road crashes to ascribe contributory factors to the collision. The most recent statistics from the UK - Reported Road Casualties in Great Britain – RRCGB (2011) - indicated that 6.4% of fatal vehicle crashes and 4.2% of all collisions attended by police had ‘distraction’ reported as a contributing factor. The assignment of ‘distraction’ as a contributory factor in vehicle accidents, however, is likely to be an underestimate due to the difficulties an attending police officer may have in determining that distraction was indeed a contributory factor. This is highlighted by a passage from the RRCGB annual report:
The contributory factors are largely subjective and depend on the skill and experience of the investigating officer to reconstruct the events which directly led to the accident. They reflect the attending officer's opinion at the time of reporting and are not necessarily the result of extensive investigation.
RRCGB, 2011 Post-vehicle crash statistics provide one measure of the prevalence of contributing factors that are associated with vehicle collisions. Several studies have been conducted to examine the association between mobile phone conversations while driving and vehicle collisions. One of the most frequently cited studies, conducted by Redelmeier and Tibshirani (1997), found that mobile phone use when driving was associated a fourfold increase in collision risk. However, Young’s (2011, 2012a, 2013a) reanalysis of their work suggested that this risk was possibly an overestimate due to biases in the driving characteristics of the observed drivers.
Collision statistics and epidemiological studies offer little explanation as to how an associated factor ‘contributed’ to the occurrence of an crash. An alternative approach to investigating how driver distraction effects might contribute to the occurrence of vehicle collisions is through controlled performance tests that require participants to engage in a secondary task (the potential distraction) whilst engaged in a primary task that taps the cognitive resources involved in driving. In an on-road driving task, Brown and Poulton (1961) studied the ‘mental capacity’ of car drivers using a subsidiary task, finding that drivers made more errors on an auditory task when driving in an urban environment but their driving performance was apparently unchanged when compared to a control condition. More recently, laboratory studies to investigate driver distraction by mobile phone conversations have used tracking tasks (e.g. Strayer, Drews, Albert & Johnston, 2001) and driving simulators (e.g. Alm & Nilsson, 1994; Alm & Nilsson, 1995; Burns, Parkes, Burton, Smith & Burch, 2002; Strayer, Drews & Johnston, 2003) as a surrogate for real driving. Such studies have produced generally consistent findings that mobile phone conversations are associated with slowing of reactions and reductions vehicle control within the simulator task, and that hands-free mobile phone use does not eliminate or substantially reduce this impairment (see Horrey & Wickens, 2006 for review).
The results of these laboratory studies have been persuasive, leading to the introduction of legislation outlawing handheld mobile phone use when driving for many national road authorities and corporate health and safety bodies. A key benefit of this type of approach is that participants can be placed in driving situations that would be considered risky if conducted in the equivalent ‘real’ situation. This brings with it the criticism that the demands of the surrogate ‘driving’ task may be very different to those of normal, real-world driving. Often, participants are required to engage in contrived driving tasks that are useful for investigating dual-task decrement of mobile phone use but may not represent a fair reflection of how a driver may choose to adapt their driving behaviour when engaged in a secondary task. Furthermore, in a simulator, where there is no threat of any real harm, drivers may (consciously or subconsciously) engage in more risky behaviour than that in which they might be willing to engage in the real world.
The 100-car study, by Dingus, Klauer, Neale et al (2006), offered an alternative approach for investigating driver distractions. Dingus et al. (2006) equipped cars belonging to members of the public with monitoring equipment (cameras, Global Positioning System (GPS) location, radar, accelerometers, etc.) and recorded outputs from these systems over a one-year period in which the participants used their car normally. This naturalistic approach enabled the authors to observe the frequency and impact of secondary tasks on driver behaviour in the real world. Whereas a police officer must try to assess contributing factors to a road accident retrospectively, researchers could observe what was occurring inside and outside the driven vehicle as risky situations emerged. A variety of triggers were devised based on the outputs of the vehicle monitoring systems to highlight data that would be subject to further in- depth analysis. They defined different levels of severity of crash and near-crash events, referred to collectively as ‘safety-critical events’ (SCEs), and examined selected instances of non-safety critical driving epochs to act as baseline data for comparison. Olson, Hanowski, Hickman, and Bocanegra (2009) applied a similar approach to examine the safety of commercial vehicle operations, monitoring the naturalistic driving behaviour of 203 commercial vehicle drivers.
Examining the relative frequency of SCEs in the presence/absence of particular secondary tasks permits calculation of odds ratios to quantify the association between the secondary task and the occurrence of SCEs. Using odds ratios to quantify the association between actions/outcomes originates in medical trials where a clinician may be interested in the relative occurrence of an illness or outcome (e.g. death) across different treatment groups. For naturalistic driving studies, if the odds ratio for a secondary task has a value higher than 1.00 (and where the lower 95% confidence interval for the ratio is greater than 1.00), it suggests that the secondary task was associated with an increased likelihood of an SCE. If 1.00 is within the upper and lower 95% confidence intervals of the odds ratio, it indicates that SCEs are no more or less likely when the driver was engaged in the secondary task. An odds ratio of less than 1.00 (and where the upper 95% confidence interval for the ratio is less than 1.00) suggests that SCEs are less likely when the driver is engaged in the secondary task – that performing the secondary task appears to have a protective effect.
Olson et al. (2009) found that use of a mobile phone to send a text message produced an odds ratio of 23.24 for the likelihood of a SCE – SCEs were 23 times more frequent when a driver was text messaging than when no other distractions were present. This corresponds with laboratory studies that have shown text messaging to be significantly detrimental effect to driving performance (e.g. Reed & Robbins, 2008). However, some odds ratios were contrary to the results observed in laboratory studies. Conversation on a handheld phone was found to have an odds ratio of 1.04, suggesting there was no increase in the risk of a SCE observed when drivers were engaged in handheld phone conversations. Furthermore, conversation on a handsfree phone was found to have an odds ratio of 0.44. This value, significantly less than 1, suggests that handsfree phone use results in drivers having fewer SCEs; that handsfree conversations whilst driving have a protective effect, reducing the likelihood of collision. This suggests that, unlike laboratory studies, when drivers had the freedom to adapt their behaviour to the prevailing conditions and chose when to make handsfree calls; it resulted in driving behaviour that was associated with a lower frequency of SCEs.
The Olson et al. study drew upon a large dataset of more than three million miles of driving data from trucks and commercial vehicles, this generated 4,452 SCEs (and 19,888 baseline epochs for comparison). Once these had been categorised according to secondary tasks that were present, it could be argued that the number of SCEs and baseline epochs studied may have been insufficient to produce representative results. For example, the odds ratio result for text messaging was based on 31 SCEs and 6 baseline epochs.
To address this concern, Hickman, Hanowski & Bocanegra (2010) used data supplied to them by a fleet management and driving safety technology provider, DriveCam, which supplies on-board monitoring systems to commercial fleet operators. Like the naturalistic driving studies, these systems use a variety of sensors to monitor vehicle parameters and two cameras to record the view ahead and the view inside the vehicle cab. Unlike the Dingus et al. and Olson et al. studies, the DriveCam systems do not record all data continuously. Based on kinematic triggers, they recorded 8 seconds before- and 4 seconds after the trigger point. The sensor and video data for this period is then reviewed by trained observers (driver risk analysts) to identify the severity of the incident (e.g. crash, near-crash or if no incident is observed baseline) and the presence of driver engagement in any secondary tasks (e.g. driver using handheld phone). Whilst the researchers have less comprehensive information with which to assess driver behaviour, they have a much larger dataset to analyse: Hickman et al.’s dataset ‘B’ (dataset ‘A’ from Hickman et al. (2010) did not include baseline epochs and so did not permit calculation of odds ratios) represents the activity of 13,306 vehicles over a period of three months and includes around 40,000 SCEs and more than 210,000 baseline epochs. A baseline epoch in this case is an instance where the device was triggered but in the absence of any safety critical driving/vehicle behaviour.
Hickman et al. produced odds ratios for tasks relating to phone use. Their category ‘Texting/E-mailing/Accessing the Internet’ produced a large odds ratio of 163.59 – suggesting that this type of phone use was associated with a huge increase in the likelihood of an SCE. ‘Talking/listening on a handheld phone’ had a non-significant odds ratio of 0.89. Like Olson et al., it suggested that there was no significant increase in the risk of a SCE when drivers were engaged in handheld phone conversations. For ‘Talking/listening on a handsfree phone’, again like Olson et al., an odds ratio of significantly less than 1 was observed. The calculated value of 0.65 suggested that talking on a handsfree mobile phone had a protective effect on their sample of drivers. Finally, the authors produced an odds ratio for all mobile phone use, encompassing texting, handheld and handsfree calls. The value was 1.14 and this was found to be statistically significant, suggesting that when the data were aggregated, overall mobile phone was associated with a small increase in the likelihood of an SCE. The authors assert that the similarity between the results from the Olson and Hickman studies suggest that they are a fair estimate of the relative risk associated with the various modes of mobile phone use.
Young and Schreiner (2009) used airbag deployment crash rates to investigate the effect of handsfree calls on collision risk using the General Motors ‘OnStar’ communications and vehicle diagnostics system. They found that like the other naturalistic driving studies reported here, handsfree use was not associated with a high frequency of crashes. However, a review of their study by Braver, Lund and McCartt (2009) suggested that there were confounding factors that were not addressed and that use of the OnStar system may not be representative of all handsfree mobile phone use by drivers. Braver and colleagues were therefore not convinced that Young and Schreiner had demonstrated conclusive evidence that handsfree mobile phone use did not increase crash risk.
Fitch, Soccolich, Guo et al. (2013) conducted a specific naturalistic driving study to investigate the impact of handheld and handsfree mobile phone use on driving performance and SCE risk. They used an approach similar to the Dingus et al. (2006) study with 204 drivers using vehicles fitted with monitoring equipment to record their driving behaviour over a period of 31 days (on average). They observed more than 14,000 calls (28% of all mobile phone call activity) and 8,500 texts (10% of all text messaging activity). They found that overall handheld (HH) mobile phone use was associated with a significant odds ratio of 1.73, overall portable handsfree (PHF) use had a non-significant odds ratio of 1.06 whilst overall integrated handsfree (IHF) use had a non-significant odds ratio of 0.57. However, Fitch et al. broke phone use into sub-tasks and observed that talking on any phone type was associated with a non-signficant odds ratio of less than 1.00 (HH: 0.79; PHF: 0.73; IHF: 0.71). Fitch et al. also looked at the driving behaviours observed whilst mobile phone use was in progress, finding that drivers took their eyes of the road longest when composing text messages but dramatic changes when making calls was not apparent.
This study presented here employed a similar approach to that adopted by Hickman, Hanowski & Bocanegra (2010) but only examined the occurrence of near crash SCEs relative to baseline epochs as the factors associated with crashes were not available for reasons of legal liability. It used data provided by technology provider, SmartDrive, from vehicles driven in the USA, UK, and New Zealand. The aim of the study was to investigate the use of the odds ratio approach to give further insights into the effect of mobile phone use and the occurrence of safety critical events when driving.
METHOD
The fuel management and driver safety technology company, SmartDrive (www.smartdrive.net) were approached to provide data on SCEs and matched baseline events. They kindly agreed to this request with no financial or contractual obligations in either direction aside from ensuring the anonymity of all drivers and organisations involved in this research.
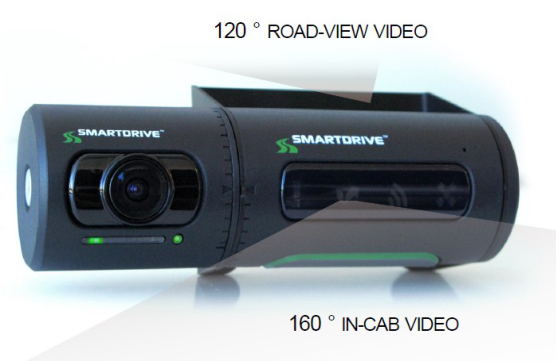
The SmartDrive system The SmartDrive SmartRecorder combines video, audio, and vehicle data. Figure 1 shows the SmartRecorder 3 system. This is the device that was fitted in the cab of equipped vehicles. This device has a 120° forward field-of- view – recording what the driver sees through the windscreen; and a 160° in-cab view to record what the driver was doing.
Figure 1: SmartDrive SmartRecorder 3 system
The SmartRecorder monitors in-cab audio, has three-axis accelerometers, GPS location detection and speed measurement from both the GPS and the engine management systems. It is triggered to record by vehicle behaviour such as harsh acceleration, braking or cornering; speeding or by user intervention. A period of fifteen seconds before and fifteen seconds after the trigger point (giving a total epoch duration of 30 seconds) is recorded and sent wirelessly to a central data server. From here, a SmartDrive Expert Review process is enacted. Trained safety review staff made subjective and objective observations for each recorded event using a structured procedure covering more than seventy aspects of driving behaviour. This review process determined whether an event can be considered a baseline event (BE) or a safety critical event (SCE). A limitation in this study is that the SmartDrive review process does not split mobile phone use into separate tasks of dialing/manual interaction and talking.
Data provision All personal or company information associated with the data provided was codified by SmartDrive to ensure that no event details could be attributed to any particular individual or organisation. SmartDrive provided two spreadsheet files, one file containing information relating to SCEs and one file for BEs. Each row of the files contained information about one observation (e.g. driver behaviour) observed for a specific event (identified by an ‘EventId’ number). Data were compressed so that all behaviours observed were associated to the unique EventID. For legal liability reasons, SmartDrive did not provide information about the observations associated with collisions, only those associated with near-crash events and baseline epochs. Consequently, the results are based on non-crash SCEs only; collision data is not included in the analysis. Each record was also associated with a ‘CompanyId’ value that uniquely identified a SmartDrive fleet customer; this permitted the country of origin of each record to be ascertained. The data represented results from all SmartDrive customers, over the recording period, which was 01/04/2012-18/10/2013.
Calculation of odds ratios Odds ratios and 95% upper and lower confidence limits were calculated using the same statistical method as Olson et al. (2009) and Hickman et al. (2010) for each task. An odds ratio of more than 1.00, where the range from the lower confidence limit (LCL) to the upper confidence limit (UCL) does not include 1.00, indicates a significant increase in the association between the occurrence of that task and the likelihood of an SCE. An odds ratio of less than 1.00 where the range from the LCL to the UCL does not include 1.00 indicates that the task significantly decreases the association between the occurrence of that task and the likelihood of an SCE. An odds ratio where the value 1.00 is within the LCL and UCL suggests that the task has no influence on the likelihood of an SCE.
RESULTS
Data provided The SmartDrive dataset comprised a total of 103,264 epochs recorded from the start of April 2012 until mid-October 2013 and evaluated by SmartDrive expert reviewers. Of this total number of epochs, 14,097 were classified as SCEs and 89,167 were BEs. Collisions (N = 4,374) were removed from the total number of SCEs due to the SmartDrive policy to remove observations associated with collision events. This left a total number of 9,723 SCEs for further analysis.
Companies Data was provided by 143 companies from the USA, UK and New Zealand, all of whom were SmartDrive customers.
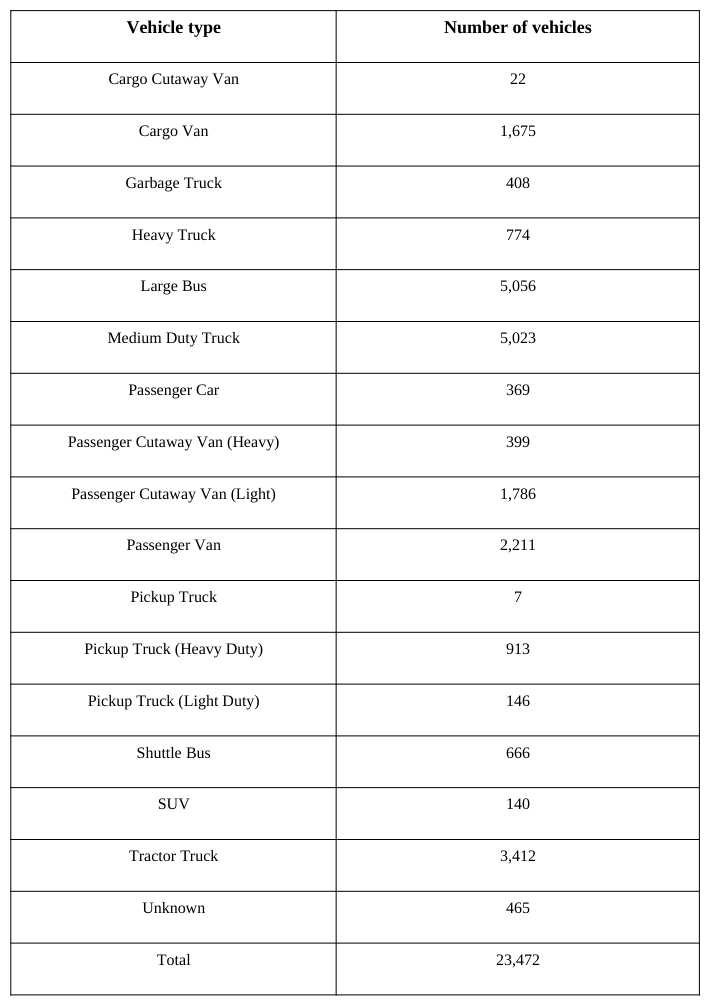
Vehicles The event data was collected from 23,472 vehicles of various types. Table 1 shows the breakdown of this total by vehicle type.
Table 1: Numbers of each vehicle type included in the sample of vehicles equipped with the SmartDrive system Vehicle type Number of vehicles
Table 1 shows that the overwhelming majority of vehicles included in the study are commercial vehicles (trucks/buses). It is therefore more relevant to draw comparisons between the results of this study and those of the Olson et al. (2009) and Hickman et al. (2010) studies as they examined commercial vehicle operations rather than Dingus et al. (2006), which was focused on passenger cars. Due to the way in which data was provided, it was not possible to associate individual events with specific vehicle types. Although Hickman et al. also collapsed their data across truck and bus vehicle types, Young (2012b) outlined why this is to be avoided if at all possible.
Odds ratios for mobile phone use
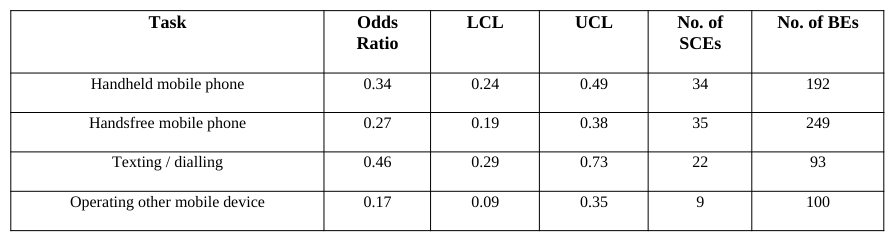
Table 2 shows the odds ratios that were calculated for each mobile phone/device task.
Table 2: Calculated odds ratios for each task LCL UCL No. of
Notably, all of the mobile phone-related tasks listed in Table 2 were associated with significant odds ratios less than 1.00 for the occurrence of an SCE.
DISCUSSION
As with Hickman et al. and Olson et al., the results from this study suggest that handsfree mobile phone conversations are associated with a lower likelihood of the occurrence of a SCE than the results for example Redelmeier and Tibshirani (1997). and also somewhat at odds with the results of laboratory studies (e.g. Strayer & Johnston, 2001; Burns, Parkes, Burton et al., 2002) and a meta-analysis (Horrey & Wickens, 2006); each of suggest that mobile phone conversations cause impairment to driving that would be expected to increase collision risk. A possible difference between Olson et al./Hickman et al. studies and this study is that crashes were not included in this analysis. The 100-car study demonstrated that the prevalence of inattention increases with the severity of the event. This may offer some explanation as to the unexpected results.
Of all the results obtained in this study, the most concerning was that for texting/dialling. The expected large, significant odds ratio did not emerge and a result significantly less than 1.00 was achieved. This highly counterintuitive result contradicts all published work of which the authors are aware and is therefore troubling. A possible factor is the small number of events that were used to calculate the odds ratio for this task. However, it should be noted that small numbers of events affect the size of the error bars not the validity of the calculation. Furthermore, the overall number of texting/dialling events in this study (N = 115) is comparable to that in the Hickman et al. study (N = 93) – but the ratio of SCEs to BEs is in the opposite direction (this study: SCEs = 22; BEs = 93; Hickman et al.: SCEs = 90; BEs = 3). This disparity highlights the possibility that the data analysed in this study has marked differences to that analysed elsewhere.
A limitation of research studies based on analysis and categorisation of driver behaviour by third party organisations is that the researcher may have limited access to the exact definitions of the behaviour categorisations that are applied by the third party data analysts – for example, the phrase ‘unsafe braking’ could be applied in a wide variety of differing circumstances. Specifically in this study, it was not possible to break down mobile phone use into its component sub-tasks (e.g. manual interaction, dialling, speaking) to understand how any additional risk from mobile phone use when driving may arise. The parameters used to trigger the recording device may also be hard to categorise and it seems that the use of event-triggered data as baseline epochs may introduce bias that is removed when access to complete naturalistic driving data is available. The position and quality of the recorded video data is also beyond the control of the researcher and may influence the extent to which data analysts can accurately determine driver participation in secondary tasks.
Factors which may have contributed to the Olson et al. and Hickman et al. results indicating lower risk for mobile phone use when driving are that drivers of commercial vehicles may use their phones more often for short operational, task-relevant business compared to the general population. Such conversations may cause less of a distraction than the more diverse conversations held by the wider public. Commercial drivers are also typically likely to spend a larger proportion of their time driving on high speed, less cognitively demanding roads where the driving task may be more compatible with drivers choosing to engage in secondary tasks. Furthermore, compared to studies conducted in the late 1990s and early 2000s, mobile phone use is possibly more familiar and drivers are may be more accustomed to combining the two tasks.
Research studies are always resource limited. For a given study resource, the complexity of data collection and/or analysis is therefore likely to be inversely proportional to the sample size. One can test a small sample of participants in depth with tight control over experimental conditions (typical of simulator studies e.g. Burns, Parkes et al., 2002) or test a large sample of participants in less detail with limited control over experimental conditions (e.g. Hickman et al., 2010). Each approach is compromised in different ways. The odds ratios relating to mobile phone use obtained by Olson et al. (2009) and Hickman et al. (2010) were conspicuous because they seemed to contradict the results established by epidemiological studies (e.g. Redelmeier & Tibshirani, 1997), studies based on driving tasks conducted in controlled situations (e.g. Strayer & Drews, 2001; Burns, Parkes, Burton et al., 2002), observational studies (e.g. Harbluk, Noy, Trbovich & Eizenman, 2007) and laboratory studies (e.g. Patten, Kircher, Östlund & Nilsson, 2004). Prior to the Olson et al. and Hickman et al. results, the complementary epidemiological and laboratory approaches provided a coherent account of the effect of mobile phone conversations on driving risk. Naturalistic studies stand apart by having participants driving in situations where they are not being asked to drive in a particular manner, make calls at a particular time or have a passenger monitoring their behaviour. This makes them appealing in that there is minimal interference with the primary task of the research – driving; yet resolving their results with those of other types of study is challenging.
An IVDR is triggered by supra-threshold accelerations, excessive speed, or user intervention. It therefore captures instances of the behaviours of relevance to a fleet manager for the effective operation of company vehicles and to provide useful feedback to improve safety and fuel efficiency. For a research study into driver distraction, they do not provide a full assay of all the behaviours of interest. Consequently, the odds ratios provide an estimate of the risk associated with secondary activities related to the behaviours for which it is triggered. This calculated value may be related to the true risk but the association is not clear.
The way in which events (and the observed driving behaviours therein) are classified will have a significant effect on the calculated odds ratios. Although companies providing the data go to great lengths to ensure the accuracy and consistency of their data coders, it is not possible to be certain that differences in coding between individuals or between different data recording companies will not introduce significant differences in the derived odds ratios. In this study, the relative number of collisions within the SCEs was also a concern. Of the 14,097 SCEs, 4,374 (31.0%) were collisions (where no behavioural observations were provided) whereas in Hickman et al. (2010), their dataset B include around 1,000 crashes against around 39,000 near-crashes or crash-relevant conflicts. This suggests that either the techniques for recording/classifying the data and/or the driving behaviour of the fleets observed was fundamentally different; highlighting a further factor that must be considered when applying this approach.
It should be remembered that this is not the traditional application of the odds ratios technique. Odds ratios are typically applied in epidemiological studies (e.g. Cornfield, 1951) where one is calculating the association between cases (e.g. those who are ill) and controls (e.g. those who are not ill), where a proportion of the population have been exposed to particular conditions (e.g. a particular medication) relative to those who have not been exposed to those conditions (e.g. a placebo). In this traditional application, each individual cannot be represented multiple times in the odds ratio calculation table. However, in a naturalistic driving study using an in-vehicle data recorder (IVDR) that is used as fleet management device, the actions of one driver may be represented in all cells of the odds ratio calculation table on multiple occasions whilst another driver may not be represented at all. Young (2013b) resolved how the application of the odds ratios technique can work in the context of collision risk.
There is no doubt that the use of in-vehicle data recorders provides fleet managers with valuable insights into the behaviour of their drivers. Furthermore, a driver that triggers an IVDR device rarely is almost certainly a better driver than one that triggers the IVDR device frequently. For a fleet manager, the ability to learn about the poor driving practices of their drivers and the protection that the video and data can afford against insurance claims is invaluable. However, this study has identified that the use of the data that such systems generate to calculate the risk associated with specific secondary tasks may not always produce sound results.
The points raised do not invalidate the odds ratio approach. The techniques for selection of baseline events and the meaning of calculated odds ratios is something that Olson et al. and Hickman et al. have considered thoroughly. While the apparent protective effect of mobile phone conversations fits with the results of some studies, the finding that text messaging also produced an odds ratio of less than one is troubling. This highlights that care must be taken in the interpretation of odds ratios for naturalistic driving studies where the actions of all drivers who have been monitored are not fully or equally represented in the analysis. Further insight into distraction effects in naturalistic driving behaviour may emerge from the field studies that are part of the US Strategic Highway Research Program 2 (SHRP2), results of which are therefore eagerly anticipated.
ACKNOWLEDGEMENTS
The authors would like to acknowledge Bob Smith (TRL) for his work in calculating the odds ratios and to Andrew Parkes (TRL), Alan Stevens (TRL), Johan Engström (Volvo Group), Trent Victor (Volvo), Rich Hanowski (VTTI), Greg Fitch (VTTI) and Jeff Hickman (VTTI) for their kind and helpful comments on early versions of this paper.
REFERENCES
Alm, H., and Nilsson, L. 1994. “Changes in driver behaviour as a function of hands-free mobile phones – A simulator study.”
Accident Analysis and Prevention, 26, 441–451. Alm, H., and Nilsson, L. 1995. “The effects of a mobile telephone task on driver behaviour in a car following situation.”
Accident Analysis and Prevention, 27, 707–715. Braver, E. R., Lund, A. K., & McCartt, A. T. (2009). “Hands-free Embedded Cell Phones and Airbag-deployment Crash Rates.”
Arlington, VA: Insurance Institute for Highway Safety. Brown, I. D. and Poulton, E. C. (1961). “Measuring The Spare 'Mental Capacity 'Of Car Drivers By A Subsidiary Task.”
Ergonomics, 4:1, 35 – 40 Burns, P.C., Parkes, A., Burton, S., Smith, R., and Burch, D. (2002) “How dangerous is driving with a mobile telephone?
Benchmarking the impairment to alcohol.” TRL Report TRL547. Crowthorne, UK: Transport Research Laboratory. Cornfield, J (1951). "A Method for Estimating Comparative Rates from Clinical Data. Applications to Cancer of the Lung, Breast, and Cervix". Journal of the National Cancer Institute 11: 1269–1275. Dingus, T. A., Klauer, S. G., Neale, V. L., Petersen, A., Lee, S. E., Sudweeks, J., Perez, M. A., Hankey, J., Ramsey, D., Gupta,
S., Bucher, C., Doerzaph, Z. R., Jermeland, J., and Knipling, R. R. (2006). “The 100-Car Naturalistic Driving Study, Phase II - Results of the 100-Car Field Experiment” DOT HS 810 593. National Highway Traffic Safety Administration, USDOT. Fitch, G. A., Soccolich, S. A., Guo, F., McClafferty, J., Fang, Y., Olson, R. L., Perez, M. A., Hanowski, R. J., Hankey, J. M., & Dingus, T. A. (2013). “The impact of hand-held and hands-free cell phone use on driving performance and safety-critical event risk”. DOT HS 811 757. Washington, DC: National Highway Traffic Safety Administration. Harbluk, J. L., Noy, Y. I., Trbovich, P. L., & Eizenman, M. (2007). “An on-road assessment of cognitive distraction: Impacts on
drivers’ visual behavior and braking performance.” Accident Analysis and Prevention, 39 (2), 372-378. Hickman, J. S., Hanowski, R. J., & Bocanegra, J. (2010). “Distraction in commercial trucks and buses: Assessing prevalence and risk in conjunction with crashes and near-crashes.” Report No. FMCSA-RRR-10-049. Washington D.C.: Federal Motor Carrier Safety Administration. Horrey, W.J. and Wickens, C.D. (2006). “Examining the Impact of Cell Phone Conversations on Driving Using Meta-Analytic
Techniques.” Human Factors: The Journal of the Human Factors and Ergonomics Society Spring (2006 vol. 48 no. 1 196- 205 Olson, R.L., Hanowski, R.J., Hickman, J.S., & Bocanegra, J. (2009). “Driver Distraction in Commercial Vehicle Operations.”
Report No. FMCSA-RRR-09-042. Washington D.C.: Federal Motor Carrier Safety Administration. Patten, C.J.D., Kircher, A., Östlund, J., & Nilsson, L. (2004). “Using mobile telephones: Cognitive workload and attention resource allocation.” Accident Analysis and Prevention, 36, 341-350. Redelmeier, D. A. and R. J. Tibshirani (1997). “Association between cellular-telephone calls and motor vehicle collisions.” New
England Journal of Medicine 336 (7), 453-458. Reed, N, & Robbins, R. (2008). “The Effect of Text Messaging On Driver Behaviour - A Simulator Study.” Published Project Report PPR367. Crowthorne, UK: Transport Research Laboratory. Strayer, D. L., & Johnston, W. A. (2001). “Driven to distraction: Dual-task studies of simulated driving and conversing on a
cellular phone.” Psychological Science, 12, 462-466. Strayer, D. L., & Drews, F. A. (2007). “Cell-Phone-Induced Driver Distraction.” Current Directions In Psychological Science, 16, 128-131. Strayer, D. L., Drews, F. A., Albert, R. W., and Johnston, W. A. (2001). “Cell phone induced perceptual impairments during
simulated driving.” Driving Assessment 2001: International Symposium on Human Factors in Driver Assessment, Training, and Vehicle Design, edited by D. V. McGehee, J. D. Lee, & M. Rizzo. Iowa City: Public Policy Center, University of Iowa. Strayer, D. L., Drews, F. A., & Johnston, W. A. (2003). “Cell phone induced failures of visual attention during simulated driving.” Journal of Experimental Psychology: Applied, 9, 23–52 Taeger, D., Sun, Y. and Straif, K. (1998). “On the use, misuse and interpretation of odds ratios.” BMJ 1998; 316:989. Young, R. A. (2011). “Driving consistency errors overestimate crash risk from cellular conversation in two case-crossover
studies.” Proceedings of the Sixth International Driving Symposium on Human Factors in Driver Assessment, Training and Vehicle Design, 298-305. Young, R. A. (2012a). “Cell Phone Use and Crash Risk: Evidence for Positive Bias.” Epidemiology, 23(1), 116-118. doi:
10.1097/EDE.0b013e31823b5efc Young, R. A. (2012b). “Seven Myths about Cognitive Distraction and Driving.” Paper presented at the 5th International Conference on Traffic and Transport Psychology, Groningen, The Netherlands. Young, R. A. (2013a). “Cell Phone Conversation and Automobile Crashes: Relative Risk is Near 1, Not 4.” 3rd International
Conference on Driver Distraction and Inattention, September 4-6, Gothenburg, Sweden. Young, R. A. (2013b). “Naturalistic studies of driver distraction: effects of analysis methods on odds ratios and population attributable risk.” Paper presented at the 7th International Driving Symposium on Human Factors in Driver Assessment, Training and Vehicle Design, Bolton Landing, NY, June 17-20, 2013. Young, R. and Schreiner, C. (2009). “Real-world personal conversations using a hands-free embedded wireless device while
Advances in Human Aspects of Transportation: Part III
Read this individual research paper free through the original publisher, or explore the full digital proceedings book.
ISBN 978-1-4951-2099-2
Explore this ISBN in the AHFE Bookstore ↗Listed in the July 2026 bookstore catalogue; search by ISBN to confirm current availability · Digital book purchase optional