Sandra K. Enriquez, Claudia Camargo, Enrique J. de la Vega, Jesús E. Olguín, Juan A. López (2020). Analysis of Temperature on the Surface of theWrist in Individuals Emulating an Operation with Highly Repetitive Movements Using Sensory Thermography. In: Advances in Social and Organizational Factors. AHFE Open Access, vol. 9. https://doi.org/10.54941/ahfe100346
This study focuses on the application of sensory thermography, as a non-invasive method to evaluate the musculoskeletal injuries that industry operators performing Highly Repetitive Movements (HRM) may acquire, which could enhance the pathological understanding of the Cumulative Trauma Disorder (CTD). Changes in wrist temperature throughout the test will be monitored and analysed, with the aim to show the feasibility of the sensory thermography method for wrists. To undertake the experiments, we had three individuals which had common physical conditions, to which the test was applied in a University, following a pre-defined set of conditions; four samples were taken for eachindividual.The maximum temperature was recorder during the 1st test of individual 1, in the left wrist, reaching a temperature of 34.16ºC after 2:06:47 hours, simultaneously at this time lower back pain surged. Analysed data showed that trends do not follow a normal distribution, but a Weibull distribution, with a correlation coefficient in the range of 0.86 and 0.91. It was concluded that it is possible to analyse patterns of temperature in the musculoskeletal areas of an individual performing HRM, which could lead to CTD. By using the sensory thermography CTD’s could be prevented, below an acceptable cost/benefit threshold.
The World Health Organization defined a work-related disorder as one that results from a number of factors, and where the work environment and the performance of the work contribute significantly, but in varying magnitude, to the causation of the disease (World Health Organization, 2003; Buckle P. et al., 2000). The term musculoskeletal disorder (MSDs) signifies health problems of the locomotor apparatus, for example: muscles, tendons, the skeleton, cartilage, the vascular system, ligaments and nerves. Work-related MSD’s include all disorders that are induced or provoked by work and the circumstances of its performance (Schneider, 2010).
The importance of MSDs in terms of their impact on the working population is well established. According to the Health and Safety Executive (HSE), MSDs are the most common work-related illness in Great Britain, affecting 1.1 million people per year. An estimated 11.8 million working days per year are lost to work-related MSDs in Great Britain, with each sufferer having taken around 19.4 days off in that 12 month period (Melrose, A.S. et al., 2007). In the United State in 2005, MSDs accounted for 375,540 cases, or 30% of the injuries and illnesses with days away from work (BLS, 2006), whilst across Europe as a whole MSDs are the most common work-related problem, with almost 24% of the EU’s workers reporting backache and 22% reporting muscular pains (European Foundation for the Improvement of Living and Working Conditions, 2007).
It is widely acknowledged that ergonomics has an important role to play in the prevention of MSDs (Buckle, 1994; David, 2005; Dempsey, 2007). MSDs, including those localized to the upper extremity such as carpal tunnel syndrome (CTS) and forearm tendinitis, are common and disabling. They comprised 29% of the approximately 1.2 million total workplace illnesses and injuries resulting in lost days from work in 2007 in the United States (BLS, 2008). In a general European working population (Andersen et al., 2007), found neck/shoulder pain prevalence of approximately 30–50% and arm pain prevalence of 11–28%. In service sector workers, slightly lower prevalence’s prevailed. 51% of workers in the European Union used a computer at work in 2005, with an annual growth rate ranging from 3% to 4% (Demunter, 2006).
Recent European studies provide ample evidence that MSDs such as back, neck and upper limb disorders are a significant ill health and cost problem and are becoming more common. Every year millions of European workers in all types of jobs and employment sectors are affected by MSDs through their work. MSDs cover a broad range of health problems. The main groups are back pain/injuries and work-related upper limb disorders, commonly known as “repetitive strain injuries” (RSI). Lower limbs can also be affected. Lifting, poor posture and repetitive movements are among the causes and some types of disorders are associated with particular tasks or occupations. Treatment and recovery are often unsatisfactory especially for more chronic causes. The end result can even be permanent disability, with the loss of employment (Schneider, 2010).
Subsequently, work-related MSDs include all musculoskeletal disorders that are induced or aggravated by work and the circumstances of its performance. MSDs cover a wide range of inflammatory and degenerative diseases of the locomotor system. They include: Inflammations of tendons (tendinitis and tenosynovitis), especially in the forearm wrist, elbow and shoulder, evident in occupations involving prolonged periods of repetitive and static work; Myalgias, as pain and functional impairments of muscles, occurring predominantly in the shoulder-neck region, that occur in occupations with large static work demands; Compression of nerves, occurring especially in the wrist and forearm; Degenerative disorders occurring in the spine, usually in the neck or lower back, especially in those performing manual handling or heavy physical work. However, they may also occur in the hip or knee joints. These disorders are chronic, and symptoms usually occur only after exposure to work related risk factors for a period of time (World Health Organization, 2003).
Carpal tunnel syndrome is a manifestation of median nerve compression within the carpal tunnel of the wristdue to increased intra-tunnel pressure from a variety of sources (Gelberman RH et al., 1981). It has been reported that CTS is associated with certain diseases and conditions such as diabetes, hypothyroidism, pregnancy, rheumatoid arthritis, and work-relatedfactors. In some cases, two or more of these risk factors may coexist; placing the individual at a higher risk of developing CTS (Spinner RJ et al., 1987). The Carpal tunnel syndrome is one of the most common causes of occupational disabilities. Even though less than halfof all cases of CTS are identified as work related in medical claims, a definitive role of work activities as the central cause of CTS is unclear (Department of Labor,1999). In addition, the role of common lifestyle and personal characteristics as predictors of CTS has received substantially less scrutiny (Atcheson SG, 1988).
Thermography is a non-invasive technique without biologic threat. It detects, measures, and converts invisible, surface body heat into a visible display, which is then photographed or videotaped as a permanent record (Feldman, 1991). Infrared thermography detects skin temperature, which is a function of subcutaneous perfusion (Anbar, 1998; Anbar, 2002). Digital images coupled with computer processing and storage allow for dynamic realtime analysis. Thermography for distinguishing between normal subjects and those with various UEMSDs has proved to be positive(Tchou et al., 1992; Coughlin et al., 1999; Schuhfried et al., 2000; E. Gold et al.,2004).
Previous research by (E. Gold et al., 2004) shows that a reduced blood flow could contribute to the development of UEMSD, like tendinitis and the CTS. The low temperature in the extremities could be caused by the low blow flow, however, cold hands are generally no accompanied by UEMSD’s.
The infrared thermography detects the cutaneous temperature, which is a function of the subcutaneous perfusion. Previous comparison of thermograph results of individuals with UEMSD and individuals without UEMSD has shown promising results, as it was possible to detect trending differences(E. Gold et al., 2004).These authorsundertook a study, in which 12 individuals were used as the controlling individuals out of 17 individuals. The selection process of the individuals was based on previous studies, within the 12 individuals selected to perform the experiment, some had symptoms and cold hands, and others had symptoms but no cold hands, and also some that presented no symptoms and no cold hands.
In order to execute the comparative examination to the 3 different groups the sensors were places in the desk (which could be adjusted to the comfort of each patient preceding the examination), the markers were places underneath a manila folder, and the individuals sat down 20 min prior to the exam, aiming to obtain a more detailed recording. The first thermography was taken 1 minute before the examination, at the start, during and at the end, lastly a final recording was captured a few minutes after ending the examination. During the test, various questions were inquired to the individuals, especially related to temperature, cramps, pain and numbness of extremities. The dorsal metacarpal region of the right hand was identified as a strategic spot to detect the vascular response. It was demonstrated that the difference in temperature among the different groups (with and without UEMSD) is significantly different.
It was also stated in this study, that the differences in temperature after typing for 9 minutes were detected by using the infrared thermograph in all 3 groups. Individuals with UEMSD syndromes showed abnormalities in the cutaneous temperature. As mentioned in the study, it is likely that the temperature derived from the use of the keyboard arises due a low blood flow, nevertheless, definitive conclusion were not reached (E. Gold et al., 2004).
MATERIALS
The equipment and material used in this research study were the following: Digital Sköll thermograph with 2 sensors with a temperature range of 0˚C to 40˚C, precision ±0.3˚C, and a resolution of 0.1˚C (López, 1992); micropore tape; adhesive tape; stop watch; laptop. On top of these, the Akela software is used for the programming of the Sköll thermograph. Lastly, Minitab®15 and Microsoft® Office Excel 2007 statistical packages were utilized.
METHODS
The testing was applied to 3 students of the faculty of Engineering, Architecture and Design of the Autonomous University of Baja California, of a sample of 6 students, one of the pre-requisites for the testing was that the individuals did not perform any physical activity during the 20 minutes prior to the start of the test (Gold et al., 2004; Gold et al., 2009), this interval was derived based on previous research,in which it was stated that the required time to stabilize the body temperature after undertaking physical activity was approximately 20 minutes (E.Y.K NG et al., 2001). In the other hand, it was also asked to the individuals to avoid the consumption of alcohol or tobacco (Gold et al., 2009), due to the fact that smoking induces a reduction in body temperature (Puig, 1993), in contrast, alcohol rises the body temperature (K.S. Kim, 2006; A. A. Puig, 1993).
Furthermore, a questionnaire was applied to the individuals, aiming to gather some general information related to the age, height, weight, previous injuries and/or traumas. The following step consisted of keeping the room temperature between 20ºC and 25ºC (E.Y.K NG et al., 2001), controlled by the air-condition in the testing room. After the stabilization period, the individual sat in the ergonomic chair and the thermographs were placed in both wrists (in the mid nerve region). Once the thermographs were in position, both arms were laid down on an entirely horizontal table, in line with the height of the ribs (Kroemer et al., 2001), this position was adopted for the 20 minutes prior to the test and after the test.
Subsequently, the individual emulated a highly repetitive movement for a period or 3:30 hours, given the fact that this corresponds to the maximum time a HRM is performed in the textile industry. The HRM’s consisted of movements of long and short reach, as well as grabbing and releasing HRM’s. During the test anomalies were identified, discomfort and pain was also registered.
Lastly, the after completing the cycle of 3:30 hours and resting for 20 minutes (Gold et al., 2009), the thermographs were detached, the data was downloaded in Microsoft® Office Excel 2007 for post processing, and finally the analysis and validation of data was done with Minitab®.
The individuals that participated in this research were 3 healthy men. The main anthropometric characteristics of the individuals are summarized in Table 1. It is important to point out, that none of the individuals presented lumbar problems, arterial pressure (high or low) problems; moreover, none reported to have any type of alcohol/tobacco addiction. Furthermore, it is highlighted that none of the individuals had previous experience performing HRM’s at work.
Table 1: Anthropometric Characteristics of Individuals Weight(K
RESULTS
For the development of the intermittent tests, as the name indicates, a considerable buffer time between tests was always respected; lapses of 1 week were set, aiming to verify trends or to detect changes in the behaviour from test to test.
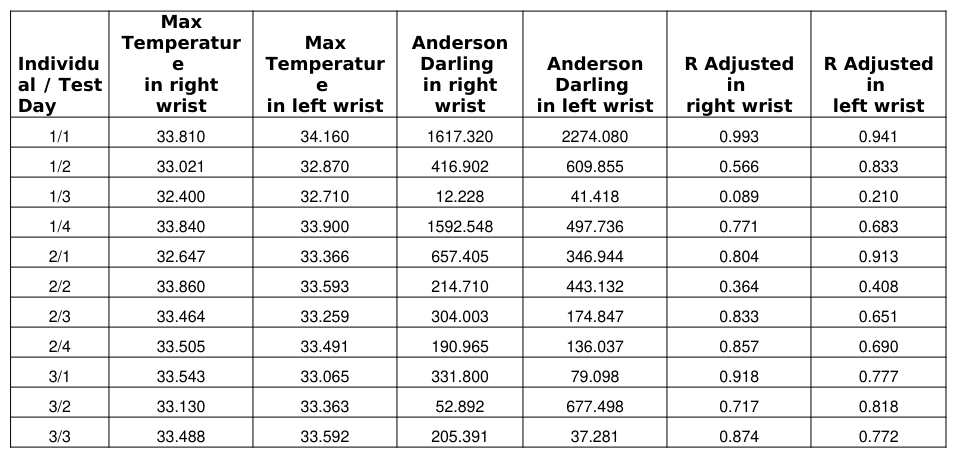
After carrying out the examinations, the results shown in Table 2 were obtained. For the experimental analysis of the results individual 1 was selected, in the 1st day using the 1st test, given the fact that this individual presented the maximum temperature of the whole testing sequence, important to mention that the highest temperature was recorder in the left wrist.
Table 2 shows the results of the Anderson Darling analysis, which indicates the type of distribution followed by the data, in this case it was detected that a normal distribution was not trailed by any of the tests applied. Table 2 also shows the determination coefficient that indicates the percentage of variation of the data.
Table 2: Temperature Patterns
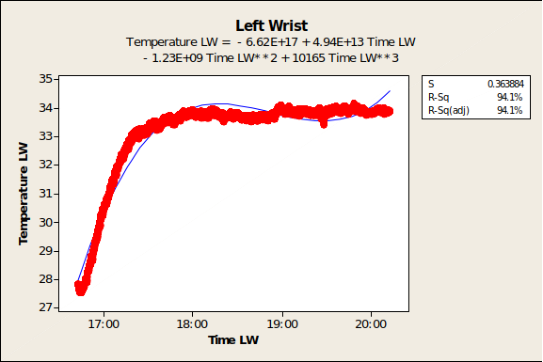
3/4 33.592 33.928 24.016 29.017 0.559 0.287 The results of this test case can be observed in Figure 1 and Figure 2, for both wrists it was possible to apply a 3 rd
order polynomial adjustment curve to represent the behaviour of the temperatures during the experiment, bearing in mind that the corresponding coefficient R Square shows this as a results of the test. For the left wrist, (Figure 1, temperature versus time) a coefficient R Square of 94.1% was obtained. Successively, it is possible to indicate that the maximum temperature was 34.160º C, and it occurred after 3:06:47 hours.
Figure 1. Individual 1 test day 1left wrist Polynomial Adjustment.
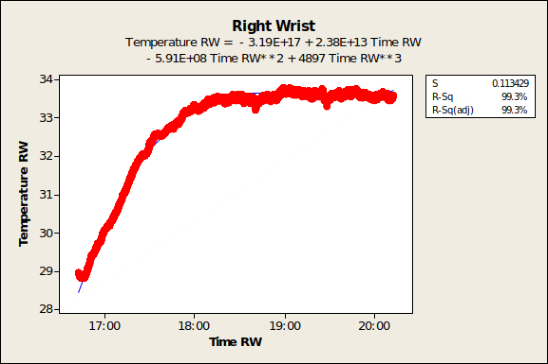
For the right wrist (Figure 2, temperature versus time), a coefficient R Square of 99.3% was derived. In comparison with the left wrist, it can be observed that the patterns of temperature are very similar. A comparable behaviour was also detected in the results of the other individual, where it is clear that during the first hour there is a constant rise of temperature. Moreover, the maximum temperature reached during the test for the right wrist was of 33.810 ºC, after 2:17:00 hours of testing, very similar temperatures as the ones recorder in the other wrist. It is relevant to point out that during the final part of the test; the individual mentioned that he had lower back discomfort, which prevailed throughout the last part of the test in a moderate to low level of discomfort. Additionally, after 1 hour of testing the individual felt some type of swelling and numbness in the fingers; which faded away later in the test.
Figure 2. Individual 1 test day 1 right wrist Polynomial Adjustment.
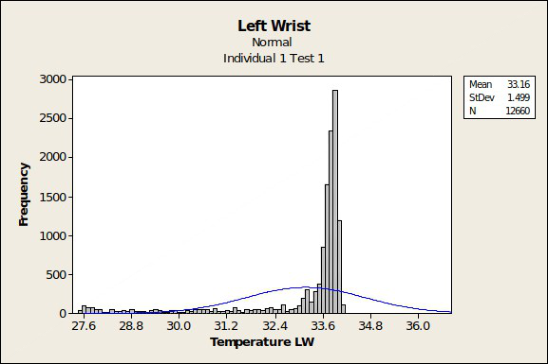
Another part of the analysis that served as evidence to prove that a normal distribution is not followed by the data is shown in Figure 3; the histogram shows the spread of the data that was recorded for the left wrist during the 1st test of individual 1.It is possible to visualize that the temperatures with the highest frequencies oscillate between 33.5 and 34ºC.
Figure 3. Individual1 test day 1left wrist Histogram.
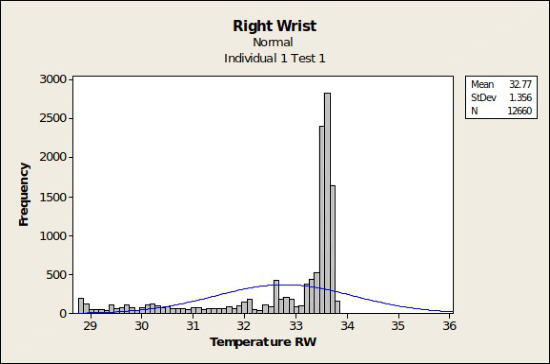
Figure 4, shows a histogram of the right wrist temperature versus frequency behavior. Once again it is visible that a normal distribution if not followed by the data. Data utilized to create the following figure corresponds to the 1 st test of individual 1. On the same table it can be observed that the temperatures with highest frequencies range between 33 and 34ºC.
Figure 4. Individual 1 test day 1 right wrist Histogram.
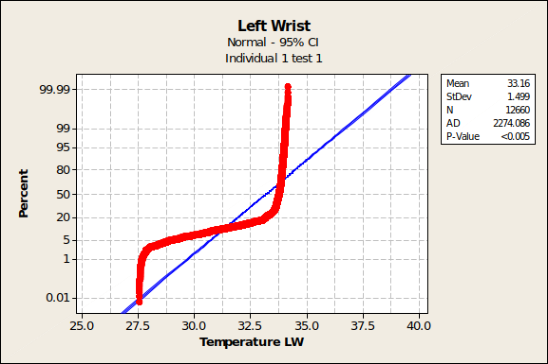
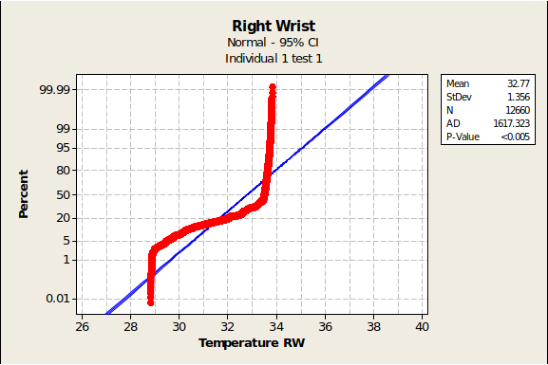
Figure 5 and Figure 6 show the normality test. For every output dataset from the test the next hypothesis was followed: Null Hypothesis (H0) = the dataset follows a normal distribution. Alternative Hypothesis (H1) = the dataset does not follow a normal distribution.
Figure 5 shows the results of the Anderson Darling (AD) assessment, a value of 2274.08 is obtained, meaning that the distribution is not normal; it is also visible that the resulting p-value is clearly lower when compared to the significant level that was previously established at 0.05, therefore we must reject the null hypothesis that indicates that the data follows a normal distribution, and follow the same procedure as before to find a distribution that more accurately fits the spread of the dataset showing temperature on the left wrist.
Figure 5. Individual 1 test day 1 left wrist Normality test.
Figure 6 it can be visualized that for the right wrist the AD analysis produces a value of 1617.32, which indicates that a normal distribution is not followed by the dataset, in this case we can confirm that a normal distribution is not followed by checking the p-value, which in fact is also lower than the significant level (set to 0.05, same as for the left wrist), furthermore, the null hypothesis is also rejected for the right wrist. Moreover, it can be concluded that in both AD analysis the statistical values are significantly large, 2274.08(left) and 1617.32(right).
Figure 6. Individual test da1 test day 1 right wrist Normality test.
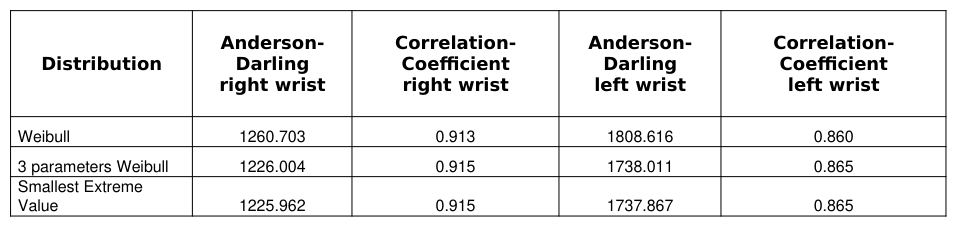
Table 3 shows a summary of the different fits/probabilistic distributions that were used for the analysis of the data of both wrists. Since the distribution of the data was not normal, other known distribution were used, the best fits of the data were obtained by using Weibull, 3 parameters Weibull and Smallest Extreme Value. Also, the results of the AD analysis are added to the table together with the correlation coefficient. Very similar results were obtained using the different methods, which in fact serves as a validation tool.
Table 3: Probability Distributions of the Individual 1 test day 1
It can be summarized that the most representative distributions of the 3 individuals during the 4 testing phases, show whether or not a similitude in temperature patterns was found, furthermore, they datasets can determine if the distribution of the data follows one or more probabilistic distribution for the left or right wrist. Based on the results,we were able to conclude that the dataset shows large resemblances in the patterns of temperature for all three distributions (Weibull, 3 parameters Weibull and Smallest Extreme Value) for both wrists.
CONCLUSIONS
This research allowed us to answer the following question: What is the maximum temperature reached while performing a HRM for 3:30 hours? It was determined that the maximum temperature was 34.160ºC, and it was reached by the 1st individual, during his first test, after 3:06:47 hours. For the same individual the maximum temperature of the right wrist was 33.810ºC, and it was recorded after 2:17:00 of test. By the end of the test the individual mentioned that he felt some discomfort in the lower back, which was described a low to moderate pain. After 1 hour of test, some swelling and numbness of the fingers appeared, but constantly faded away during the test. Temperature in both wrists was similar. The maximum temperatures for the 2nd individual were reached during the 2nd test after 3:19:10 hours of starting the test corresponding to the left wrist, and 3:30:59 hours for the right wrist. The maximum temperatures for this individual were 33.593ºC and 33.860ºC respectively, and can be considered very similar in temperature and time when they occurred. Furthermore, the individual mentioned that he had some discomfort in the lower back after 3 hours of test. Lastly, the results of the 3 rd individual show maximum temperatures of 33.928ºC for the left wrist and 33.592ºC for the right wrists, and were obtained in a much shorter period, 1:10:00 and 00:51:20 hours respectively, similar to the other cases the temperatures are in the same order or magnitude and do not vary significantly from one wrist to the other.
It was concluded the best fit for the temperature datasets was the Weibull distribution for all 3 individuals that undertook the testing (results can be observed in Table 3). Therefore it was concluded that while working with the sensory thermography we obtained reliable results within confidence intervals that are satisfactory for analysis, and furthermore they provide a good understanding of the wrist temperature as a triggering value to predict and diagnose cumulative trauma disorders. It was also determined that the datasets of temperature do not fit a normal distribution, neither for the left of the right wrist, this was determined based on the AD analysis that was completed for the datasets of each individual participating on the testing. The sensory thermography offers the early detection of cumulative trauma disorders and with it, it would be possible to prevent further injuries, and perhaps prevent CTD’s from occurring. Disorders like the Carpal tunnel disorder or tendinitis could be avoided by using an early monitoring system like the sensory thermography, which in fact provides a cost benefit acceptable relation.
REFERENCES
A. A. Puig (1993), “Smoking influence in the variations of biochemical, physiological and performance parameters”, Barcelona. Anbar M. (1998), “Clinical thermal imaging today”. IEEE Eng MedBiol Mag 17, p.p. 25–33.
Anbar M. (2002), “Assessment of physiologic and pathologic radiative heat dissipation using dynamic infrared imaging”, Ann NY AcadSci 972, p.p. 111–118. Andersen J.H., Haahr J.P., Frost P. (2007), “Risk factors for more severe regional musculoskeletal symptoms: a two-year
prospective study of a general working population”, Arthritis Rheum 56, p.p. 1355–1364 Atcheson S.G., Ward J.R., Lowe W. (1988),“Concurrent medical disease inwork-related carpal tunnel syndrome”, Arch Intern Med;158(14), p.p. 1506–12. Bernard B.P., ed. (1997), “A critical review of epidemiologic evidence for work-relatedmusculoskeletal disorders of the neck,
upper extremity, and lowback”, Musculoskeletal disorders and workplace factors. DHHS (NIOSH) Publication No. 97-141. Cincinnati: U.S. Department of Health and Human Services. Booher, H.R and Minninger, J. (2003), “Human systems integration in army systems acquisition”, in: Handbook of human systems integration, Booher, Harold (Ed.). p.p. 663-698 Buckle P. and David G., (2000), “Defining the problem”, in: Magazine 3, Preventing Work-related Musculoskeletal Disorders,
European Agency for Safety and Health at Work, EU-OSHA., p.p. 5. Buckle, P. and Hoffman, A. (1994), “TUC Guide to assessing WRULDs risks”. London: College Hill Press. Bureau of Labour Statistics BLS(2006), “Nonfatal occupational injuries and illnesses requiring days away from work, 2005” [online]. Available from: http://www.bls.gov/news.release/pdf/osh2.pdf [Accessed 8 September 2007].
Bureau of Labour Statistics BLS (2008), “Nonfatal occupational injuries and illnesses requiring days away from work, 2007”, USDL 08–1716.Bureau of Labor Statistics, U.S. Department of Labor, Washington. Coughlin P., Chetter I.C., Kent P.J., Kester R (1999), “Vascular surgical society of Great Britain and Ireland: analysis of cold
provocation thermography in the objective diagnosis of the hand-arm vibration syndrome”, Br J Surg 86:694–695. David G.C. (2005), “Ergonomic methods for assessing exposure to risk factors for work-related musculoskeletal disorders”, Occupational Medicine, 55, p.p. 190–199. Dempsey, P.G. (2007), “Effectiveness of ergonomics interventions to prevent musculoskeletal disorders: Beware of what you
ask”, International Journal of Industrial Ergonomics, 37, p.p. 169– 173. Demunter C. (2006), “How skilled are Europeans at using computers and the Internet?”In: Statistics in Focus, report KS-NP-06- 17- EN-N, European Communities, Luxembourg. Department of Labor (1999), “Occupational safety and health administration”, Ergonomics program; proposed rule. Fed
Regist 64(225). European Foundation for the Improvement of Living and Working Conditions (2007). Feldman F. (1991), “Thermography of the hand and wrist: Practical applications, Hand Clinics”, Vol. 7, No.1. Gelberman RH, Hergenroeder PT, Hargens AR, Lundborg GN, Akeson WH. (1981), “The carpal tunnel syndrome. A study of carpal canal pressures”, J Bone Joint Surg Am;63(3), p.p. 380–383. Gold J.E., Cherniack M., Buchholz B. (2004),“Examination of skin temperature in the dorsal hand of office workers via infrared
thermography”, Eur J Appl Phys 93, p.p. 245–251. Gold J., C. M. (2009), Skin temperature in dorsal hand of office workers and severity of upper extremity musculoskeletal disorders”, Int. Arch. Occup. Enviro. Health., 82, p.p. 1281-1292. http://polaris.unisabana.edu.co/prevencion/adicciones/alcohol/alcohol_3.htm. Kim K.S., Shin S. W., YoonT. H., Kim E.J., LeeJ.W, KimI. Y. (2006), “Infrared thermography in human hand”, IFMBE
Proceeding 14-4, p.p. 2584-2587. Kroemer E., Kroemer H., Kroemer K. (2001), “Ergonomics: How to design for ease and efficiency”, second edition, Prentice Hall, ISBN 0-13-725478-1, p.p. 97- 113. Melrose, A.S., Graveling R.A., Cowie H., Ritchie P., Hutchison P., Mulholland R.M., Better Display Screen Equipment (DSE)
(2007), “Work-related ill health data, prepared by the Institute of Occupational Medicine for the Health and Safety Executive”, RR561, HSE Research Report. Ng E.Y-K, Ung L. N., Ng F.C., Sim L.S.J. (2001), “Statistical analysis of healthy and malignant breast thermography”, International Journal of Medical Engineering & Technology 25 p.p. 253-263. Schneider, E. and Irastorza, X. (2010), “European Agency for Safety and Health at Work”, (EU-OSHA) with support from Sarah
Copsey, European Agency for Safety and Health at work (EU-OSHA). Schuhfried O., Vacariu G., Lang T., Korpan M., Kiener H.P., Fialka Moser V. (2000), “Thermographic parameters in the diagnosis of secondary Raynaud’s phenomena”, Arch Phys Med Rehabil 81, p.p. 495–499. Spinner R.J., Bachman J.W., Amadio P.C. (1987), “The many faces of carpal tunnel syndrome”, Mayo Clin Proc; 64(7), p.p.
829–836. Tchou S., Costich J.F., Burgess R.C., Wexler C.E. (1992), “Thermo- graphic observations in unilateral carpal tunnel syndrome: report of 61 cases”, J Hand Surg 17A, p.p. 631–637 World Health Organization, Protecting Workers' Health Series No. 5, (2003), “Preventing musculoskeletaldisorders in the
workplace”, Available at: http://www.who.int/occupational_health/publications/muscdisorders/en/
LISTED IN THE AHFE DIGITAL BOOKSTORE CATALOGUE
Explore the complete digital volume
Advances in Social and Organizational Factors
Read this individual research paper free through the original publisher, or explore the full digital proceedings book.
ISBN 978-1-4951-2102-9
Explore this ISBN in the AHFE Bookstore ↗Listed in the July 2026 bookstore catalogue; search by ISBN to confirm current availability · Digital book purchase optional