Guenther Schuh, Till Potente, Christina Thomas, Melanie Luckert (2020). Interactive Analysis and Evaluation of Production Control. In: Advances in The Ergonomics in Manufacturing: Managing the Enterprise of the Future. AHFE Open Access, vol. 12. https://doi.org/10.54941/ahfe100466
Today most markets are extremely competitive. Thus, a high adherence to delivery dates represents a key factor for companies’ success. Companies try to keep delivery dates by an adequate production planning and control (PPC) but often not succeed due to a lack of knowledge concerning the quality of their production control. The key objective of this paper is to introduce a quick and simple possibility to analyze and evaluate the quality of companies’ production control in an interactive way. Therefore, the Laboratory for Machine Tools and Production Engineering (WZL) has developed a web based solution called “Performance Check”. Based on feedback data of ERP-systems (enterprise resource planning systems), the tool visualizes defined key indicators of production control.
Nowadays the fundamental challenge for manufacturing companies is to cope with increasing market dynamics and individual customer demands (Nyhuis et al., 2009; Zaeh, 2005). On the one hand delivery times reduced strongly in recent years, in some branches up to 50 % (Wiendahl and Behringer, 2006). On the other hand, market dynamic increased highly concerning product variety and the demand for individualized products (Wiendahl, 2008). To meet these requirements PPC turns out to be an important variable (Wiendahl et al., 2007; Reinhart and Gyger, 2008; Lödding, 2012). To remove the lack of transparency resulting from the complexity of current production environment an increasing number of IT-tools was developed, e.g. Supply Chain Management Systems, Enterprise Resource Planning Systems and Manufacturing Execution Systems (Milberg and Neise, 2006). In this way the challenge is to reach the classic logistic targets according to Wiendahl as well as Goldratts and Cox’ demand for a maximization of throughput at minimal operating costs (Wiendahl, 2008; Goldratt and Cox, 1984). The logistic targets according to Wiendahl are the following (Wiendahl, 2008):
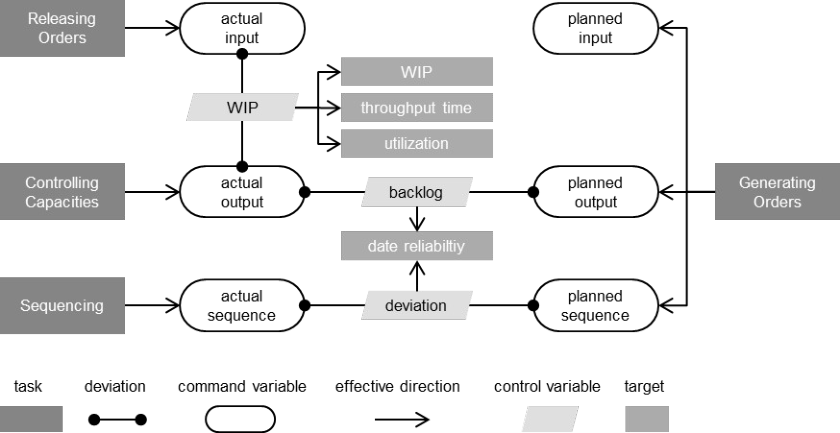
- low stocks - short throughput times - high adherence to delivery dates - high capacity utilization. In order to reach the four logistic targets the existence of the so called polylemma of production planning has to be considered (Muenzberg and Nyhuis, 2009). The polylemma is based on the fact that the mentioned four targets are competing and thus cannot be optimized all at once (Baye, 2009). Due to the conflicting targets companies have to prioritize the targets and define their leading target. Nevertheless, to ameliorate the logistic targets by dint of production control their four tasks can be varied under the aspect of best possible target achievement. The four tasks after Lödding (2008) are shown in Fig. 1.
Figure 1. Model of production control (Lödding, 2008; Nyhuis et al., 2009)
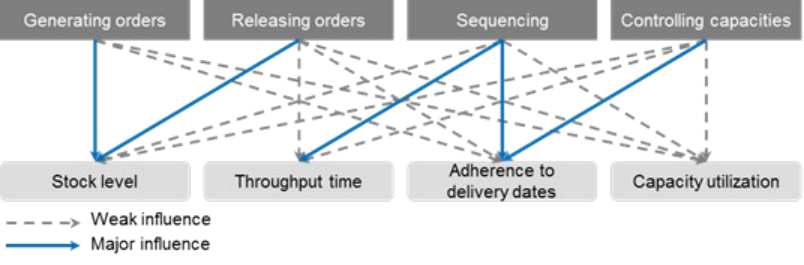
The four tasks are: Order generation, order release, sequencing and capacity control (Lödding, 2008). The order generation just means to transfer a customer request into a production order. Not till order release, the created production order is free for production. Thus, order release regulates the inflow for the production. Companies often do not differ between order generation and order release. They release every order in the moment of generation and do not make use of the parameter production order amount for controlling functions. The third task is sequencing production orders which wait in front of machines. The decision, which production order will be done next could follow different priority rules, e.g. Fifo (First in first out). To complete the tasks, capacity control determines the available working times. The connection between the tasks of production control and the logistic targets is shown in Fig. 2.
Figure 2. Impact of production control tasks to logistic targets
Sequencing for example is mainly influencing throughput time and adherence to delivery dates. Order release is primarily relevant concerning capacity utilization. The correlations referred to above lead to the requirement of an individual configuration of production control for each company. By taking into account that the know-how about the functionality between production control and logistic targets is often not given in companies, they can on the one hand not decide how to ameliorate, and on the other hand, they do not know about the quality of their current production control configuration.
STATE OF THE ART Driven by numerous production control concepts from theory as well as from practice companies have to face the problem to decide which one will be best for their specific situation. Practical examples show that the application of control concepts in industry is done without the knowledge of their specifics (Schuh et al., 2010). To make an informed decision about the quality of the current production control configuration and their possible replacement there are different approaches in literature outlined below.
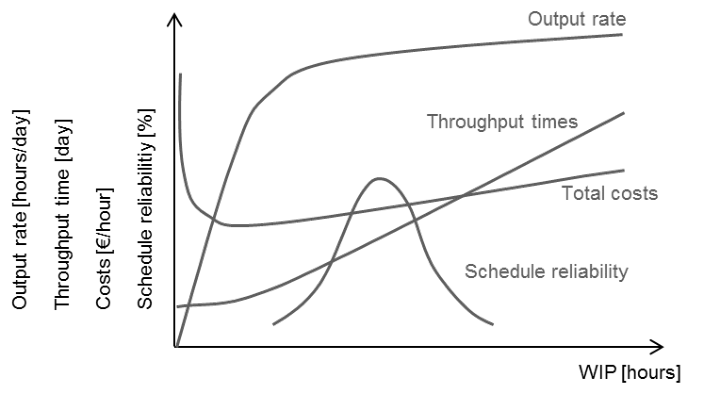
Production operating curves The concept of production operating curves developed by Nyhuis and Wiendahl allows a logistics-oriented evaluation and designing of complex production systems (Nyhuis and Wiendahl, 2012). Therefore company specific operating curves analog Fig. 3 have to be calculated.
Figure 3. Principle trends of production operating curves (Adapted from Nyhuis and Wiendahl, 2009)
Figure 3 shows the connections between WIP (Work in Process), output rate, throughput time, costs and schedule reliability. Based on a given WIP level, the resulting other values can be read out (Nyhuis and Wiendahl, 2009). As the lines work in opposite directions the polylemma between the four logistic targets becomes obvious. Production operating curves enable companies on the one hand to evaluate if their current operating point is suitable to their goals and on the other hand to recognize in which direction WIP level has to be changed to reach a more suitable operating point.
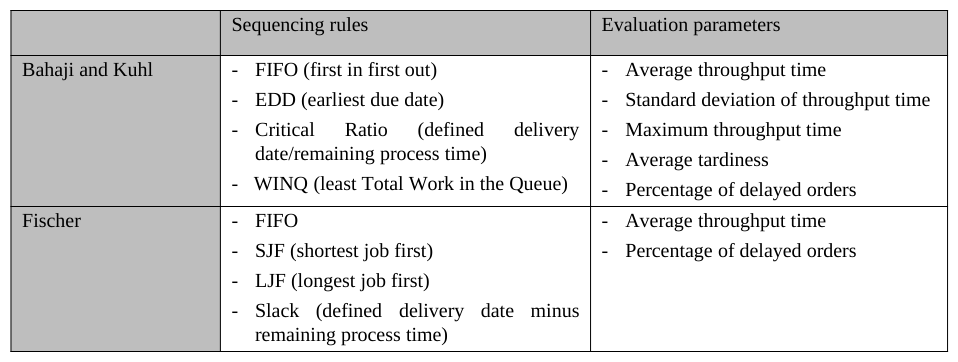
Studies concerning the impact of production control configuration to logistic targets In literature a lot of simulation studies exist about the examination of the impact of defined production control aspects to the productivity of production systems. At this point, two studies dealing with sequencing rules will be exemplarily presented due to the fact that these will explain the main restrictions. These are the studies from Fischer of 2007 and Bahaji and Kuhl of 2008. Table 1 gives an overview over the examined sequencing rules and the used evaluation parameters.
Table 1: Studies about the effect of sequencing rules (Bahaji and Kuhl 2008; Fischer 2007) Sequencing rules Evaluation parameters
The studies focus on different sequencing rules and use different evaluation parameters. This phenomenon can be applied to all similar studies. Due to the fact of different contents they although evaluate the degree of goal achievement by different sequencing rules but through the usage of different evaluation parameters they cannot be compared. On top of that nearly each study is using a different simulation model (e.g. Bahaji and Kuhl used a production scenario with 85 working systems, whereas Fischer makes no comment). In the wake of non-uniformity or contradictory statements the studies about the general effect of sequencing rules or other configuration aspects of production control to logistic targets are not apt to support the evaluation of the quality of a given production control concept.
Evaluation of the presented concepts As motivated within the introduction there is a need for a tool to evaluate the quality of companies’ production control. Due to the purpose of fast and repeated practical application the presented concepts show the following weaknesses. The first presented concept of production operating curves integrates the company-specific situation and enables the determination of the best operating point. By contrast, no statement concerning the measures to reach the best operating point were made. The second presented concept has the drawback that it is generic. It does not include the specific situation of a company. Whereas the operating curves allow each company to find their best operating point, the different studies use models to show general connections between the configuration of production control and the logistic targets. Moreover, the statements of the different studies concerning the best configuration for reaching a specific logistic target are partly contradictory. For example four studies compare KANBAN and CONWIP directly concerning WIP and output (Huang et al., 1998; Pettersen and Segerstedt, 2009; Gstettner and Kuhn, 1996; Muckstadt and Tavur, 1995). Huang et al. and Pettersen and Segerstedt conclude that CONWIP leads to a lower WIP level by constant output. Gstettner and Kuhn and Muckstadt and Tavur find that KANBAN leads to a lower WIP level by constant output. Summing up, the presented concepts do not fit to essential requirements, which are described below.
REQUIREMENTS The mentioned deficits result in the fact, that companies need a simple tool to check the quality of their current production control and to check the potential which could be exploited by changing the configuration of production control. To ensure the practical suitability the boundary conditions of companies have to be taken into account:
1. In the wake of dynamic markets products, production technologies, quantities,…often change. In combination with the fact that in daily business production scheduler do not have the time to think about strategic questions the requirement for an evaluation system which can be used with little effort and thus, as often as changed situation indicate revaluations, exists.
2. The evaluation system to be developed has to contain all relevant aspects to give a comprehensive picture including existing interactions between logistic targets.
3. In order to enable the comparison of changes in time course as well as the comparison of indicator values of comparable companies the evaluation system has to be standardized. Fix categories and key indicators have to be defined and reference areas have to be determined.
4. For the reason that people without special know-how on the area of production control should be able to understand the results, the defined key indicators have to be visualized in an intuitive way. Furthermore recommendations for actions and reference areas have to be implemented to support the interpretation of the calculated results.
Summing up, the following three key issues have to be regarded:
How can an evaluation system for application with minimal effort be build up?
Which elements have to be included into the evaluation system to make it complete and standardized?
How can the information be visualized to make it easy to understand?
These requirements for future evaluation systems of production control quality have to be met in the near future so that manufacturing companies can stay or become competitive in global markets. In the following these requirements will be regarded by describing an approach for interactive analysis and evaluation of production control.
PERFORMANCE CHECK – AN APPROACH FOR INTERACTIVE ANALYSIS AND EVALUATION The key objective of this paper is the introduction of the Performance Check. This web-based tool calculates its indicators on the basis of feedback data of the ERP-system. This data should be available for at least two month. Additionally work schedules, resource lists and shift models out of the operating system are needed. Out of this, the user is given insight into the quality of his production control and the potential laying in the existing production structure by provision of seven individual indicators. The seven indicators can be structured into three categories: production structure indicators, production control indicators and potential indicators. As a whole they allow an overall evaluation of production control. In the following the three categories will be explained by usage of an existing case so that the combination of analysis and evaluation could be outlined. The data used for the case is out of an SME company of machinery and equipment industry.
Background blood count The idea for the development of the Performance Check, described in the following, comes from the field of blood analysis. The first blood counts were performed by Professor Karl Vierordt of the University of Tübingen in 1852 (Blaha-Kaplans, 2012). After him, several others like Pierre-Carl Joseph Potain, Louis-Charles Malassez and Georges Hayem developed their own techniques (Verso, 1964). Nowadays, the existing methods are among other things put together into two standardized examinations: the blood count and the full blood count. Characteristics of these two examinations are:
Defined purposes: The blood counts are on the one hand used to validate suspected diagnoses and on the other hand to find out what could be the reason for certain symptoms (Perry, 2012)
Defined input: Both examinations need EDTA (Ethylene Diamine Tetraacetic Acid) stabilized blood to get reliable results (Gressner and Arndt, 2007)
Defined output: Each of the examinations has fix values which have to be determined. The blood count for example includes the leukocytes and thrombocytes, the full blood count includes all values of the blood count and further values like monocytes (Gressner and Arndt, 2007)
Defined methods: To determinate the values specified methods have to be used. Thus, the results allow the comparison between different laboratorys (Blaha-Kaplans, 2012)
Defined reference areas: To interpret if a determined value is normal and the person is healthy or if the value is not normal and the person might be ill reference areas were defined (Blaha-Kaplans, 2012) As the blood count and full blood count represents a quick, standardized and meaningful examination to check the medical condition of a person, the approach described in the following transfers the mentioned aspects in production environment and thus presents a method to check the quality of production control.
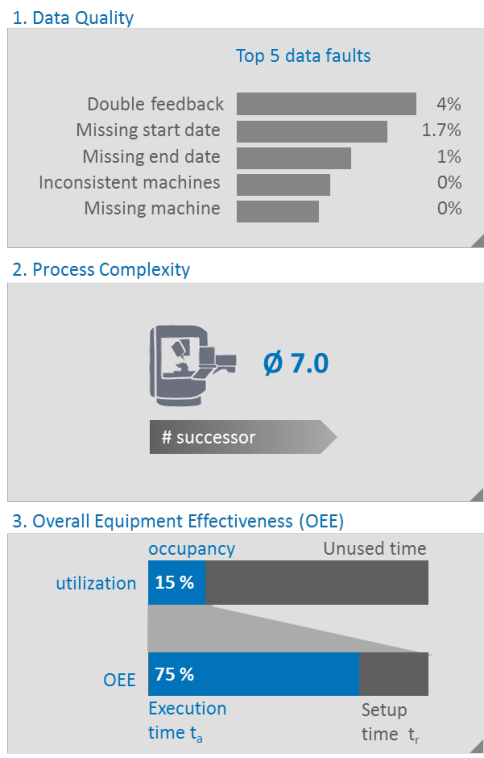
Production Structure Indicators This first category is on a high aggregation level and thus provides overall information, not detailed for single machines or orders. The category includes three single indicators: data quality, process complexity in production and overall equipment effectiveness. Figure 4 shows the indicators for a machinery and equipment manufacturer as could be seen on the overview sheet of the performance check.
Figure 4. Production structure indicators
The chart concerning data quality shows a section out of all identified faults contained in feedback data out of the
ERP-System. On the overview page just the top five faults are mentioned whereas in detail sight all faults can be analyzed. The company of this case shows the main faults double feedback (some process steps are reported twice), missing start dates, missing end dates, inconsistent machines and missing machines. Driven by the fact that the top five faults occur just in 6.7 % of the feedback data, the given input data is from high quality and can thus be used to generate reliable indicators.
The chart concerning process complexity names on the overview page just the average number of successors of each machine. In this case, in average, every machine delivers orders to seven different following machines. This indicator shows the high complexity of shop fabrication. This kind of production structure is typical for machinery and equipment industry.
The chart concerning OEE is on a comparable level of aggregation as the two other indicators. The first bar indicates the degree of capacity utilization referred to an availability of machines for 24 hours seven days a week. With only 15 % utilization the company reveals high potential concerning an increase of output without the necessity of investment in new machines. Out of 15 % utilization 75 % are execution time and 15 % setup time. Concerning the case of a company out of the machinery and equipment industry on the one hand 75 % execution time are unusually high due to the fact that in most cases the high product variety leads to a lower part of execution time. On the other hand just 15 % utilization is typically low for productions which are hardly automated.
Summing up, the category production structure indicators gives a first insight in high level core criteria which allows better interpretation of the following indicators due to the provision of information about the production as a whole.
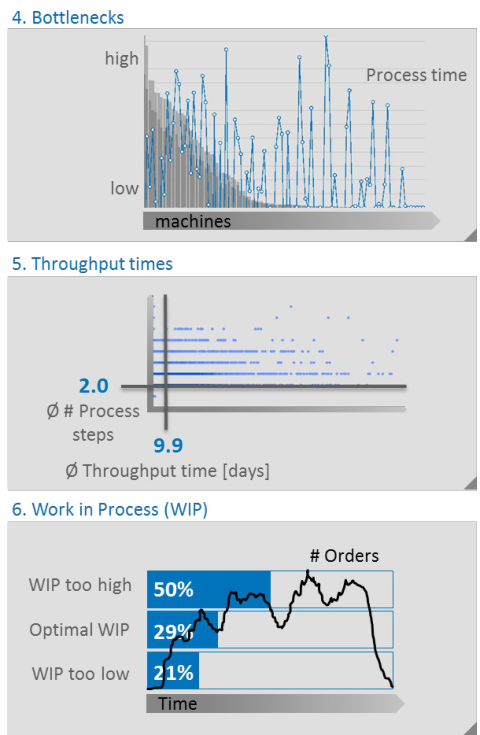
Production Control Indicators The second category focusses on indicators showing the quality of production control. This category includes the indicators Bottlenecks, Throughput Times and Work in Process which are shown in Fig. 5 and explained in the following.
Figure 5. Production control indicators
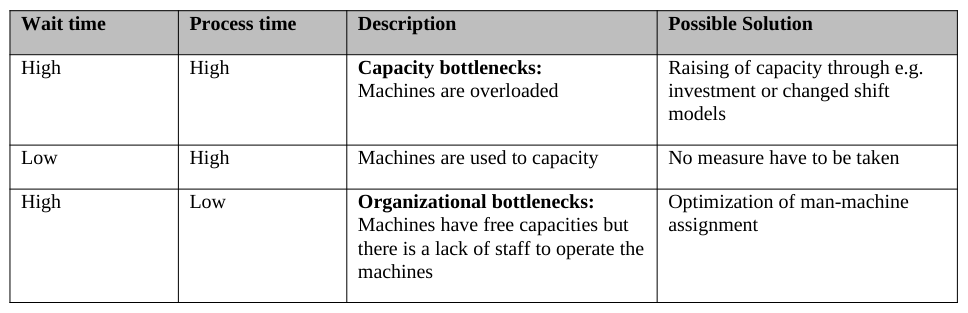
The chart bottlenecks shows the process time and the wait time over the given period for each machine. The process time is the sum of execution time and set up time visualized by the grey bars. The blue line represents the wait time. The comparison of these two factors allows conclusions to the production control performance. Altogether, the machines with long waiting times have to be examined critically, to find out the reasons why materials have to wait long for handling in front of these machines. The following four special cases can be read out:
Table 2: Different cases of Bottlenecks Wait time Process time Description Possible Solution
The chart enables the user to get the needed information at a glance and to concentrate on the machines with most problems. The described analysis and evaluation is supported by several interactive components in detail sheet which help the user to concentrate on relevant machines, relevant periods and relevant data. Therefore, a filter for selection of only a part of the given period is implemented. By click and pull the period can be varied and so be limited to relevant periods concerning the future production scenario. Several further selection possibilities are implemented. To mention just a few ones, it is possible to choose machines separate or to choose all machines with wait time longer than one day. The option to show machines from one special part of the production or to show just wait times or only process times exists as well. The case of Fig. 5 shows that the company has both, capacity and organizational bottlenecks. As mentioned in Table 2, different measure concerning the bottlenecks can be taken. This chart is a hint concerning the structure of shop fabrication due to highly different levels of wait and process times of the machines. In contrary, for line manufacturer the capacity situation of the different machines is more homogenous.
The chart concerning throughput times is visualized in the middle of Fig. 5. At first sight, the average throughput time and the average number of process steps can be read out. The chart shows, visualized as blue points each production order with its number of process steps and its throughput time. The darker the blue, the more often the combination takes place. The typical image of the chart is that the blue points build up a cloud more or less concentrated on the bisecting line. This scenario means, that the more process steps a production order includes the longer the throughput time is. The dispersion shown in Figure 5 leads to another statement. With an average number of two process steps and an average throughput time of nearly ten days the shown orders include only a small number of process steps as well as ten days throughput time is not very long. The throughput times are indifferent to the number of process steps. This is a hint for long wait times. The high spread of the throughput times becomes evident in this chart. An order including two process steps can take from 1 to 219 days until the production end date. This makes it hard to determine delivery dates. As well as the above described chart of the Bottlenecks, this one also includes a time filter to concentrate on relevant periods. With another filter the relevant spectrum of throughput times can be specified. The production orders out of this area were marked in grey, so that the effect of filtering can be seen.
The chart concerning work in process, which means the number of released and not yet finished production orders, is shown at the bottom of Figure 5. The more orders are released, the higher the capital costs are and often the more unpredictable the throughput times are. The object is to find out the range of an optimal WIP level, where the production does not get empty and machines are not underloaded. The interactive component of time filter is implemented in this chart in the same way as in the two other mentioned diagrams. The company used for explanation shows a WIP level which was in 29 % of the observation period in the optimal area but more often with too high (50%). The high WIP level leads to long throughput times whereas the fluctuations lead to a wide spread concerning throughput times. Both phenomena can be seen in the chart throughput times.
Altogether, the category production control indicators serves the evaluation of production control. As mentioned for the single indicators the company’s production control configuration demonstrates some weaknesses. First, organizational and capacity bottlenecks have to be avoided. Second the spread of throughput times has to be leveled. Third the level of WIP has to be kept at a constant and optimal level. The third category of potential indicators will show if it is possible to reach improvements concerning the mentioned weaknesses through adaptions of production control configuration.
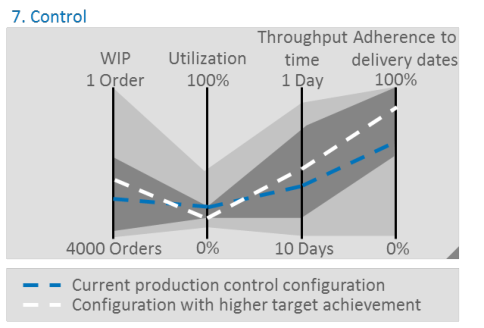
Potential Indicators The third category focusses on the potential laying within a given production structure. Therefore defined changes concerning the configuration of production control tasks were simulated automatically. In a first step the tool builds up a simulation model in Plant Simulation out of the existing feedback data which was used for the first two categories as well. With this model the basis scenario (current production control configuration) and changes concerning order release, sequencing and capacity control were simulated. The results are shown by listing the fulfillment of the four logistic targets of each simulation scenario as could be seen in Fig. 6.
Figure 6. Potential indicators
The blue line marks the current production control configuration, the white line one simulation scenario. The light grey zone marks the limits of the reachable values. This zone could be limited manually concerning acceptable value areas for the company. This is done by the dark grey zone. Due to the contradictions of the four logistic targets the amelioration of one value often leads to disadvantages concerning at least one of the other logistic targets. This phenomenon shows Fig. 6. Whereas the simulation of the sequencing rule Fifo (First in first out; white line) leads to a lower WIP level, shorter throughput times and higher adherence to delivery dates the utilization gets lower.
Summarizing this category shows the possibilities to avoid the determined weaknesses of category two. In the given example the simple simulation of Fifo already leads to an improvement of three logistic targets. Normally not only one but a defined number of simulation scenarios can be compared. Due to the contradictions of the targets, companies finally have to decide to which of the logistic targets they give priority.
Benefits The tool Performance Check is able to give a quick overview over important key indicators of production control with little effort because of using existing data out of the ERP-system and automated building of simulation models. The simple application results in the possibility to use the tool more than once and thus allows the comparison over time. On top of that, the standardized form of the Performance Check leads to comparability between different companies. Due to the interactive elements, the user can filter in each diagram to show just relevant parameters. So the tool could easily be adapted to different questions by choosing e.g. another level of granularity or by limiting the analysis of the production area of interest. Altogether, the information given by the seven indicators, allows the evaluation of the current configuration of production control.
OUTLOOK Further research need exists concerning the interpretation of the evaluation results. Whereas experts are able to interpret the values and to define measures, laymen need some assistance. Therefore a benchmark will be included to each indicator, so that companies can compare if they are better, worse or equal to other similar companies. This will give an important hint concerning the competitiveness of a company. Another component to be included is the automated creation of measures out of the analyzed values. Through defined checks the tool will propose specific measures for each indicator. To give an example, the tool will check the relation between wait time and process time in the bottleneck chart and then will mention the machines which are e.g. organizational bottlenecks due to significant longer wait than process times. Therefore the limits for each of the four mentioned cases in Table 2 have to be defined.
ACKNOWLEDGEMENT
The presented approach for interactive analysis and evaluation of production control is being investigated by the Laboratory of Machine Tools and Production Engineering (WZL) within the publicly funded research and development project: "Cluster of Excellence - Integrative Production Technology for High Wage Countries” (German Research Foundation, DFG).
REFERENCES
Bahaji, N., Kuhl, M. E. (2008), "A simulation study of new multi-objective composite dispatching rules, CONWIP, and push lot release in semiconductor fabrication", International Journal of Production Research Volume 46 No. 14. Baye, M. R. (2009), “Managerial Economics and Business Strategy”. McGraw-Hill Higher Education. Blaha-Kaplans, H. J. (2012), “Bestimmung der Referenzbereiche für die Parameter des großen Blutbildes und der Retikulozyten
gesunder Erwachsener mit den Hämatologie-Analysensystemen Siemens ADVIA 120, Abbott CELL-DYN Sapphire, Sysmex XT-2000i und Sysmex XE-2100“ (Determination of reference areas concerning parameters of full blood count and reticulocytes for healthy adults with the hematology analysis systems Siemens ADVIA 120, Abbott Cell-DYN Sapphire, Sysmex XT-2000i and Sysmex XE-2100). Munich. Fischer, A. (2007), “Modellbasierte Wirkbeschreibung von Prioritätsregeln“ (Model-based description of effects of priority rules). Reports out of IFA, Peter Nyhuis, series editor. Hannover: TEWISS. Goldratt, E., Cox, J. (1984), “The Goal: Excellence in Manufacturing”. Croton-on-Hudson, NY: North River Press. Gressner, A. M., Arndt, T. (2007), “Lexikon der Medizinischen Laboratoriumsdiagnostik“ (Lexicon of medical laboratory
diagnostics). Heidelberg: Springer. Gstettner, S., Kuhn, H. (1996), "Analysis of production control systems Kanban and CONWIP", International Journal of Production Research Volume 34 No. 11. Huang, M., Wang, D., Ip W. H. (1998), "A simulation and comparative study of the CONWIP, Kanban and MRP production
control systems in a cold rolling plant", Production Planning & Control Volume 9 No. 8. Lödding, H. (2008), “Verfahren der Fertigungssteuerung. Grundlagen, Beschreibung, Konfiguration“ (Methods of production control. Basics, description, configuration). Berlin, Heidelberg, New York: Springer. Lödding, H. (2012), “Handbook of Manufacturing Control”. Berlin, Heidelberg, New York: Springer. Milberg, J., Neise, P. (2006), “Organizational Design of Supply Chains, WGP, Production Engineering”. Muckstadt, J. A., Tayur, S. R. (1995), "A comparison of alternative kanban control mechanisms. II. Experimental results." IIE
Transactions Volume 27 No.2. Muenzberg, B., Nyhuis, P. (2009), “Individual Configuration of Production Control to Suit Requirements”, International Conference on Manufacturing and Industrial Engineering, Indonesia. Nyhuis, P., Wiendahl, H.-P. (2009), “Fundamentals of Production Logistics – Theory, Tools and Applications”. Berlin,
Heidelberg, New York: Springer. Nyhuis, P., Muenzberg, B., Kennemann, M. (2009), “Configuration and regulation of PPC”. Production Engineering Volume 3 No. 3. Nyhuis, P., Wiendahl, H.-P. (2012), “Logistische Kennlinien. Grundlagen, Werkzeuge und Anwendungen“ (Fundamentals of
Production Logistics – Theory, Tools and Applications). Berlin, Heidelberg: Springer. Perry, M. (2012), “Understanding blood results: the full blood count”, Practice Nurse Vol. 42 No. 2. Pettersen, J.-A., Segerstedt, A. (2009), "Restricted work-in-process: A study of differences between Kanban and CONWIP", International Journal of Production Economics Volume 118 No. 1. Reinhart, G.; Gyger, T. (2008), “Identification of implicit strategies in production control”. Singapore: Proceedings of the
Industrial Engineering and Engineering Management. Schuh, G., Franzkoch, B., Potente, T., Fuchs, S. (2010), ”Simulation based configuration of value stream oriented production control”. Vancouver: Conference Proceedings POM 21st Annual Conference. Verso, M. L. (1964), “The Evolution of Blood-Counting Techniques”, Med Hist. Volume 8 No. 2. Wiendahl, H.-P. (2008): “Betriebsorganisation für Ingenieure“ (Company organization for engineers). Munich: Hanser. Wiendahl, H.-H., Behringer, (2006), “Stolpersteine der Lieferterminermittlung und -erfüllung“ (Stumbling blocks of
determination and adherence to delivery dates), in: Liefertreue im Maschinen- und Anlagenbau: Stand – Potenziale – Trends (Adherence to delivery dates for equipment and machinery industry: State – Potentials – Trends), Schuh G., Westkämper E. (Ed.). pp.19-32 Wiendahl, H.-P., ElMaraghy, H., Nyhuis, P., Zäh, M., Wiendahl, H.-H., Duffie, N., Brieke, M. (2007), “Changeable
Manufacturing - Classification, Design and Operation”, Annals of the CIRP Volume 56 No. 2. Zaeh, M (2005), “A holistic framework for enhancing the changeability of production systems”, in: 1st conference on changeable, agile and virtual production, CARV 2005, Munich, Germany
LISTED IN THE AHFE DIGITAL BOOKSTORE CATALOGUE
Explore the complete digital volume
Advances in The Ergonomics in Manufacturing: Managing the Enterprise of the Future
Read this individual research paper free through the original publisher, or explore the full digital proceedings book.
ISBN 978-1-4951-2103-6
Explore this ISBN in the AHFE Bookstore ↗Listed in the July 2026 bookstore catalogue; search by ISBN to confirm current availability · Digital book purchase optional