With Exposure To Multiple (2018). The Study of Work Situations. In: Advances in Physical Ergonomics and Human Factors: Part I. AHFE Open Access, vol. 1. https://doi.org/10.54941/10038
Tasks In Annual Cycle Practical Experiences in The Field Daniela Colombini, Enrico Occhipinti EPM, Research Unit Ergonomics of Posture and Movement Don Carlo Gnocchi-ONLUS Foundation Milan ↗
The OCRA method is the reference method chosen in ISO (ISO 11228-3) and CEN (EN 1005-5) standards regarding risk assessment and management of upper limbs repetitive movements and exertions. The method consists of two specific tools (OCRA index and OCRA checklist). In this paper special attention will be devoted to the procedures for the analysis of multiple repetitive tasks.When computing the OCRA index (checklist score) considering the presence of more than one repetitive task, a “traditional” procedure has been previously proposed. This approach, whose results could be defined as “time weighted average”, seems to be appropriate when considering rotations among tasks that are performed almost once every hour. On the contrary, when rotation among repetitive tasks is less frequent the “time weighted average” approach could result into an underestimation of the exposure level. For those scenarios an alternative approach is based on a concept that the most stressful task is the minimum starting point. A peculiar procedure allows to exactly estimate the resulting index within this range of minimum to maximum values. It is possible to apply this approach also for job rotation with weekly or monthly or annual cycle typical of agriculture, supermarket, cleaning sectors. This paper shows criteria and results in different working situation: plant nursery, viticulture (annual cycle).
As to the preliminary criteria for studying the Work-related musculoskeletal disorders of upper limbs (UL-WMSDs), it is to be underlined that all together organizational and biomechanical factors (frequency of technical actions, stereotypy of movements, use of force, postures and awkward movements, lack of recovery times, actual duration of exposure to repetitive tasks, additional factors such as vibrations, cold, hits, etc) are to be considered as a major determinant of risk presence. The European data concerning UL-WMSDs (Eurostat 2004) evidence that productive sectors more affected by such diseases (after manufacturing) are construction, fishing and agriculture. These preliminary epidemiological data concerning these particular sectors (characterized by exposure to several different cycle distribution tasks, be it weekly, monthly or yearly), confirm the need to tackle more systematic studies on biomechanical load risk and their specific correlated damages. The traditional risk analysis methods on subjects exposed to several repetitive tasks, are generally focused on typically “daily” exposure studies (Colombini, 2008; Occhipinti, 2008) In many working sectors however (i.e. in agriculture) exposure may vary in duration and type over a longer period (one week; one month; one year). This study is aimed at: Physical Ergonomics I (2018)
- defining a specific procedure tackling the preliminary organization and inherent risk analysis of all tasks (characterized by biomechanical overload); - setting, on the basis of available models for the analysis of daily exposure, some exposure risk analysis multitask
models taking into account the turnover along such longer exposure periods. - present the results of two applications on the field: plant nursery and viticulture. To validate such models, the specific final result (overall exposure risk index) should be compared with resulting prevalence of workers affected by UL-WMSD. Those data are achievable through active health surveillance programmes; this predictive characteristic is already present in OCRA method exposure to one or more repetitive tasks with daily turnover (Occhipinti, 2007). The final aim of this research project by EPM-Milano Research Unit (www.epmresearch.org) is to present a simple and practical tool (through a software) allowing to automatically estimate the exposure risk of turnover multitasks over long periods by simply outlining exposure durations of each task in the identified period.
METHODS TO EVALUATE THE FINAL EXPOSED INDEX: ORGANIZATIONAL DATA, INTRINSIC INDICES AND THE MATHEMATICAL MODELS General aspects for assessment of exposure levels to works characterized by multi-task turnover
When dealing with an exposure risk assessment (from upper limb biomechanical overload) to multitask works, it is necessary to go through 3 operating stages:
- facing a preliminary organizational study to establish the kind of turnover: the periodicity of the different tasks (implemented by a worker or by the homogeneous group of workers employed in the same tasks in the considered period) repeated in a period of time , daily or weekly or monthly or yearly. - defining the intrinsec risk level of each task, using the OCRA checklist. Intrinsic level means ascribing to the
task a net duration of 440 minutes/shift with 2 breaks, 8-10 minutes each, and a lunch break of at least 30 minutes. - applying specific mathematical models assessing exposure to “multitasks”.
Cyclical turnover and organizational studies on exposure to yearly rotating multiple tasks.
While in the industry turnover periodicity is typically daily, in other productive sectors this periodicity is longer: for example in agriculture it is typically yearly. Each month of the year is characterized by different processing, each including different tasks. Priority objective to this organizational study stage is identification of workers “homogeneous group carrying out the same tasks” over the year (which and how many workers are involved and which tasks they carry out). In a preliminarily report it is necessary to know:
- the name of the different tasks carried-out in the year (A, B, C,…) - the task(s) carried out in each month of the year and the number of hours spent for each tasks in each month of the year (Table 1). With these data the proportional distribution among tasks over the year can be obtained, being derived for each task as a percentage on the total of hours worked in the year (Table 2).The obtained percentages outline the intrinsic time distribution present among developed tasks. But to better describe the time distribution of the tasks presented in the year, it is necessary to reassess the proportion by weighting them on “worked time constants”. Table 3 shows the reference working duration constants expressed in hours/month (160), days/month (20), days/year (220), months work/year (11), worked hours/year (1760). Starting with reference to the constants reported in Table 3, we can calculate the weighted proportional distribution among the tasks developed in the year. The example reported in Table 4 shows this calculation. The total original worked hours/year (from Table 1) are 1680; considering that the constant used is equal to 1760 hours (Table 3), there is a 0.5% reduction of working activity. The result is that the percentages reported in the column of “weighted proportional distribution” (respect to the constant) are lower than those of intrinsic proportional distribution (Table 2). If by contrast, the total of worked hours exceeds the constant, the % reported in the column of calibrated proportional distribution will be higher.
Physical Ergonomics I (2018)
OCRA checklist: final exposure level in 4 different risk levels The OCRA method (Occhipinti, 1998, Colombini 2002) now adopted by ISO (ISO 12228-3) and CEN (EN1005-5) proposes two risk analysis tools: OCRA index and OCRA checklist: this last represents the first model to be used during the first risk assessment stage in a given working situation (mapping stage). Applying the appropriate mathematical model at the obtained partial scores, describing each risk factor, it allows to assess the final exposure level split in 4 different risk levels (green, yellow, red, purple), as described in Table 5.
Table 1 Example of duration of different tasks carried out by a homogenous group of workers over one year
analytically expressed in hours/month (analytical model) DESCRIPTION OF WORKED HOURS / MONTH FOR EACH TASK
% on the total of hours worked in the year ESTIMATE OF PERCENTAGES STARTING FROM WORKED HOURS / MONTH FOR EACH TASK
Table 3 Duration constants of generic working activity to be used to weight exposure duration.
Table 4
Physical Ergonomics I (2018)
Example of calculation of weighted proportional distribution (considering the constant) among the tasks carried out in the year and as compared with intrinsic proportional distribution (worked out from
Table 3).
Table 5 The final score of OCRA checklist matched with OCRA index score and related risk ranges.
- shift net duration for the most representative working shift in a year; - breaks distribution and duration; - duration of non repetitive tasks present in a representative shift; When speaking of intrinsic risk value, we mean assessing each task as if it was the only task developed along the whole shift (approx. 440 net minutes of repetitive task duration with a lunch break of at least 30 minutes and two breaks of minimum 8 minutes). The second step is to apply, to the intrinsic risk index values, the appropriate OCRA multiplies for specifically modifying them considering both the breaks distribution and the net duration of repetitive task.
OCRA checklist: assumptions of calculation models for yearly rotation multitask exposure.
Starting from the data derived from the organizational data collections, 2 calculation models were assumed to calculate the multitask annual exposition: a) the traditional weighted average but redefined on time constants; b) complex multitask formula for OCRA.
a) Calculation of “ average index weighted by exposure time constant ” It is the same when repetitive task rotation occurs at least every hour and half during a shift: equation (1).
Checklist OCRA Multitask Simple = [( pA x % tA) + (pB x % tB) +….+(i..pN x % tN)] x Md (1) Where: “pA”, “pB”, etc. are the checklist intrinsic scores of each task and %tA, %tB etc. represent the corresponding duration proportions (in %) in relation to the constants (Table 3) Md = duration multiplier considering the total net duration of repetitive tasks in the shift that is the sum of each repetitive task duration (Table 6)
Physical Ergonomics I (2018)
Table 6 Calculation of the OCRA checklist final score with relation to repetitive work net duration.
- duration and distribution of breaks and non repetitive tasks - the net duration of repetitive tasks in a typical day of the year - the OCRA checklist intrinsic values of each task, re-evaluated considering the actual, above reported, organizational factors present in a typical shift (break distribution and .net duration of repetitive tasks).
b) Calculation of exposure index with the OCRA Multitask Complex model The calculation uses the application of Multitask Complex Model, the same assumed for daily exposure to several tasks with rotation (in a daily shift) exceeding one every hour and half: see equation (2). To be able to calculate Dum i (duration multiplier of each task in the year), it was devised to transform the yearly exposure proportion (those re-weighted considering duration constant) into fictitious daily shift minutes . In this case the mathematical model uses the “worst working situation” (the task most at risk recalculated in relation with its real duration as well as with the total duration of all repetitive tasks in the shift). This first estimation is to be weighted with the values and durations of all the other repetitive tasks present in the shift. The complex formula used is the following: Checklist OCRA Multitask Complex = score1(Dum1) + (∆score1 x K) (2)
Where: 1,2,3,…,N = repetitive tasks ordered by exposure level (1= the highest) using for calculating risk index the Duration multiplier (Dum i) related to their actual duration in the shift. Dumi = Duration multiplier considering the actual task duration in the shift Dumtot = Duration multiplier considering the total duration of all repetitive tasks in the shift ∆ score1 = difference between: score of task 1 considering Dumtot and Score of task1 considering Dum1 K = (score 1 max * FT1) + (score 2 max * FT2) +…+( score N * FTN) (score 1 max) Score i max = Score taski considering Dumtot FTi = task time fraction(value 0 to 1) in relation to the total duration of ripetitive works.
Plant nursery in the world The flower-growing segment of agriculture is a very characteristic that has peculiarity for cultural, economic and social aspects. Nursery flowers are the branch that concern both cultivation and sale of flowers, houseplants and garden. This is characterized by strong seasonality of products due to specific periods of flowering and growth. The characteristics of many species concerned give rise to a complex and various market demand. Currently, the species covered by the workers in nursery plant are about 2000 in various families; the flower-growing category includes flowers, leaves and fronds. Crops can be in the greenhouse and field. Currently, the sector is growing on the world scene, with new producer countries. The total world area devoted to floriculture is between 260,000 and 290,000 acres, plus 650,000 hectares of nurseries with a workforce of 2,000,000: the distribution affects all continents but particularly some African countries have become exporters, and China has a strong development. In South America the largest producer of cut flowers is Colombia with 140,000 employees in companies and another producing country is Ecuador. The floriculture sector in Italy has a population of about 38000 companies operating on 32000 hectares of total area with a number of employees that exceeds 100,000 people. Traditionally, companies are small family-run. Review of reported occupational injuries in California agriculture by AgSafe shows that sprains and strains predominate as major types of injury, accounting for 43% of all reported agricultural occupational injuries. It should also be noted that, according to the AgSafe data, nurseries shared with other agricultural commodities a pattern of high rates of sprain and strain injuries. Those data suggested that 48,9% of all reported injuries in horticultural specialities
Physical Ergonomics I (2018)
(including nurseries) were sprains and strains. The problem of WMSDs in nurseries workers is well known but the study of the relationship between diseases and work has not been well assessed yet.
Task analysis in plant nursery : tasks in annual cycle Task performed in the floriculture and plant nursery work are seasonal and there are only few tasks that are performed more than half of the year. In Figure 1 the main tasks are detailed, additional tasks may appear, for example in a particularly field or new greenhouse. Companies involved in cultivating and growing the different types of varieties according to the specified on the species. The tasks occur in seasonal cycles due to the need for growth and dormant. Among the most frequently repeated stage, independently of the variety, it can be included:
- re-invaded cuttings - planting - pruning - grooming plants - manual irrigation. Ordinary activities for the management and maintenance of nurseries and greenhouses are indicated in the following phases:
- weeding blooms and grooming - cleaning supported systems.
Case study The study was conducted, according to the duration of the annual work cycle, on the different activities performed by employees in relation to individual phases. For this application was selected a group of workers, homogeneous for activities performed, for equipment used, for working seniority and experience. Each month involves different phases of work, depending on growing season or the latent stage. Work tasks were considered only if lasting at least 1% in the reference month. Each task was filmed for the duration of a single phase over several cycles, in different situations: front, from behind, the left side and right side in order to get as much details as possible about the repetitive movements and awkward postures of the shoulder, elbow, wrist, hand and fingers. They also show the whole body posture to assess the position of the neck, spine and lower limbs.
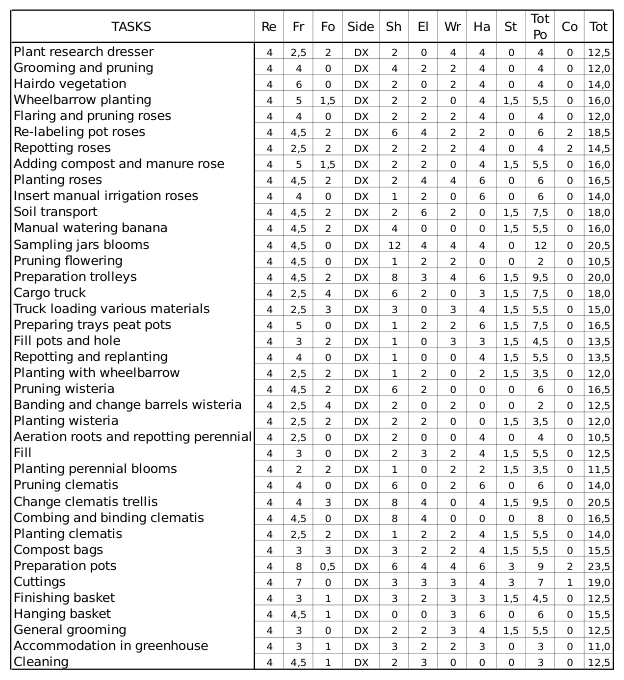
Intrinsic upper-limb level of every task All the intrinsic values of right upper limb obtained are detailed in Table 6.
Intrinsic postures level of every task To complete the picture of the biomechanical overload, it was assessed the postural commitment of any task, regard to the neck, back and lower limbs. The neck was assessed for posture in extreme flexion or extension in relation to the position maintained by the trunk (which can be in full flexion, moderate flexion or extension). The lower limbs are particularly busy: positions on the floor with knees fully flexed or partially kneeling or with a muscular effort due to the squatting posture. For any particular posture the commitment was quantified for the duration of the task, as evidenced when it is maintained for at least half the time, almost all the time or for as long as no changes of position, as shown in Table 7. The numbers adopted in the Table as scores are only descriptive scores with the simple function to order the awkward postures from the best to the worst.
Physical Ergonomics I (2018)
Figure 1: the main work tasks during annual cycle
Figure available in the original PDF paper.
Results: risk assessment of annual exposure analysis to repetitive tasks The special annual activities that involve the various stages, in rotation according to the particular types of plants, are carried out with intensity and duration variables. In Table 8 are represented the various activities in each month expressed in % of the total duration of the hours/month for the homogeneous group of workers considered. It represents the different duration of the working activities during each month of the year.
Physical Ergonomics I (2018)
Table 6: Checklist OCRA intrinsic value
Table 7 Identification of the main postures of the back of the neck and lower limbs taken during the working
phases.
Table 8: Percentage (% ) Hours worked / Month / Employee of the total hours worked / year
Table available in the original PDF paper.
% Hours worked / month/ employee of the total hours workers/ year
30%
25%
20%
15%
10%
5%
0%
Jan Feb Mar Apr May Jun Jul Aug Sep Oct Nov Dec
The two mathematical models, before proposed and described, have been applied to both upper limbs, using the intrinsic risk values calculated on the temporal assignments, and the results of annual exposure index values obtained are as follows described in Table 9:
Table 9 The risk assessment final index obtained with the two mathematical model proposed
The results obtained indicate that the method “Multitask Complex” (it does not use average mathematical model) could be the best indicators to estimate and predict the risk in an annual exposure, but to complete those studies more data need to be collected on farms in the sector possibly related to the clinical data.
Viticulture This paragraph reports an evaluation of biomechanical risk on farms in Italy (Tuscany, Piedmont and Marches) adopting different growing systems, to point out the most dangerous activities for biomechanical overload. Limited to the Tuscany case the workers were submitted to a clinical examination especially finalized to study the spine and upper limb work-related musculoskeletal disorders. The results were inserted in a dedicated software.
Risk assessment: materials and methods To obtain an exposure index in vine-growing the study was conducted in three phases: 1) analysis of work organization, 2) analysis of each working task and 3) ergonomic analysis using OCRA check-lists and NIOSH RNLE method (Colombini, 2005). The following phases were performed:
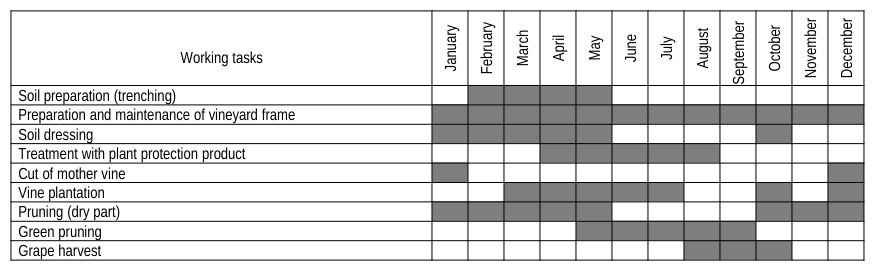
1) To analyse the work organization, farms were previously selected and relevant data (number of workers, working tasks and hours/months for each task) collected in a database. After that the production methods and working tasks were analysed and a “list of tasks yearly distributed” was created. (Table 10). 2) To identify working tasks characterized by repetitive movements the “yearly job description” was used. The following working tasks were identified: cut of mother vine, “wire straining ”, pruning (dry and green part), grape harvesting.
Physical Ergonomics I (2018)
3) All working tasks were videorecorded and ergonomic analysis using OCRA checklists for repetitive movements of the upper extremities and RNLE NIOSH method for manual material handling were performed.
Table 10: Working tasks carried out in vine-growing during the year
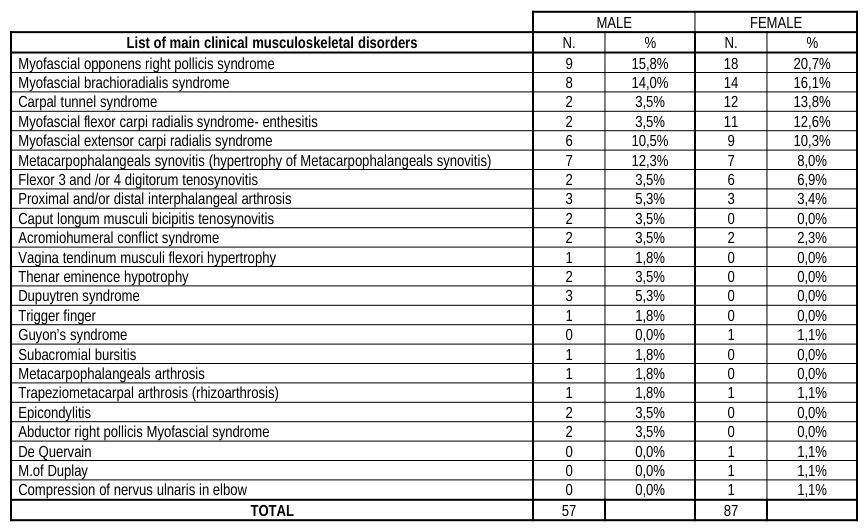
Clinical evaluation: Materials and Methods The percentages of the pathologies were estimated on the total number of the exposed workers at the beginning of the clinical examination (No= 125) even if it was not possible to visit all the workers. Only 42 of 125 exposed workers were allowed to submit to a clinical examination by a specialist in rheumatology. The medical doctor did only clinical diagnosis (without instrumental clinical tests) deriving the information in Table 11: in the future the clinical diagnosis will be completed by means of more objective and specific instrumental tests
Risk assessment: Results
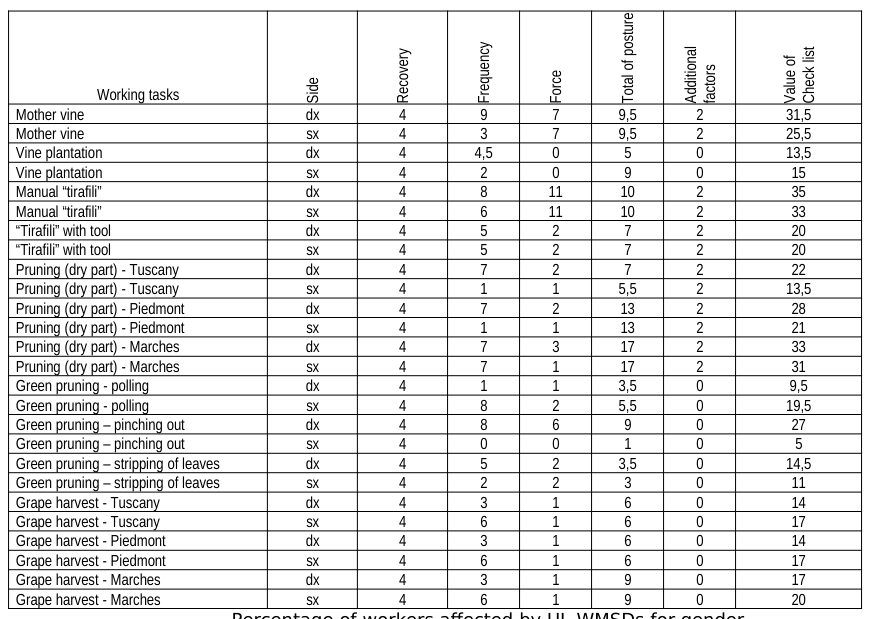
Table 12 shows that the greater part of the tasks analysed are included in red-violet band of OCRA check list, confirming that there is a high risk of biomechanical overload of the upper extremities for farmers. Green pruning – pinching out (left hand) is included in the green band (acceptable risk) whit a value of 5 Check List OCRA. Green pruning – polling (right hand) and green pruning – stripping of leaves (left hand) are included in the yellow band (borderline risk) with a value of 9.5 and 11 respectively. The greater part of the tasks analysed present a value of between 13.5 to 22. In these tasks the middle – light risk could produce a high incidence of pathologies. Mother vine (left/right hand), manual “wire straining” (left/right hand), pruning (dry part) – Piedmont (right hand), pruning (dry part) – Marches (left/right hand), green pruning – pinching out (right hand) are included in the violet band (very high risk) whit a value of more than 25.5. These results evidence the same risk, of biomechanical overload of the upper extremities, for female and male. Regarding the manual material handling in the grape-harvest, the band of risk changed from yellow for farmers (male and female) who worked on farm tractor (Lifting Index respectively 0.82 and 0.99) to green for farmers on the land (Lifting Index 0.73).
Clinical evaluation: synthesis of the results The total exposed population was composed by 125 workers: 82 male and 43 female: they operated in 4 farms in Tuscany. Only 42 of them were allowed to submit to a clinical examination by a specialist in rheumatology: 22 male and 20 female. The average age of the group is 49 (range 23 – 77) for male and 44 for female (range 27 – 59); the average working time in pruning 10 years (range 1 – 42) for male and e 5 years (range 0,5 – 15) for female. In Ta- ble 13 the percentage of the affected workers are reported.
Physical Ergonomics I (2018)
In Figures 2 the different distributions for joint of the UL-WMSDs and Figure 3 the prevalence of UL-WMSDs for number of pathologies/person are reported for males and females In the diagrams the presence of high percentages of right wrist tendinytis and Carpal tunnel syndroms is evident both in males and females.
Table 11: Musculoskeletal pathologies present in the visited viticulture workers (42 pruning workers) MALE FEMALE List of main clinical musculoskeletal disorders N. % N. % Myofascial opponens right pollicis syndrome 9 15,8% 18 20,7% Myofascial brachioradialis syndrome 8 14,0% 14 16,1% Carpal tunnel syndrome 2 3,5% 12 13,8% Myofascial flexor carpi radialis syndrome- enthesitis 2 3,5% 11 12,6% Myofascial extensor carpi radialis syndrome 6 10,5% 9 10,3% Metacarpophalangeals synovitis (hypertrophy of Metacarpophalangeals synovitis) 7 12,3% 7 8,0% Flexor 3 and /or 4 digitorum tenosynovitis 2 3,5% 6 6,9% Proximal and/or distal interphalangeal arthrosis 3 5,3% 3 3,4% Caput longum musculi bicipitis tenosynovitis 2 3,5% 0 0,0% Acromiohumeral conflict syndrome 2 3,5% 2 2,3% Vagina tendinum musculi flexori hypertrophy 1 1,8% 0 0,0% Thenar eminence hypotrophy 2 3,5% 0 0,0% Dupuytren syndrome 3 5,3% 0 0,0% Trigger finger 1 1,8% 0 0,0% Guyon’s syndrome 0 0,0% 1 1,1% Subacromial bursitis 1 1,8% 0 0,0% Metacarpophalangeals arthrosis 1 1,8% 0 0,0% Trapeziometacarpal arthrosis (rhizoarthrosis) 1 1,8% 1 1,1% Epicondylitis 2 3,5% 0 0,0% Abductor right pollicis Myofascial syndrome 2 3,5% 0 0,0% De Quervain 0 0,0% 1 1,1% M.of Duplay 0 0,0% 1 1,1% Compression of nervus ulnaris in elbow 0 0,0% 1 1,1% TOTAL 57 87Table 12: Results of OCRA Check list for each of the working task analysed
Table available in the original PDF paper.
Physical Ergonomics I (2018)
Table 13:Figure 2: Distribution of the different UL-WMSDs for each joint and for gender
Figure available in the original PDF paper.
% WM SDs
ARTICULATION
Figure 3. Physical Ergonomics I (2018)
Figure available in the original PDF paper.
Prevalence of UL-WMSDs for number of pathologies/person for males and females
In vine-growing there is a medium-high risk for repetitive movements of the upper extremities, indicating the need to begin actions to improve the work. The same holds for the manual material handling in the grape-harvest, especially for farmers who work on farm tractor. The results of vine growing is used to evaluate the risk of each worker based on the task and the hours worked. The agricultural work implies a marked risk of musculoskeletal disorders as confirmed by our study. Clinical examination, even if preliminary, indicates that this specific working population, spending many months a year in pruning vine and olive, show a specific occupational musculoskeletal hand disease that we can perhaps call “the pruning hand” characterised by Myofascial opponens right pollicis syndrome, Myofascial brachioradialis syndrome, Carpal tunnel syndrome, Myofascial flexor syndrome and extensor carpi radialis syndrome. Instrumental clinical tests will be carried in the future out to get a further confirmation of the preliminary clinical examination.
Conclusions
In some productive areas (agriculture, construction, cleaning, food, etc.) the need is emerging to face upper limb biomechanical overload. Exposure assessment is much more complex being characterised by the presence of several working tasks over periods longer than the current working day (weekly, monthly, yearly turnover).The present work reports organizational study procedures as well as exposure models (starting from OCRA checklist intrinsic values per each identified task) to get to assess the final exposure value via two calculation model assumptions.. The future work allowing selection of the most reliable model (because more predictive), will necessarily go through the collection of epidemiological data. Now collection points of this information are active in the EPM International Ergonomics School in Italy, in Spain and in different South America Countries. The first national data on vineyard pruning and olive harvest in the Siena area (approx 90 workers) and other fruit harvesting in the Romagna area (approx 50 workers), packaging fruits (111 workers) seem to confirm once again better prevision for OCRA Multitask Complex model. In the meanwhile usable software will be available and able to provide, once final organizational data have been input as well as different task intrinsic indices, the automatic computing of exposure levels to these extremely complex work organizational models.
References
Colombini, D., Occhipinti, E,, Grieco, A. (2002). “Risk assessment and management of repetitive movements and exertions of upper limbs”, Elsevier Science, Amsterdam.
Physical Ergonomics I (2018)
Colombini, D., Occhipinti, E. (2008). “The OCRA Method (OCRA Index and Checklist). Updates with special focus on multitask analysis”. Conference Proceedings. AHFE 2008 Las Vegas. Eds W. Karkwoski and G. Salvendy. ISBN 978-1-60643-712- 4. Colombini, D., Occhipinti, E., Fanti, M. (2005). “Il metodo OCRA per l’analisi e la prevenzione del rischio da movimenti
ripetuti”. Franco Angeli, Milano. Occhipinti, E., (1998). “OCRA, a concise index for the assessment of exposure to repetitive movements of the upper limbs”.
Ergonomics 41(9), 1290-1311. Occhipinti, E., Colombini. D. (2007). “Updating reference values and predictive models of the OCRA method in the risk assessment of work related musculoskeletal disorders of the upper limbs (UL-WMSDs)”. Ergonomics, 50(11), 1727–1739. Occhipinti, E., Colombini, D., Occhipinti, M, (2008). “Metodo Ocra : messa a punto di una nuova procedura per l’analisi di
compiti multipli con rotazioni infrequenti”. La Medicina del Lavoro, 99(3), 234-241.
Physical Ergonomics I (2018)
LISTED IN THE AHFE DIGITAL BOOKSTORE CATALOGUE
Explore the complete digital volume
Advances in Physical Ergonomics and Human Factors: Part I
Read this individual research paper free through the original publisher, or explore the full digital proceedings book.
ISBN 978-1-4951-2104-3
Explore this ISBN in the AHFE Bookstore ↗Listed in the July 2026 bookstore catalogue; search by ISBN to confirm current availability · Digital book purchase optional