Shu Muraji, Tsuneyuki Yamamoto, Masayuki Kurihara, Takashi Suzuki, Miwa Nakanishi (2022). A Product Design Process to Evaluate Users’ Intrinsic Satisfaction—Designing Center Consoles in Cars. In: Advances in Ergonomics In Design, Usability & Special Populations: Part II. AHFE Open Access, vol. 19. https://doi.org/10.54941/ahfe1001229
Popular products such as cars, consumer electronics, and electronics have attained a high level of efficiency, usability, and performance. To increase user satisfaction by improving these aspects becomes very difficult. Since the standards of the users are becoming diverse, products that are superior in these aspects are not necessarily accepted, which is seen in the recent trend where users accept some mobile phones. Therefore, the introduction of a more comprehensive evaluation in the design process is necessary to satisfy the users’ intrinsic satisfaction. This study aims to suggest a process to determine a products’ design using intrinsic user satisfaction as indexes. Specifically targeting the center console in cars, this study models the relationship of the users’ intrinsic satisfaction and design elements of a car. In addition, by formulating this relationship, this study establishes a quantitative method to evaluate the users’ intrinsic satisfaction.
Popular products such as cars, consumer electronics, and electronics have attained a high level of efficiency, usability, and performance. To increase user satisfaction by improving these aspects becomes difficult. Since the standards of the users are becoming diverse, products that are superior in these aspects are not necessarily accepted, and this is seen in the recent trend where users accept some mobile phones. Therefore, the typical design process of improving products by repeated evaluations of efficiency, usability, and performance needs to be improved. This can be performed by introducing a new viewpoint that contributes the users’ satisfaction to the evaluation, and deriving the comprehensive results of each evaluation by considering the balance of the results. These will be important keys for improving users’ intrinsic satisfaction.
Recently, user experience (UX) has attracted attention as a concept to discuss users’ intrinsic satisfaction obtained from products. Beginning with ISO9241-210[1], Microsoft (Windows User Experience Guidelines [2]) and Apple (Apple User Experience Guidelines [3]) documented the definition of UX. In general, UX is a concept to pursue not only the value of the products itself but also the comprehensive value of the experience obtained through interaction with the products. Also, Nakanishi divided the interactions between users and products into three phases in a time series, and (as to improve UX) enumerated that the user should feel that they “want to use,” are “comfortable using,” and “want to continue to use” [4]. It was pointed out that the usual design process has been biased to the “comfortable using” phase, and evaluation development for the other two viewpoints is necessary [5][6].
In this study, intended for an interface in a car, i.e., the center console, consisting mainly of a heater control switch, construction of a design model that determines its design elements based on how much it improves intrinsic users’ satisfaction, i.e., how much it improves UX, was attempted. By structurally representing the relationship between essential user satisfaction and design elements and formulating this relationship, it is expected that it will be possible to estimate the height of UX achieved by particular combinations of design elements and to find a combination of design elements that will achieve a high UX in the design process.
METHOD
Object Today, in a general car being supplied to the market, the type of heater control switch is different depending on the car model, but all of them have high ease of use, function, and performance. In fact, according to our pilot research, the proportion of users that mentioned the heater control switch as a factor of feeling (particularly satisfaction) with the components of their car in comparison to other cars is only 3%. This shows that the contribution of this element, the heater control switch, to UX is not large at present. Moreover, when asked about satisfaction with the center console of users’ cars, including the heater control switch, relating to the beauty and unity of the car concept, it accounted for 57%. Therefore, high usability is already natural for users. Based on this information, in this study, we pursued the design of a heater control switch that provides high UX to a car user, considering the improvement of one of the visual images as an effective strategy. We aimed to construct a design model focusing on a visual image.
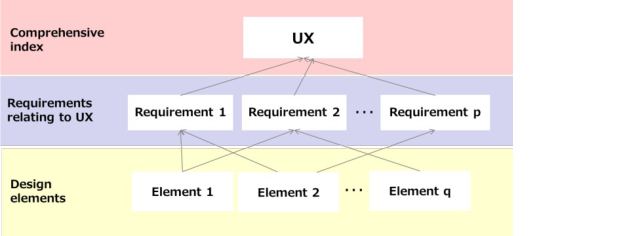
Structuring of the Relationship between UX and Design Elements As mentioned in the previous section, UX is a concept that refers to the comprehensive value. Therefore, Figure 1 shows the hierarchical structure. UX, as a comprehensive value, is composed of several requirements and each design element impacts each requirement. This was used as a framework for this study.
Figure 1: Framework of this study
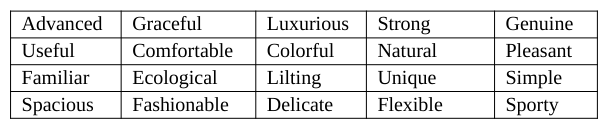
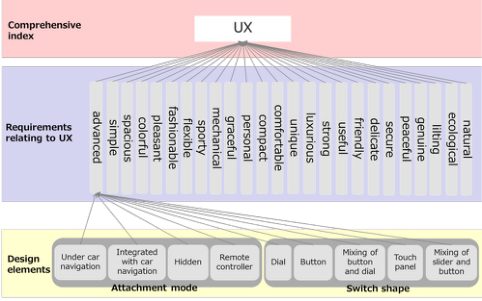
Car manufacturers are committed to capture the diverse standards of users at all times, and this is reflected in the designs of car models. From the web page of 128 models provided by 18 car manufacturers in Japan and overseas, the words represented by the images were extracted, giving a total of 122 species words. Furthermore, Table 1 shows similar words and these words were abstracted in 25 image words by the KJ method. Currently, we can interpret these words as the requirements constituting UX that car manufacturers assume. Therefore, we considered these 25 words as the middle layer of Figure 1, i.e., the requirements of UX. Conversely, with the architect of the heater control switch, we discussed the design elements of the heater control switch that affect the visual image, and we preferentially selected the switch shape and attachment mode. In addition, for each of those design elements, we discussed several instances with varying UX. Specifically, we mentioned instances for each design element, the four expected assuming the installation of car navigation and the five expected assuming input by hand in regard to the switch shape. Design elements and instances of them are summarized in Table 2. In this way, the framework of this study (Figure 1) is embodied again in Figure 2.
Secure Peaceful Compact Mechanical Personal Table 2: Design elements and instances Design elements Instances
Figure 2: Embodiment of the framework of this study
Experiment Next, to clarify the impact of each node-to-node in the hierarchical structure shown in Figure 2, experiments were conducted. Subjects visually experienced simulated center consoles composed of different design elements and instances through 3DCG images. For each 3DCG image, they evaluated their comprehensive satisfaction and the sufficiency of the requirements composing them.
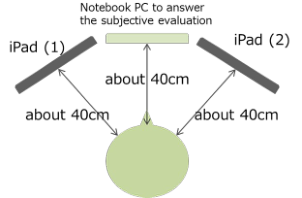
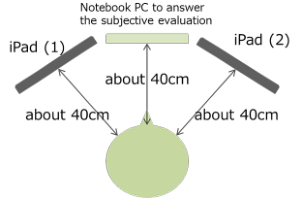
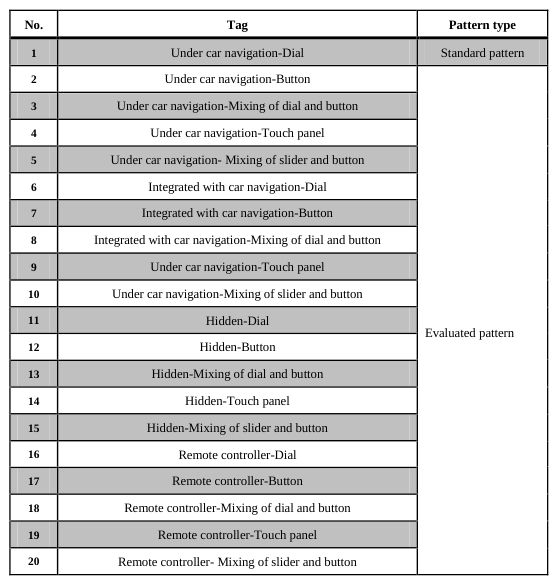
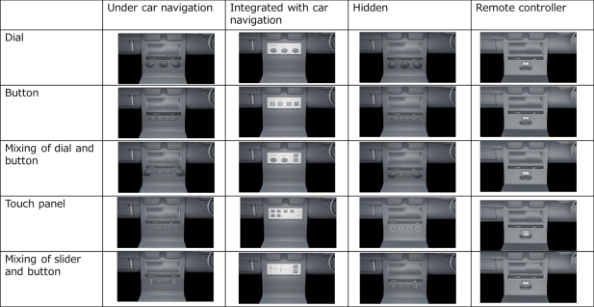
Task of the Experiment In this experiment, we presented a pattern of a center console combined with different design elements (3DCG image) to the subjects. After they watched each pattern, they scored for each 26 evaluation items, which were composed of comprehensive satisfaction and requirements composing satisfaction, on a scale of −100 to 100. In the 20 patterns of combined attachment mode and switch shape, one pattern (Under car navigation-Dial) is standard pattern, while the other 19 patterns are evaluated patterns. We presented the standard pattern before showing each evaluated pattern to the subjects. Setting 0 as the score of the standard pattern, the subjects scored each evaluated pattern. Figure 3 shows the experimental environment. Figure 4 shows the experimental procedure. First, the subjects watched a 3DCG image of the standard pattern presented on an iPad (1). Then, they watched the 3DCG image of the evaluated pattern on an iPad (2). These subjects watched the 3DCG pattern for the first 30 s, and then scored each evaluated item while watching the 3DCG image after the first 30 s. All 3DCG images were 15 s and looped automatically. The subjects could watch the standard pattern as many times as they wanted. After completing the evaluation of one pattern, they continued to evaluate the next pattern after watching a blank image for 20 s to remove any influence from the previous pattern. The presentation order of the evaluated patterns is random. Table 3 and Figure 5 show all evaluated patterns.
Figure 3: Experimental environmentFigure 4: Experimental procedureTable 3: All evaluated patterns in this experiment No. Tag Pattern typeFigure 5: All evaluated patterns in this experiment
Recorded Items
Table 3 shows all recorded items. Subjects scored each item on the screen shown in Figure 5. In addition, we provided open-ended entry spaces to write what they felt for each pattern.
Table 4: All recorded items
Table available in the original PDF paper.
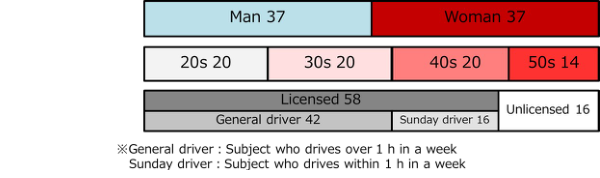
Subjects The subjects were 74 people, shown in Figure 6, in a balanced spread considering attributes such as gender and age. To search for the potential needs in a car, a certain percentage of these subjects were unlicensed or Sunday drivers who do not drive daily.
Figure 6: Attribute of subjects
Ethical Considerations We explained the experiment in writing and orally to the participants and acquired a signed consent form. In addition, we analyzed the data in encrypted form so that it was not possible to match the data to an individual.
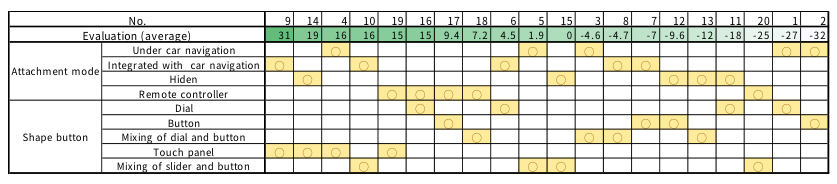
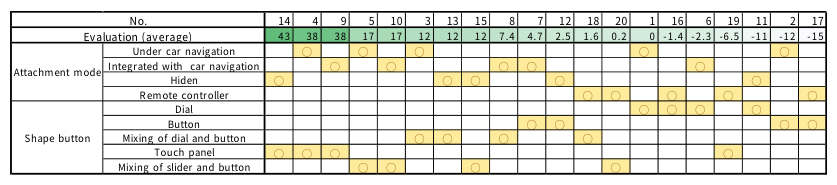
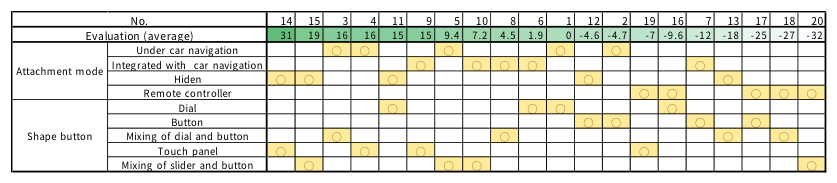
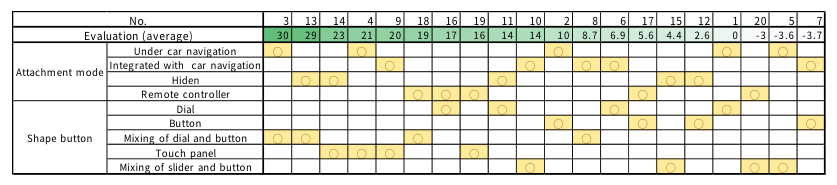
RESULTS AND CONSIDERATION First, we focused on comprehensive satisfaction. Tables 5a–d show the evaluation results (average) for all 20 patterns, including evaluated and standard patterns, with the structure of those design elements and instances listed in descending order. No. 4, 9, and 14 received a high evaluation for all generations. Those switch shapes were touch panels. In addition, there were no patterns that received a consistently low evaluation for all generations. Conversely, the evaluation of some patterns was divided by generation. In particular, No. 16, 17, and 19, whose attachment modes are remote controllers, got a high evaluation from subjects in their 20s, a lower evaluation from those in their 30s, and the lowest evaluation from those in their 40s. The pattern whose attachment mode is under car navigation and the switch shape is a mixing of dial and button got the highest evaluation. It is found in traditional cars, in particular, luxury models.
Table 5a: Comprehensive satisfaction for each evaluated pattern for subjects in their 20s (average) No.Table 5b: Comprehensive satisfaction for each evaluated pattern for subjects in their 30s (average) 14 4 9 5 10 3 13 15 8 7 12 18 20 1 16 6 19 11 2 17 43 38 38 17 17 12 12 12 7.4 4.7 2.5 1.6 0.2 0 -1.4 -2.3 -6.5 -11 -12 -15 No. Evaluation (average)Table 5c: Comprehensive satisfaction for each evaluated pattern for subjects in their 40s (average) 14 15 3 4 11 9 5 10 8 6 1 12 2 19 16 7 13 17 18 20 31 19 16 16 15 15 9.4 7.2 4.5 1.9 0 -4.6 -4.7 -7 -9.6 -12 -18 -25 -27 -32 No. Evaluation (average)Table 5d: Comprehensive satisfaction for each evaluated pattern for subjects in their 50s (average) 3 13 14 4 9 18 16 19 11 10 2 8 6 17 15 12 1 20 5 7 30 29 23 21 20 19 17 16 14 14 10 8.7 6.9 5.6 4.4 2.6 0 -3 -3.6 -3.7 No. Evaluation (average)
By objectively examining the results from the experiment shown in the previous section, the tendency for each generation was found. For those in their 20s, the pattern with a touch panel switch shape seen in a relatively new car model and the remote controller not seen in almost all existing car models both received high evaluations. They trended to like the newness and similarity to other information equipment. The touch panel also appealed to those in their 30s, and the pattern whose attachment mode is under the car navigation with a switch shape a mix of dial and button seen in general cars also received a high evaluation. They tended to like the newness of one and the familiarity and usability of the other. Those in their 40s avoided the remote controller preferred by those in their 20s. Instead, the pattern whose attachment mode is hidden received a high evaluation, and it is not seen in existing car models. For those in their 50s, the pattern whose switch shape is mixing of dial and button seen in existing center consoles, the pattern whose attachment mode is remote controller and hidden both received relatively high evaluations. These results suggest that the weight of requirements composing comprehensive satisfaction and the degree of contribution of each design element to each requirement are different depending on the generation. In an attempt to clarify the requirements composing UX, comprehensive satisfaction for each generation and design elements, we attempted to quantify the hierarchical model shown in Figure 2.
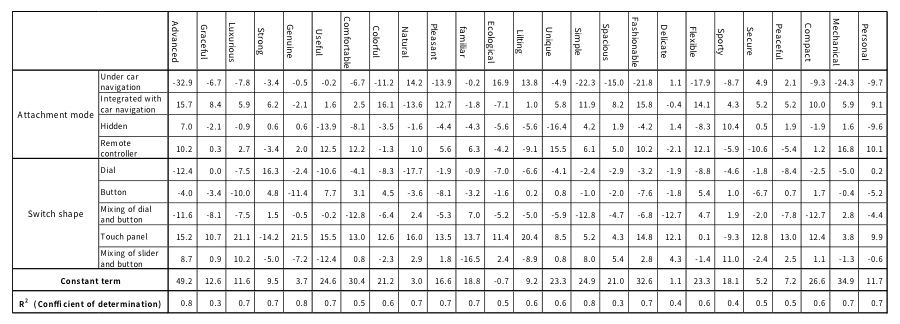
Quantification of the Impact on UX from Requirements Composing UX From the experiment, we obtained subjective evaluation data about comprehensive satisfaction and requirements for comprehensive satisfaction when each subject visually experienced all 20 pattern center consoles, including evaluated patterns and a standard pattern, by 3DCG image. Therefore, we applied multiple regression analysis to each generation’s data by considering the score given for comprehensive satisfaction as an objective variable and considering the score given for each requirement as an explanatory variable. However, it is not necessarily appropriate to apply all requirements in this state as explanatory variables because requirements are 25 items on aggregate. Therefore, we grouped the score given for each requirement by cluster analysis (Ward method), and applied the average score in each cluster as the explanatory variable. The number of clusters were examined in terms of whether the meaning of each cluster is clear. Consequently, five clusters were found in any generation. Tables 6a–d show the coefficient of determination and partial regression coefficients of the multiple regression equation for each generation. From the results, the coefficient of determination for the multiple regression equation given from the 50s data was not high, but the coefficient of determination for all other generations was greater than 0.5 and assumed to have a relatively high accuracy. For the 20s, 30s, and 40s, five clusters are similar between the generations. There was no significant difference in sensitivity for the design of the product. Conversely, the weight for each cluster depends on the generation. The standards depend on the generation. Specifically, in the 20s, while the weights for Fashionable/Advanced, Grace/Comfort, and Nature/Security are high, Strength has a negative contribution to comprehensive satisfaction. In 30s, while the weights for the Fashionable/Grace, Nature/Security are high, Strength/Sporty has a negative contribution to comprehensive satisfaction. In 40s, the weights for each cluster are well balanced, and Sporty has a positive contribution to comprehensive satisfaction. In 50s, it is difficult to implicate for each cluster. It suggests that sensitivity to the design of a product is very different for individuals in the same generation. It is probably that this is one of the factors that reduced the accuracy of regression analysis.
Table 6a: Coefficient of determination and partial regression coefficients of the multiple regression equation given from the data of the 20s
Table available in the original PDF paper.
Table 6b: Coefficient of determination and partial regression coefficients of the multiple regression equation given from the data of the 30s
Table available in the original PDF paper.
Table 6c: Coefficient of determination and partial regression coefficients of the multiple regression equation given from the data of the 40s
Table available in the original PDF paper.
Table 6d: Coefficient of determination and partial regression coefficients of the multiple regression equation given from the data of the 50s
Table available in the original PDF paper.
Quantification of the Impact on the Requirements Composing UX from Each Design
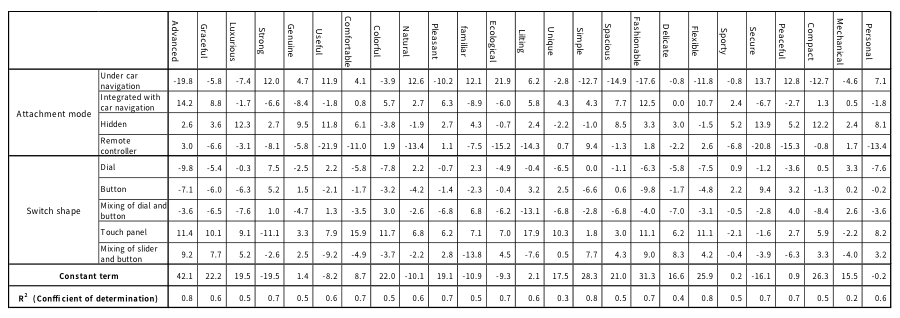
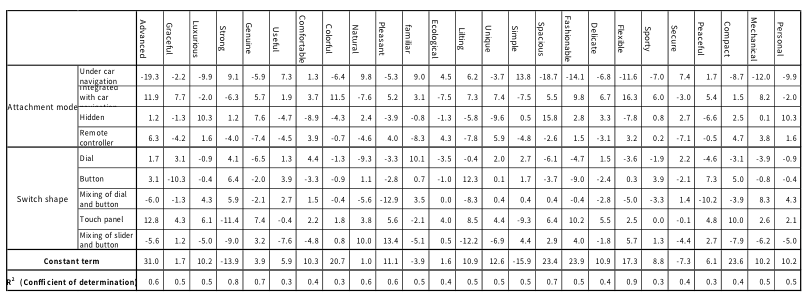
Element and Design Next, to quantify the impact on the requirements composing UX from each design element and design, we applied the quantification method I analysis to each generation’s data by regarding the score given for requirements composing comprehensive satisfaction as objective variables and regarding the combination of each design elements and instances as explanatory variables. Tables 7a–d show the category scores and coefficients of determination for each requirement given from the quantification method analysis by generation. Looking at the results, first, the patterns whose attachment mode is under car navigation and switch shape is dial, button, and mixing of dial and button have negative impacts on the clusters relating to fashionable, grace, and newness for any generation. On the contrary, the patterns whose attachment mode is hidden and remote controller and switch shape is touch panel and mixing of slider and button have positive impacts on the clusters relating to fashionable and newness for any generation. It suggests design elements and instances not found in general cars are perceived to be new and fashionable. In addition, the patterns whose attachment mode is under car navigation have a positive impact on the cluster relating to Security/Nature for any generation. The most familiar attachment mode in general cars is considered a natural and secure image for any generation. Conversely, the patterns whose attachment mode is under car navigation have negative impacts on the clusters relating to sporty and strength for those in their 20s but positive impacts for those in their 30s and 40s. On the contrary, the patterns whose attachment mode is integrated with car navigation have positive impacts on the cluster relating to sporty and strength in 20s but have negative impacts on it in 30s and 40s. It was revealed that there is a gap between 20s, 30s, and 40s in design elements and instances for strength and sporty. In 50s, we were unable to find a clear statistically significant impact on each requirement from each design elements and instances because most of the coefficients of determination are 0.5 or less. This also suggests that sensitivity to the design of a product is very different by individuals for those in their 50s.
Table 7a: Category scores and coefficients of determination given from the quantification method analysis of the data in the 20sTable 7b: Category scores and coefficients of determination given from the quantification method analysis of the data in the 30sTable 7c: Category scores and coefficients of determination given from the quantification method analysis of the data in the 40s
Table available in the original PDF paper.
Table 7d: Category scores and coefficients of determination given from the quantification method analysis of the data in the 50s
R
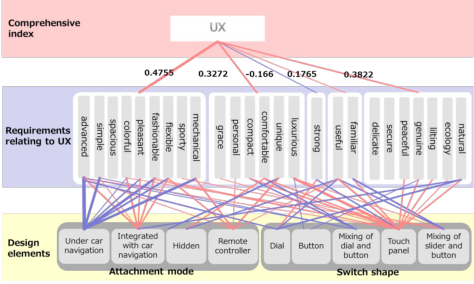
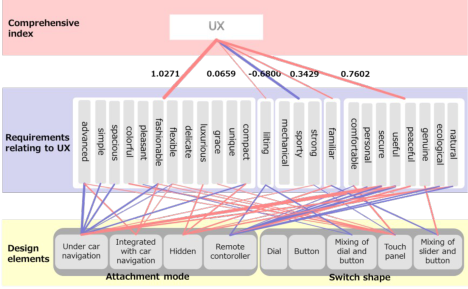
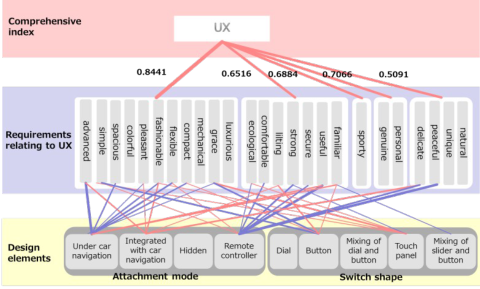
Models to Estimate UX from Design Elements and Instances We connected a two-step quantification process described above, that is, the process of quantifying the contribution to comprehensive satisfaction from requirements composing UX and the process of quantifying the impact on requirements composing UX from each design element and instance. Then, we constructed models that estimate how large UX could be for any combination of design elements and instances for each generation. Figures 8a–c show the model of estimation corresponding to the 20s, 30s, and 40s. We did not construct the model of estimation for 50s because the accuracy was less than any of the above for the process of quantification. In the figure, the impact on comprehensive satisfaction from requirements composing comprehensive satisfaction and the impact on requirements composing comprehensive satisfaction from each design elements and instance are represented by an effective line. The red lines represent a positive impact, while the blue lines represent a negative impact. Also, the magnitude of the impact is reflected in the width of the line. The requirements and impacts with a coefficient of determination given by quantification method of 0.5 or less are not described.
Figure 8a: Model to estimate the magnitude of UX from the combination of design elements and instances (20s)Figure 8b: Model to estimate the magnitude of UX from the combination of design elements and instances (30s)Figure 8c: Model to estimate the magnitude of UX from the combination of design elements and instances (40s) Examining of Models
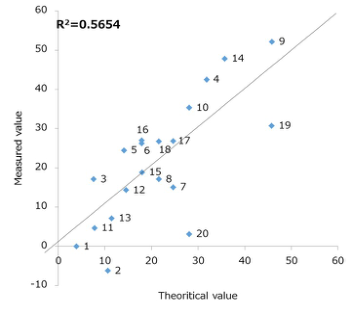
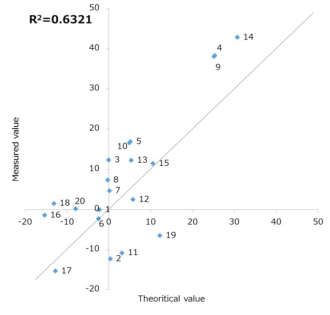
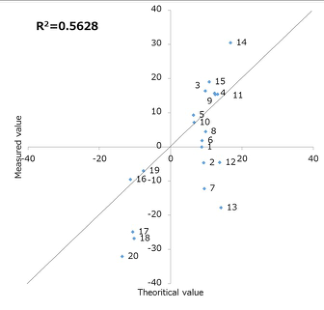
Models of the previous section make it possible to quantitatively estimate how large UX can be based on any combination of design elements and instances. The magnitude of UX calculated using the models of estimation (estimated value) and the score of comprehensive satisfaction given from subjects (measured value) for the 20 patterns of combinations of design elements and instances is shown in Table 2. Figures 9a–c show the results from examining the accuracy of estimation models corresponding to the 20s, 30s, and 40s. Because the coefficient of determination was 0.5 or more for any model of estimation, we were able to confirm with any model estimate the magnitude of UX with high accuracy. This means that we constructed models that can quantitatively estimate how large a UX value is produced by any combination of the attachment mode and switch shape for each generation. Also, we attempted to analyze based on the presence or absence of the license and gender, but we were unable to construct the model with high accuracy.
Figure 9a: Correlation of measured values given from subjective evaluation and theoretical value estimated by the model (20s)Figure 9b: Correlation of measured values given from subjective evaluation and theoretical value estimated by the model (30s)Figure 9c: Correlation of measured values given from subjective evaluation and theoretical value estimated by the model (40s) Applicability of the Model
The model constructed in this study has two potential applications when viewed from a practical standpoint. First, the models can be used in bottom-up analysis. For example, these models make it possible to estimate which idea produces a certain magnitude of UX for the target (generation) when people select ideas in the design process of a heater control switch. This suggests the possibility that the models can evaluate not only a fundamental point of usability, functionality, and performance but also whether the users themselves feel comprehensive in the selection phase of the idea of the design process. In addition, consensus among those involved in the project was promoted because we were able to evaluate subjective and abstract objects, i.e., users’ comprehensive satisfaction by quantitative index. This is expected to speed up the entire process of design. Second, the models can be used in top- down analysis. For example, if we want to devise a design of a heater control switch with a larger UX for a target (generation), we know the combination of design elements and instances to select for a base design. This leads to find the direction of an idea for design without detracting significantly from the users’ comprehensive satisfaction. It is also expected that the uncertainty of whether the final draft of a design will be acceptable to the users will be reduced. Providing a quantitative index to express superiority of a design idea that it is difficult to explain but the designer knows intuitively, in particular, superiority from the viewpoints of UX helps to focus on a truly superior design idea that may have been shelved, and it has the potential to realize a new design idea.
CONCLUSIONS
In this study, we constructed models of design quantitatively by estimating comprehensive satisfaction given from the combination of design elements and instances, that is, UX of the targeting center console mainly consisting of a heater control switch. The results were stratified by generation, and each model constructed from the data of 20s, 30s, and 40s can estimate the magnitude of UX with high accuracy. Also, we suggested the possibility of how we can use this model in the scene processing design.
In this study, for the construction of the models, we limited design elements and instances, but it is also possible to use an approach with a similar method by changing and adding them. Therefore, the models are extendible according to the needs of the scene designing process. It is expected to be effective to apply the methodology of the constructing model shown in this study. We want to develop a model of general product design through specific attempts in the future.
Today, in many mature products represented by the interface in a car, it is difficult to dramatically improve the users’ satisfaction in terms of usability, function, and performance. In this study, a model of users’ intrinsic satisfaction was formed and showed how balance gives a new perspective for the design process. It is expected to contribute to the creation of product design truly accepted by users.
REFERENCES
Apple User Experience Guidelines. Retrieved from http://developer.apple.com/library/mac/#documentation/userexperience/conceptual/applehiguidelines/UEGuidelines/ UEGuidelines.html (accessed 15.1.2013) ISO9241-11, Ergonomic requirements for office work with visual display terminals, Part 11: Guidance on Usability, 1998. Microsoft Windows User Experience Guidelines. Retrieved from http://msdn.microsoft.com/ja-jp/library/aa511258.aspx
(accessed 16.1.2013) Nakanishi, M. (2012). Strategic approach toward UX design based on the concept of PSF. Journal of Human Life Engineering, 13(1), 67–70. Watanabe, M. (2013). Exploration of mechanism of forming attachment to product and service: physio-psychological evaluation
of emotion with attachment. Graduation thesis in Keio University. Yuki, Y., & Nakanishi, M. (2012). An idea for service design to induce intrinsic motivation and experimental validation—a case of information providing service in museum. Journal of Japan Ergonomics Society, 48(5), 234–243.
LISTED IN THE AHFE DIGITAL BOOKSTORE CATALOGUE
Explore the complete digital volume
Advances in Ergonomics In Design, Usability & Special Populations: Part II
Read this individual research paper free through the original publisher, or explore the full digital proceedings book.
ISBN 978-1-4951-2107-4
Explore this ISBN in the AHFE Bookstore ↗Listed in the July 2026 bookstore catalogue; search by ISBN to confirm current availability · Digital book purchase optional