Pratap Kalenahalli Sudarshan, Michaela Kauer, Ralph Bruder (2022). A Comparative Study of Design Perceptions of Vehicle Cluster Instruments by Designers and Non-Designers in India and Germany. In: Advances in Ergonomics In Design, Usability & Special Populations: Part II. AHFE Open Access, vol. 19. https://doi.org/10.54941/ahfe1001231
Cultural differences in the perception of products can be studied by using the Repertory Grid Technique (RGT) where the idiosyncratic views of individuals are studied. This study examines the perceptions and prioritization of attributes with regard to six existing vehicle cluster instrument designs with thirteen designers each from India and Germany along with thirteen non-designers each from India and Germany (i.e., comparing German designers with Indian non-designers and Indian designers with German non-designers). The elicited constructs from interviews using RGT were categorized according to Hassenzhal’s (2004) Pragmatic and Hedonic qualities and their subcategories. The categorized data was compared along three metrics of Dominance, Importance and Descriptive Richness. Comparing designers and non-designers across cultures indicated differences in perceptions owing to the cultural background and education in design. For example, German designers emphasized the pragmatic aspects in comparison to Indian non-designers. Alternatively, Indian designers placed more importance to the Identification aspects (ex., exclusive, premium, sporty, etc) when compared to German non-designers. The design implications of these findings provide hints to designers on how to go about designing for Indian and German audiences.
Culture provides people a learned, shared and interrelated set of symbols, codes, and values that direct and justify human behavior (Harris and Moran 1987). Every culture has its own thoughts to buy or use a product; therefore, it is important to take into consideration the cultural aspects during design. If the design of a product does not match the users’ understanding and expectations then the interaction between the two will directly affect the success of the product. This aspect has attained special importance with the emergence of the global market place, where cross- cultural differences are becoming increasingly recognized as a key-factor in the successful adoption of new products (Lee and Harada, 2000). This is particularly important given that Product Design teams from one culture often have to design and develop products for users in another culture and environment.
In this study, we explore differences in the perceptions of vehicle cluster instrument designs between designers and non-designers in India and Germany. The cluster instrument panel is an area of high importance for the driver interaction with the vehicle as it contains the information about the state of the car. The vehicle instrument cluster is also an object in which Designers express the general look of the car, i.e. dynamic, sporty, sober, up-market (Herbeth and Blumenthal 2013). Here, we aim to study how designers and non-designers from India and Germany perceive and differentiate the different designs, and thereby attempt to understand the sets of product attributes they value.
Culture, in the design field has been approached through generic cross-domain constructs such as that of Hofstede’s (1984) cultural dimensions and Schwartz’s (1992) cultural values as shown in Marcus (2000), Oshlyansky et al. (2006), and Tong and Robertson (2008). As mentioned in Tomico et al. (2009), these approaches with cross-domain constructs typically involve gathering information about cultural differences through questionnaires or interviews using previously validated and standardized items. The drawbacks of using predetermined items include their general insensitivity to topics, thoughts, and feelings - in short, information - that do not fit into the predetermined structure (Hassenzahl and Wessler 2013). Another drawback of predetermined items approach is its tendency to produce data that is of low practical use in a design process. Carroll (1997), for example, argued that “formal experiments (a very structured approach with predetermined items) are fine for determining which of two designs is better on a set of a priori dimensions, but they are neither flexible nor rich enough to guide a process of continual redesign”. In addition, using a predetermined set of items for comparison, results in difficulties for the user to accurately understand and interpret the researcher’s terms leading to less than efficient insights from the exercise for redesign.
The Repertory Grid Technique (RGT) developed by George Kelly (1955) as an application of the theory of Personal Constructs as illustrated in Tomico et al (2009) presents itself as a viable alternative to study the cross- cultural differences. The RGT is a subjective approach to the exploration of culture in product design, where individuals’ perceptions of products is said to be a carrier of implicit cultural insight, and thus, cross-cultural differences can be explored within a specific context through existing products in the market. The Repertory Grid Technique itself has been widely applied in gathering information about consumer responses, and lately, it has become increasingly popular in the Design and HCI field (e.g., Hassenzahl and Wessler 2000; Tomico 2007; Herbeth and Blumenthal 2013, etc). The biggest advantage of the Repertory Grid Interview is that the information obtained is a hybrid qualitative-quantitative nature allowing for a wide kind of statistical analysis of data from different grids (i.e., individual participant grids) without losing the individuality of the results (Tomico et al 2009).
In this study, the RGT and the three measurements to determine differences in product attribute prioritization (dominance, importance and descriptive richness) as described in Tomico et al (2009) were used to analyze cross- cultural differences. Dominance illustrates product attributes that were most frequently observed and elicited by the participants. Importance illustrates the attributes the participants found to be most important in the cluster instrument designs. Finally, Descriptive richness shows the different ways a particular product quality was elicited by the participants. The above-mentioned metrics for analysis, the RGT as used in this study, the results and their interpretation are described in the following sections of this paper.
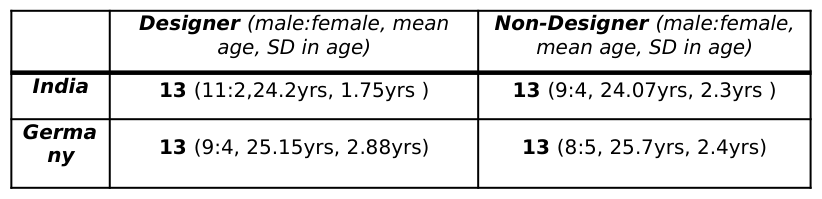
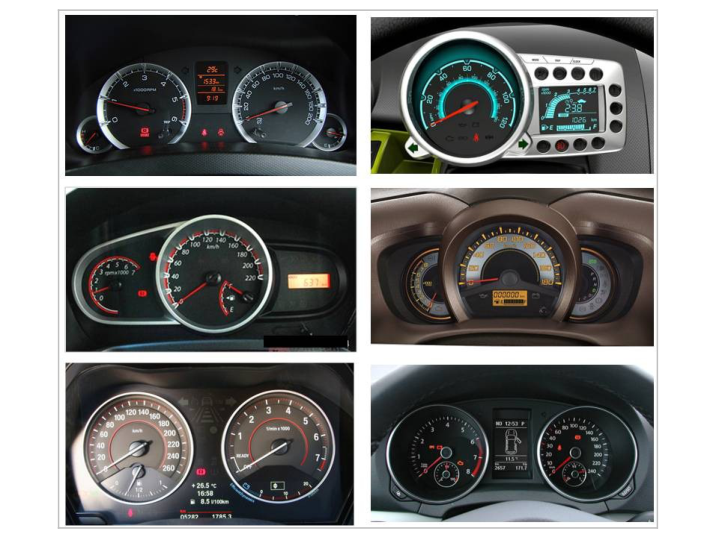
EXPERIMENTAL SETUP AND METHODOLOGY Thirteen designers and non-designers each from India and similarly thirteen designers and non-designers each from Germany evaluated six cluster instrument designs as shown in figure1. Table 1 below provides more details of the participants of this study where the age of the participants varied between 22 to 32 years.
Table 1. Participants in the study Designer (male:female, mean
All users involved in this study were graduate students having at least 2 years of experience in driving a car. Six vehicle instrument designs representing the ‘hatchback segment’ (also known as Segment B in India and ‘kleinwagen’ in Germany) were selected for this study. The two popular vehicle models in 2012 in the ‘hatchback’ segment in India and the two popular vehicle models in the chosen segment in Germany in 2012 were chosen for this study. Additionally, two ‘unique’ designs from the segment from the two countries were selected as stimulus for this study (Figure 1). The selection was based on having as many unique and different designs as possible for the stimulus.
Figure 1. The six cluster instrument designs selected as stimulus for this study1. Left to Right - Suzuki Swift (India), Chevrolet Beat (Unique), Ford Figo (India), Honda Brio (Unique), BMW 1er (Germany) and
VW Golf (Germany).
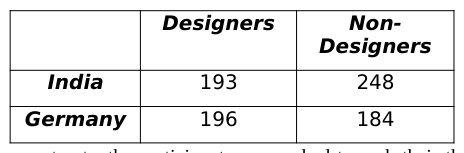
The structured interview using RGT involves triading where the participant is presented with the stimuli in sets of three. In this study, the six product images (figure 1.) were first combined in randomly selected triads. The order in which the triads were presented to the participant ensured that no two images were repeated from the previous set. For every triad of images presented, participants were asked to “think of any one feature or quality of the product (image) that differentiates one from the other two products (images) presented.” From the elicitation, a laddering approach (Easterby-Smith 1980) was then used to get to the core of the answer. The preferred pole from the pair of constructs elicited was considered as a construct with the opposing pole being considered as the contrast. The procedure was repeated until no new attributes arose for two consecutive triads. The bipolar constructs that appear for a specific individual for this specific set of products is a Repertory Grid. Each Repertory Grid is personal and varies for each participant in topic and number of constructs elicited. Each participant’s Repertory Grid is his or her personal semantic differential questionnaire and can be used to rate the products (Tomico et al 2009). Table 2 shows the total number of constructs elicited by each of the groups under study. A minimum of 12 and a maximum of 20 constructs were elicited by the participants.
Table 2. Total number of constructs elicited by the participants Designers Non- Designers
After the elicitation of the constructs, the participants were asked to rank their three most important and three least important of the elicited constructs that they would consider for the design of new cluster instrument. The 1 Image sources: A. http://www.oncars.in/maruti-suzuki/swift/photos B. http://fonewala.wordpress.com/category/car/page/3/ C. http://www.carwale.com/ford-cars/figo/photos/3174.html D. https://www.hondacarindia.com/about/download.aspx E. http://www.autozeitung.de/auto-vergleichstest/mercedes-a-klasse-2012-vergleich-audi-a3-bmw-1er-118i-200 F. http://www.caranddriver.com/photos-09q1/267806/2009-volkswagen-golf-instrument-cluster-european-model-photo-267843 participants then rated each of the products according to their personal attributes/constructs using a scale similar to a semantic differential scale. Figure 2 shows a sample of the results for one participant. Finally, the participants were asked rank to the products based on their preference along with a short reasoning for their ranking.
The interviews with the German participants were conducted in German with the results being translated in English for analysis while the interviews with the Indian participants were conducted in English. Two native German speakers having excellent command of English helped in the translation from German to English.
Figure 2. A sample of the results obtained from one of the participants As mentioned in Tomico et al (2009) each participant in the study generates his/her own Repertory Grid, comparisons between different participants is difficult. In order to overcome the idiosyncratic nature of the results and to create a standardized classification scheme, content analysis was applied (Krippendorff 2004). As described in the conventional content analysis approach of Hsieh and Shannon (2005), the classification schemes were derived directly from the raw data, i.e., the personal constructs. A detailed coding scheme emerged from the data as shown in Table 3. The elicited categories were then grouped into the overall categories that reflected Hassenzahl’s (2004) distinction between pragmatic and hedonic product qualities. Pragmatic qualities refer to the instrumental aspects of a product, such as its usefulness, practicality and ease of use. Hedonic aspects relate to the more experiential aspects of product use and consist of two distinct categories i.e., Stimulation, which refers to a product’s ability to address the human need for novelty and challenge, and Identification, which refers to a product’s ability to address the need for expressing oneself through the objects one owns. This classification was done by two independent raters on random sets of data and achieved an interrater agreement (Fleiss, Levin, and Paik 2003) of k = 0.806 which is deemed to be satisfactory.
Figure available in the original PDF paper.
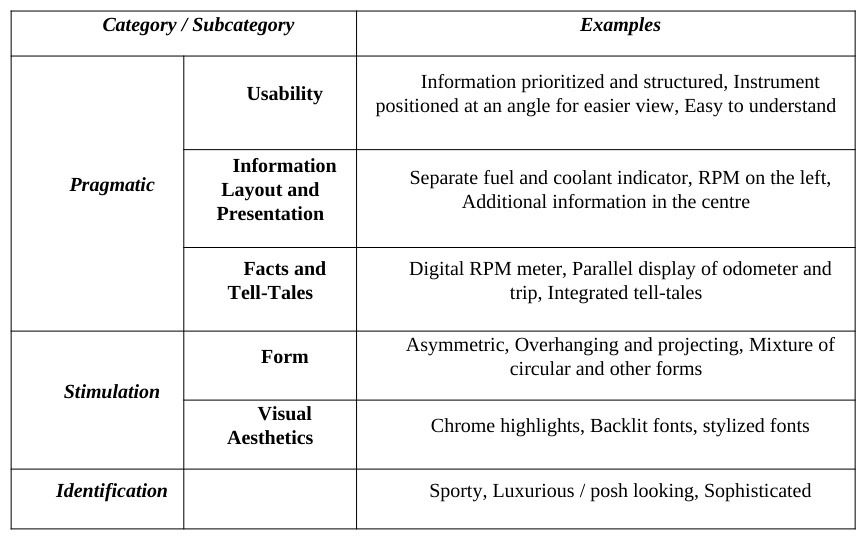
Table 3 illustrates the detailed coding scheme together with the breakdown into thematic categories (pragmatic and hedonic), the defining aspects of these categories, and examples of the personal constructs elicited. As evident in the table, the pragmatic aspects were related to usability, information layout and presentation and facts of the products/ tell tales. All constructs under the pragmatic aspects related to factual aspects and those that described the usefulness and usability of the cluster instruments. Under the hedonic aspects of the cluster instruments, stimulation was found to be induced by two distinct aspects of the instruments. Firstly, ‘form’- constructs associated with the overall, physical, three-dimensional form of the cluster instrument, which creates a sense of novelty / challenge to the user. Secondly, ‘visual aesthetics’ (aesthetics hereafter) - constructs related to aspects of the product, which go beyond form and usability i.e., color, color contrasts, highlights, etc. Finally, the constructs relating to identification dealt with the self-image that the cluster instrument might potentially communicate about its owner. This hierarchical classification of the users’ personal constructs enables a decomposition of their perceptual space into semantically distinct and culture-independent dimensions.
Table 3. The elicited constructs classified into thematic categories with examples from participants Category / Subcategory Examples
MEASURES FOR ANALYSIS The first criterion, dominance, is the relative percentage for a given category/subcategory of constructs displays for a group of individuals when they are differentiating among a set of products. If, for example, one group of participants, elicits constructs such as ‘easy to read, complex visualization, information prioritized, etc’ belonging to the category ‘usability’ significantly more frequently than a second group of participants. Then, one could conclude that the usability aspects were more dominant for the first group than that for the second group.
The second criterion, importance, is the importance of a personal construct category for a specific group. The difference between the dominance and importance measures lies in that - dominance is a measure of how often constructs of a category are elicited while importance refers to the category of constructs that a particular group of participants find important to purchase and use the product. The weighted average method is used to calculate importance. For example, category ‘usability’ might dominate for a group of participants but the other group of participants might find it more important than the former group. Therefore, dominance does not necessarily mean importance.
A third criterion descriptive richness is used to determine the reach of each category. It is defined as the range of different personal constructs (attributes) elicited within the same category. The different ways in which participants refer to the same categories relate to how the personal constructs elicited are related to each other and how big the clusters of constructs are. For instance, a construct category such as “novelty” might have a single facet relating to the novelty and innovativeness of a product, while a different construct, such as “ease-of-use,” might tap to more than one facet, for example understandability, clarity and navigability (Tomico et al 2009).
Therefore, cross-cultural differences between the German and Indian participants’ perceptions in this study were explored through the calculation of a) the relative percentage (dominance), b) weighted average (importance) and c) the descriptive richness of each construct category for each cultural group.
RESULTS
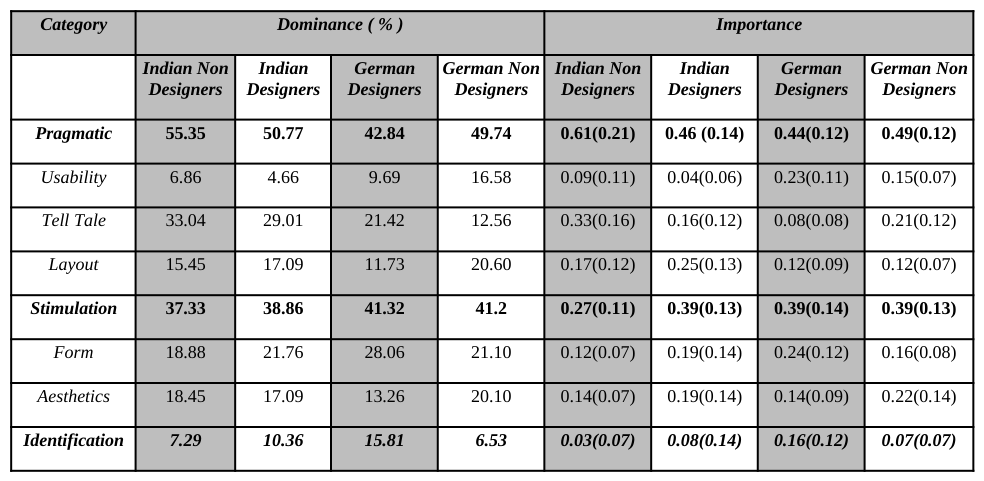
Dominance and Importance Measures The Dominance measures were calculated by the relative percentage of responses (constructs) in each category with respect to the total number of responses in all categories. For example, for the Indian group of non-designers 17 constructs were classified under the ‘usability’ category. Therefore, relative percentage of the ‘usability’ category among the 248 elicited constructs is 6.86%.
Importance measures were calculated using the weighted average method. The weighted average method was particularly chosen despite previous studies (Tomico et al 2009; Tomico 2007; Feixas and Cornejo-Alvarez 2002) using the elicitation order as a measure of importance. This was done because when the participants were asked to rank their most important and least important of the elicited constructs, it was found that the constructs elicited at the beginning (i.e., elicitation order) were not always the ones considered the most important by the participants.
The steps followed for the calculation are as follows.
1. Categorize constructs from the individual participant grids into ‘pragmatic, stimulation, identification’ and their subcategories.
2. Rank the responses in numeric order as obtained from the participants’ ranking of his/her most important and least important of the elicited constructs.
3. Compute the summation of ranks of each category and sub category.
4. Divide the result of step 3 by the total rank summation.
5. The arithmetic mean of the respective categories across all participants’ individual grids would give the measure of importance.
Table 4 shows the values for dominance and importance with standard deviations mentioned in parenthesis.
Table 4. Dominance and Importance Measures for Indian and German Designers and Non-Designers Category Dominance ( % ) Importance
Descriptive Richness
Descriptive Richness was calculated as described in Tomico, et al (2009). Subtle differences in the individual constructs were considered of increased importance here. In assessing the semantic similarities between constructs, two kinds of information were taken into account. First, qualitative information such as the definition of each pole for the constructs elicited. Secondly, every construct was characterized by the participants’ ratings for the set of stimuli. Quantitative techniques such as Hierarchical Cluster Analysis provided information related to the cognitive similarity of the constructs (i.e., how similarly two constructs were being used in differentiating the items in the set of products). This was an iterative procedure in which both qualitative and quantitative information was used to inform the grouping process.
The hierarchical cluster analysis augmented qualitative understanding by highlighting: a) constructs that displayed a high correlation in the ratings, but for which there was no a-priori identified semantic similarity (from the content analysis), and b) the cognitive dissimilarity of two constructs that displayed high semantic similarity. In this sense, for two constructs to be judged as similar, they not only had to agree with regard to semantic information, but also with regard to participants’ ratings for the set of products. This process was found to provide a rich qualitative understanding of non-contiguous constructs, in which the opposite pole doesn’t constitute a negation or a linguistic opposition (Karapanos and Martens 2007 from Tomico et al 2009).
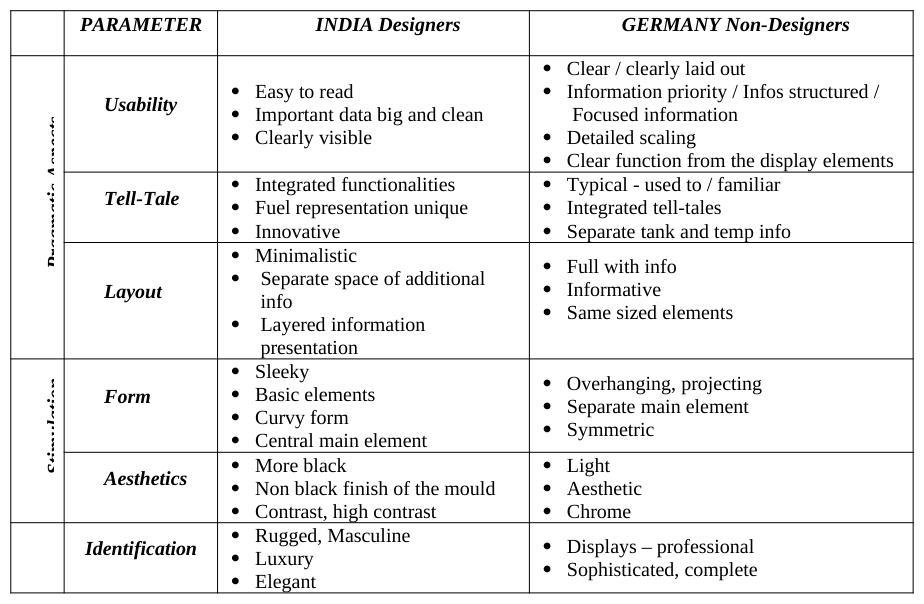
Table 5 shows a sample of the descriptive richness of the different thematic categories for Indian designers and German non-designers. It shows the diverse ways in which German and Indian participants referred to the pragmatic and hedonic (stimulation and identification) qualities of the cluster instruments.
Table 5. A sample of descriptive richness of the different thematic categories PARAMETER INDIA Designers GERMANY Non-Designers
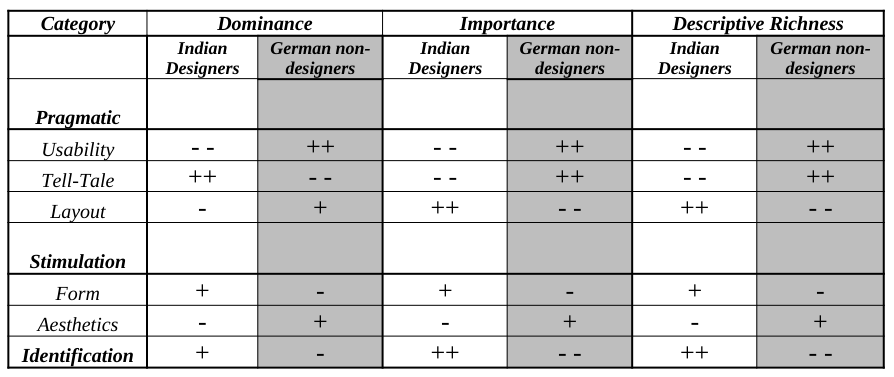
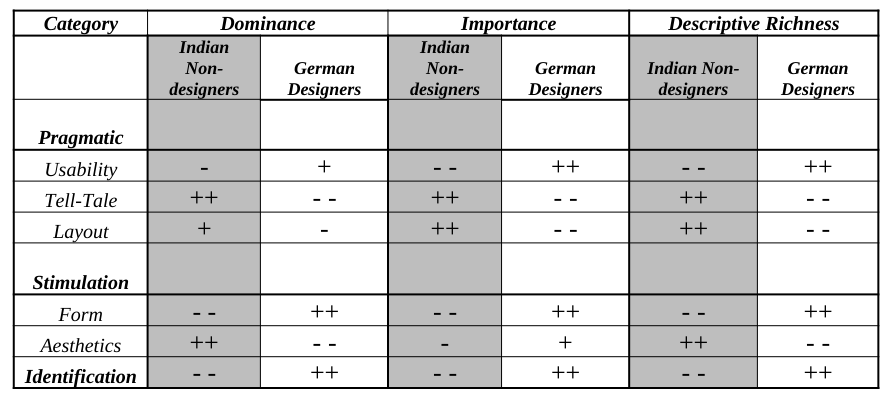
The general overview of the results obtained from the three calculated indices is as shown in table 6 and table 7. Small differences are shown by single plus or minus where as larger significant differences are shown with a double plus or minus. The descriptive richness is related to the other two indices, thus adding redundancy to the analysis (Tomico et al 2009). The methodology followed to assign strong (++) and weak (+) associations in tables 6 and 7 below is as follows
1. Dominance: Any difference greater than or equal to 5% has been considered as sufficient to show a significant difference. For example, from table 4 Dominance of Tell-Tale for Indian designers is about 29.01% and is 12.56% for the German non-designers, so Tell-Tale is assigned a ‘++’ for the Indian Designers with a ‘- -’for the
German non-designers.
2. Importance: Any difference equal to or greater than 0.05 has been considered as sufficient to show a significant difference. Here, the lower (LCL) and upper control limits (UCL) are calculated and the difference of at least one control limit must satisfy the said condition. For example, from table 4 Layout for Indian designers is 0.25(0.13) and for the German non-designer is 0.12(0.07). UCL and LCL for Indians are 0.38 and 0.12 respectively. The same for Germans are 0.19 and 0.05 respectively. The difference of both control limits satisfies the condition, hence Tell tales have been assigned a ‘++’ for the Indian Designers.
Table 6. Overview of dominance, importance and descriptive richness measures for Indian designers and German non-designersTable 7. Overview of dominance, importance and descriptive richness measures for Indian nondesigners and German designers
INTERPRETATION OF THE RESULTS AND DISCUSSION Comparing Designers in India and Non-designers in Germany (table 6.); it is observed that ‘usability’ was more dominant and important to the German non-designers than for the Indian designers. This can be attributed to the pragmatic nature of the Germans where “ordnung” (orderliness in German) is an extremely important aspect of everyday life in Germany. A second reason for the high importance to ‘usability’ is the functional importance of the cluster instrument in the car. These points are emphasized with the Descriptive Richness where German non- designers used terms such as “Information structured, clear function of display elements, etc”. Formal design education has sensitized the Indian designers to the ‘layout’ aspect, which is seen as being an important aspect in the design of vehicle cluster instruments therefore, the significantly higher importance in comparison to German non- designers.
The significant dominance by Indian designers in the ‘tell tale’ subcategory was mainly due to the fact that many features and elements or their representation shown in the cluster instruments were considered non-standard in Indian vehicles and therefore mentioned more often (dominance). Further, when looking at the Importance scores where the tell tales is seen to be more important for the German non-designers than Indian designers. This suggests that German non-designers place higher importance to having all the elements they consider as standard offerings being present in the cluster instrument panel. This aspect is further emphasized by looking at the Descriptive Richness data where Germans used terms like “used to/familiar, integrated tell tales, etc” whereas the Indian designers used terms such as “Innovative, Unique fuel representation, etc”.
The dominance and significantly higher importance shown by Indian designers for ‘Identification’ is primarily due the education background of the designers. Design students are consciously trained in design schools to express their designs through various expressions and emotions such as Elegant, Luxury, Rugged, etc (‘Identification’). However, the interdisciplinary background of the Indian designers (i.e., typically a Bachelors in Engineering and then a Masters in Design) probably justifies for the counter intuitive dominance and importance in the ‘form’ and ‘aesthetics’ sub-categories which is further reflected in the descriptive richness of the ‘Form’ and ‘Aesthetics’ subcategories shown in table 5.
Comparing Designers in Germany and Non-designers in India (table 7.) the dominance and importance to ‘tell tale’ as mentioned earlier is observed again. However, the Indian non-designers also considered tell tales as more important compared to German designers. Referring to the qualitative feedback during the interviews is was seen that the Indian non-designers considered something non-standard and unique as important therefore a ‘must have’ in their cluster instrument panel. As mentioned in the previous comparison Germans (German designers in this case) placed more importance on ‘usability’ aspects of the cluster instrument. An interesting aspect is the dominance and importance shown by the Indian non-designers for ‘layout’ in comparison to the German designers. Although there is no concrete reasoning, one can only speculate based on qualitative feedback that, the German designers considered that good usability would automatically mean a good layout of elements therefore more importance and dominance for ‘usability’ and less on ‘layout’.
The counter intuitive dominance scores for ‘form’ and ‘aesthetics’ between Indian non-designers and German designers can be attributed design education of the German designers who can appreciate aspects of form where as the Indian non-designers focused on the ‘aesthetics’ aspects a lot more. This can be derived from descriptive richness where for ‘form’ the terms used by German designers were ‘symmetric, traditional, boxy, geometric, etc’ whereas the Indian non-designers used terms such as ‘projected display, two different units, etc’. Similarly with aesthetics , German designers used terms such as ‘accents, brushed metal, matte, etc’ whereas Indian non-designers used terms such as ‘chrome, silver, multi colored, neon colors, red needle, etc’. In summary, one can say that the German designer focuses on the ‘form’ where as the Indian non-designers focus on the ‘aesthetics’. One sees these differences also in general design of a German product where the color treatment and finish tends to be sober and conservative in comparison to the design of an Indian products which tend to be louder and more extravagant in terms of the color treatment.
The comparison with the ‘identification’ category is similar to the previous comparison. Here too the German designers due to their education show more dominance and importance to the ‘identification’ aspects. A comparison of the descriptive richness scores further emphasizes this point. The India non-designers used terms such as ‘expensive, modern, imported, etc’ where as the German designers used terms such as ‘sporty, premium, classic, elegant, etc’.
In both the comparisons carried out, it was found that the category of ‘Stimulation’ is comprising of the subcategories of ‘form’ and ‘aesthetics’ showed no clear trend. However, going by the ratings and ranking of the designs one is able to make the following general statements in comparison between Indians and Germans. The Germans in general were very critical of the form and aesthetic aspects of the ‘unconventional designs’ shown. Therefore, they placed more importance on having ‘conservative’, ‘familiar’, ‘traditional’ forms, and ‘traditional’ and ‘sober’ color combinations (aesthetics) with respect to cluster instrument designs. On the other hand, Indians rated the ‘unconventional’ designs higher than Germans in addition to rating the color and color combinations in the ‘unique’ designs higher than the German participants.
CONCLUSIONS
This study explored the cross-cultural differences between thirteen designers and thirteen non-designers each from India and Germany in terms of their perceptions of a set of vehicle cluster instrument designs using the Repertory Grid Technique. The constructs elicited by the participants were categorized and compared along three metrics of dominance, importance and descriptive richness. Comparing designers and non-designers across cultures indicated differences in perceptions owing to the cultural background and education in design. For example, German designers emphasized the pragmatic aspects in comparison to Indian non-designers. This fact is due to both the formal design education as well as general German culture where pragmatic attribute such as usability and orderliness play an important role in everyday life and the fact that the product (cluster instrument) itself is seen as a more functional product. Alternatively, both Indian and German designers placed more importance to the Identification aspects (ex., exclusive, premium, sporty, etc) when compared to the non-designers. This is attributed to the design education of the designers where they are consciously taught to express their designs through the Identification aspects.
Overall, comparing Indians (designers and non-designers) and Germans (designers and non-designers) as a whole one could draw the following conclusions. For Indians, something non-standard / unique was dominant and considered important by non-designers. From the scores and ranking of the cluster instruments used in the study one can conclude that Indians in general were more open to new forms, color and color combinations. For the Germans, the usability of the cluster instrument panel is of high importance. In terms of preferences, the Germans are more conservative and sober in terms of form and color treatment of the cluster instruments in comparison to the Indians.
The design implications of such findings would indicate how the designer could go about designing for Indian and German audiences. For example, when designing cluster instruments for the Indian audience, the German designer could look to express designs more through color and color combinations to communicate the Hedonic and Identification aspects rather than through ‘form’ and relatively neutral and subtle colors as done for the German audience. Such studies are of importance for a designer, as s/he would then know how s/he is different from the target user and therefore consciously make efforts to design in accordance to the target user perceptions.
As a future scope to such a study, it is intended to carry out a similar study comparing only Designers across cultures to examine if formal design education neutralizes the effects of culture in design and perception of attributes.
REFERENCES
Carroll, J.M. 1997. Human–computer interaction: Psychology as a science of design. International Journal of Human–Computer Studies 46:501–522 Easterby-Smith, M. 1980. The design, analysis and interpretation of repertory grids. International Journal of Man-
Machine Studies, 13: 3 – 24 Feixas, G.,and Cornejo-Alvarez, J. M. 2002. A manual for the repertory grid: Using the GRIDCOR programme (version 4.0). Retrieved July 28, 2013. From http://www.terapiacognitiva.net/record/pag/index.htm Fleiss, J. L., Levin, B., and Paik, M. C. 2003. Statistical methods for rates and proportions. Hoboken, NJ: Wiley-
Interscience. Harris and Moran. 1987 as noted in http://infosceincetoday.org/type/research-type/cross-cultural-issues-in-the-21stcentury-marketing.htm, retrieved 25 July, 2013. Hassenzahl, M. 2004. The interplay of beauty, goodness, and usability in interactive products. Human-Computer
Interaction, 19(4):319-349. Hassenzahl, M., and Wessler, R. 2000. Capturing design space from a user perspective: The repertory grid technique revisited. International Journal of Human-Computer Interaction, 12(3 & 4):441-459. Herbeth, N., and Blumenthal, D. 2013. Product appraisal dimensions impact emotional responses and visual
acceptability of instrument panels. Food and Quality and Preferences. Elsevier. 29:53-64. Hofstede, G. 1984. Culture’s consequences: International differences in work-related values. Newbury Park, CA: Sage.
Hsieh, H. F., and Shannon, S. E. 2005. Three approaches to qualitative content analysis. Qualitative Health Research, 15(9):1277-1288. Kelly, G. 1955. The psychology of personal constructs (Vol. 1-2). London: Routledge. Krippendorff, K. 2004. Content analysis: An introduction to its methodology. Thousand Oaks, CA: Sage. Lee, K. P., and Harada, A. 2000. Cultural effects on subjective preference-cross cultural study between Korean and
Japanese. Kansei Engineering International. Springer -Verlag Berlin Heidelberg.1(2):51-60 Marcus, A. 2000. Cultural dimensions and global web user interface design: What? So what? Now what? Retrieved July 20, 2013. From http://www.amanda.com/resources/hfweb2000/AMA_CultDim.pdf Oshlyansky, L., Cairns, P., and Thimbleby, H. 2006. A cautionary tale: Hofstede’s VSM revisited. In Proceedings of
the 20th BCS HCI Group Conference (Vol.2). London: British HCI Group. pp. 11-15 Schwartz, S. 1992. Universals in the content and structure of values: Theoretical advances and empirical tests in 20 countries. Advances in Experimental Social Psychology. 25:1-65. Tomico, O. 2007. Subjective experience information gathering and inspiring techniques in interaction design.
Unpublished doctoral dissertation, Technical University of Catalonia (UPC), Barcelona, Spain. Tomico, O., Karapanos, E., Lévy, P., Mizutani, N., and Yamanaka, T. 2009. The repertory grid technique as a method for the study of cultural differences. International Journal of Design. 3(3):55-63. Tong. M. C., and Robertson, K. 2008. Political and cultural representation in Malaysian websites. International
Journal of Design. 2(2): 67-79.
LISTED IN THE AHFE DIGITAL BOOKSTORE CATALOGUE
Explore the complete digital volume
Advances in Ergonomics In Design, Usability & Special Populations: Part II
Read this individual research paper free through the original publisher, or explore the full digital proceedings book.
ISBN 978-1-4951-2107-4
Explore this ISBN in the AHFE Bookstore ↗Listed in the July 2026 bookstore catalogue; search by ISBN to confirm current availability · Digital book purchase optional