Saromporn Charoenpit, Michiko Ohkura (2020). A New E-learning System focusing on Emotional Aspects using Eye Tracking. In: Advances in Science, Technology, Higher Education and Society in the Conceptual Age: STHESCA. AHFE Open Access, vol. 10. https://doi.org/10.54941/ahfe100397
For e learning, we must create effective interaction between e-learning content and learners. In particular, increasing learner motivation by stimulating their interest is crucial. Eye tracking devices measure eye positions and eye movement. To date, few e-learning systems have derived emotions from eye tracking data. In this study, we explore which eye tracking indexes are related to learner emotions. We designed and implemented a prototype and evaluated it experimentally.
E-learning is an innovative technology that provides a strategy to improve the quality of teaching and learning. In e- learning systems, emotions are critical for learners to create positive emotions for optimal learning because they are important psychological conditions that reflect several human states, such as pleasant or unpleasant feelings, human relations, processes, and action results. Emotions are present in all mental processes and any human activity that is accompanied by emotional experiences (Antonio, 2011). In e-learning, we must create more effective interaction between e-learning content and learners, especially increasing learner motivation by stimulating their interests.
Eye tracking technology measures eye movements in a specific visual environment (Duchowski, 2007). Eye movements indicate learner interest and the focus of their attention. To date, few e-learning systems have derived emotions from eye tracking data, including fixation, pupil diameter, blink rate, and saccades. In this paper, we design a new e-learning system that detects learner emotions using eye tracking and focuses on fixation indexes from eye tracking data. We analyzed fixation plots, heat map data to identify the specific targets of learner visual attention to different parts of the interface, and the areas of interest (AOI) index related to learner emotions.
RELATED WORK
Hend et al. argued that the data collected from eye tracking devices indicate the person’s interest level and the focus of her attention (Hend, 2010). From eye position tracking and such indirect measures as fixation numbers and duration, gaze position, and blink rate, information can be drawn about the user’s level of attention, stress, relaxation, problem solving, learning success, and fatigue.
Ismail and Mohamed integrated eye tracking technology to track and analyze learner behaviors on an e-learning platform (Ismail, 2011). They focused on the interesting areas of courses that reflect user emotion attention, stress, relaxation, problem solving, and fatigue.
Areej et al. measured and recorded the eye gaze of participants as they interacted with an e-learning module and examined their comprehension and their individual learning styles (Areej, 2010). They derived four scales from significant bodies of knowledge: active/reflective, sensing/intuitive, visual/verbal, and sequential/global. From their results visual learners exhibited increased visual attention on multimedia elements, while higher verbal learners exhibited more attention on textual content.
Marco et al. addressed the problems of students on eye tracker’s screens and their eye data while solving problems that were recorded under such real-time conditions as gaze coordinates, fixation durations, and pupil diameters, from which they subsequently obtained indirect but important measures, such as saccadic velocities and blink rates (Marco, 2012). If a learner decreases the number of blinks, the increase of the fixation or pupil size is related to learners with high working levels or without understanding of the content.
Mealha et al. summarized data representation and information visualization techniques for data analysis within different contexts (advertising, websites, television news, and video games) (Mealha, 2012). They used common eye tracking related data representation techniques that offer valuable input about user interaction and eye gaze behavior by measuring fixations and saccades.
From our literature review, insufficient research has been focused on user emotions compared with research that focuses on learner emotions in e-learning. A few e-learning systems have derived emotions from eye tracking data. We designed a new e-learning system that explores which eye tracking indexes are related to learner emotions. Our system will help learners deal with negative emotions, maintain their attention, and enhance their learning motivation.
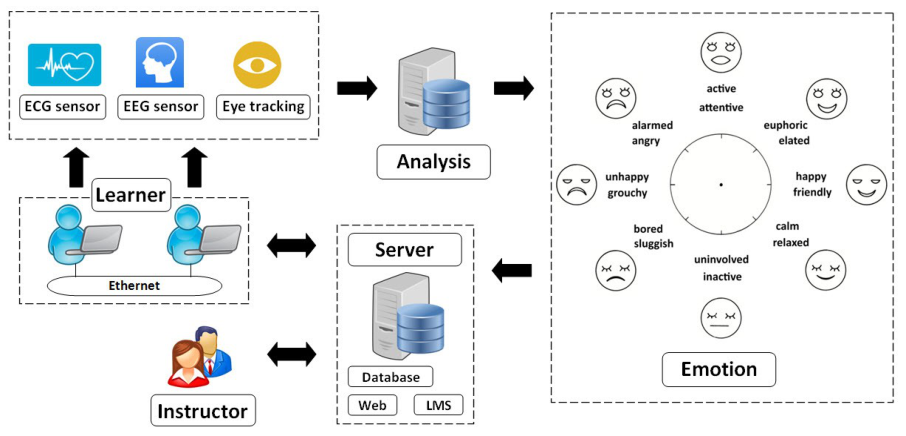
DESIGN OF OUR E-LEARNING SYSTEM Our current system, which is based on our previously designed e-learning scheme (Charoenpit, 2013), consists of the following five modules (Figure 1):
1. Learners: they register for e-learning through e-learning systems and can choose any of the courses provided by learning management systems (LMS). 2. Instructors: these critical elements of this system create and design courses, content, tests, quizzes, and evaluations in the LMS. 3. Servers are the web, database, and LMS.
a) The web server dispenses web pages when they are requested from the LMS. b) The database server provides such services to the LMS. c) An LMS is a web-based technology that plans, implements, and assesses a specific learning process. Typically, it provides an instructor with a way to create and deliver content, monitor student participation, and assess performance. 4. Biological sensors are electrocardiography (ECG) and electroencephalography (EEG) sensors and eye tracking for measuring learner emotions. An EEG sensor measures the voltage fluctuations from the Technology, Higher Education and Society (2020) electric ions within the brain’s neurons. An ECG sensor measures the heart’s electrical activity over a particular period. ECG signals can be interpreted as the heart rate in beats per minute (BMP). Eye tracking devices measure eye positions and eye movements. 5. Analysis of learner emotions: From the questionnaire results related to learner emotions, we analyzed the relation between learner emotions and eye tracking indexes. The target emotions in this article are boredom and interest.
Figure 1. E-learning system design (Charoenpit, 2013)
EXPERIMENT Experimental Method
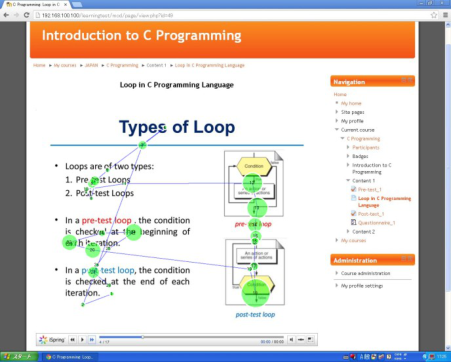
We built a prototype of our e-learning system, which consists of a series of contents, pre-tests, post-tests, and questionnaires, for the Introduction of C programming. Eye tracking equipment recorded the eye movements of the learners and calculated a fixation index. Emotion detection by eye tracking is related to two emotions: interest and boredom. We applied fixation as an index that is related to learner emotions. The following is a description of fixation: Fixation displays an individual’s eye movement sequence and its order. Circles represent the fixations, which are the places where the eye movements briefly stopped. The variation in the circle size indicates different fixation times: the larger the circle, the longer the fixation. The lines that connect the circles represent saccadic movements (Mealha, 2012). From the fixation index, we analyze and display two bits of data with AOI: fixation plots and heat maps:
Fixation plots with AOI - We used AOI to get user visual attention to different parts of the interface from the fixation data (Mark, 2005).
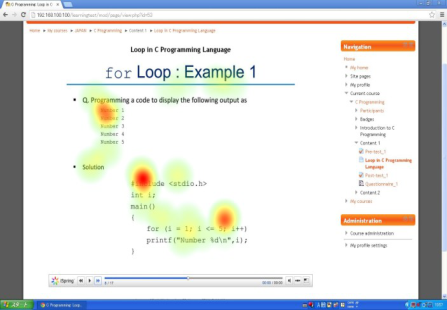
Heat maps with AOI - Heat maps represent the fixation locations and durations. We used colors to codify maps. A color scale moving from cool to hot colors indicates the fixation durations. Cooler colors represent a low visualization count; hot and warmer colors represent a higher visualization count (Mealha, 2012).
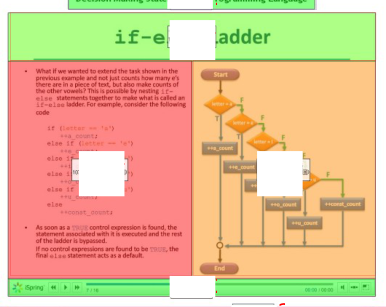
Figure 3. Interface design for style B Figure 2. Interface design for style A We used EyeTech and Quick Glance hardware version 5.0 to record the eye movements of our participants. The device has a sampling rate of 50 Hz.
Figure available in the original PDF paper.
The content is the Introduction of C programming and consists of the following two parts:
1) Content 1: loops in C programming language 2) Content 2: decision making statements in C programming language We designed contents 1 and 2 using power point (PPT). Each bit of content consists of 17 pages.
The details of styles A and B are shown below:
1) PPT slides in style A are only designed using texts (Figure 2). 2) PPT slides in style B are designed using both texts and pictures (Figure 3).
We prepared two patterns (Table 1) whose details are described below:
Pattern I: The learners learned content 1 in style A and content 2 in style B.
Pattern II: The learners learned content 1 in style B and content 2 in style A.
Table 1: Content patterns Content Pattern I Pattern II
2 Style B Style A
The procedures are described as below:
1. The learner eye positions should be calibrated. 2. The learners register when they first log onto the e-learning system. Next, personalized e-learning starts. 3. They take pre-test 1. 4. They learn content 1 in style A or B. 5. They take post-test 1. 6. They answer the first questionnaire. 7. They take a 5-minute break. 8. They take pre-test 2. 9. They learn content 2 in style B or A. 10. They take post-test 2. 11. They answer the second questionnaire.
We measured the eye movements and other data by eye tracking equipment while they were learning.
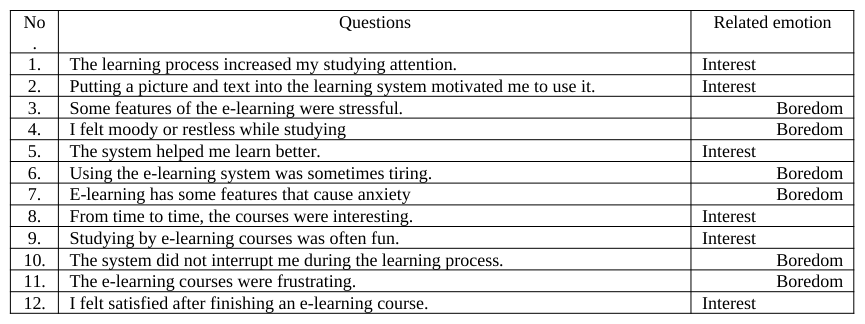
Our questionnaires asked 12 questions related to learner emotions in e-learning systems (Table 2). Learners answered on a 5-point Likert scale where five is the highest score (strongly agree) and one is the lowest score (strongly disagree).
A pre-test is a set of questions given to learners before learning begins. After completing the content, they are given a post-test to answer the same set of questions, and we changed the order of the choices from the pre-test. Examples of the pre-test questions for content 1 are shown in Figure 4. Since both tests consist of ten questions, each question has one point, and the highest score is ten.
Table 2: Questionnaire items on 5-point Likert scale.Figure 4: Example of pre-test questions for content 1
Figure available in the original PDF paper.
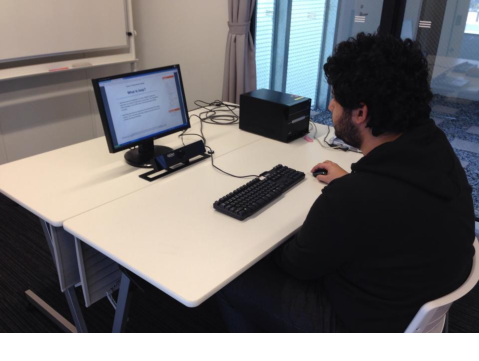
Experimental Results and Discussion We conducted our experiments by dividing eight Brazilian students into two groups for patterns I and II. Figure 5 shows scenes of the experiment.
Figure 5. Experiment scenes
Table 3 shows the learner attention distributions of two main AOI areas in contents 1 and 2. The AOI screen was divided into two areas (Figure 6). The following are the details:
1. The learning areas consisted of the following three areas: 1(a).Text area, 1(b).Picture area (pic.), and 1(c).Topic area. 2. The out of learning areas consist of five areas: 2(a).Button area, 2(b).Navigation area (Nav.), 2(c).Taskbar area (Bar.), 2(d).Top area, and 2(e).Out of areas (OA.).
The “cannot detect eye” column means that the eye tracking equipment cannot detect the eye position of learners.
Table 3: AOI within content and style results
Table available in the original PDF paper.
Content Style Ratio AOI Cannot Total Technology, Higher Education and Society (2020)
2 (d). 2 (d).
2
Figure 6. AOI interface
Figure available in the original PDF paper.
From Table 3, we found the following:
The average percentages of the learning areas are between 60 to 70 %. Spending more time on this area probably indicates learner interest.
The average percentages of the “cannot detect eye” area are between 30 to 40%. Since the learners often looked away from the screen, blinked, or closed their eyes for a long time, the eye tracking system cloud not detect eye movements, suggesting boredom. However, we need more experiments to relate these results to their emotions.
Table 4 contains both the questionnaire results and the test scores. Figures 7-8 show two examples of how learners explored the e-learning interface with fixation plots. Figures 9-10 show two examples of learner visual attention with heat maps. A color scale moving from green to red indicates the fixation duration in AOI
Table 4: Questionnaire, Pre-, and Post-test results
From Table 4 and Figure 7 - 10, we obtained the following:
Pre- and post-test scores (Table 4) - In general, the post-test scores were higher than the pre-test scores. When each aspect was considered, the following areas were identified as post-test scores that were lower than the pre-test scores: user 04 in content 2/style A, and user 08 in content 2/style B.
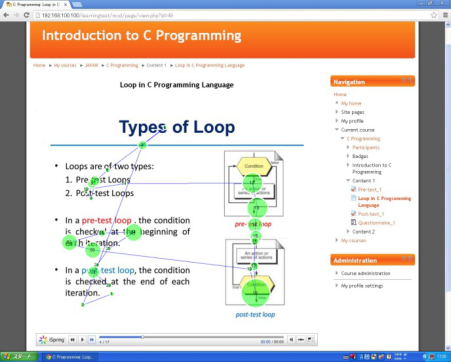
Fixation plots with AOI From the pre- and post-test scores, user 04 got good scores in content 1/style B and poor scores in content 2/ style A (Table 4). We looked at his eye movements with fixation plots: - He concentrated on following the reading sequences of the content from right-to-left and top-to-bottom (Figure 7). This result indicates that he felt interested. - He focused on the disorganized sequences and jumped to several places, such as the navigation, the taskbar, and the out of areas (Figure 8). This result indicates that he felt bored.
Heat maps with AOI From the pre- and post-test scores, user 08 got good scores in content 1/style A, and poor scores in content 2/ style B (Table 4). We looked at his eye movements with heat maps: - He concentrated more on the learning area than on other parts of the screen (Figure 9). This result indicates that he felt interested. - He only concentrated on one area and did not change his focus to another area (Figure 10). This result indicates that he felt bored.
From the questionnaire scores that did not match the fixation plots and the heat maps with AOI from eye tracking, we focused on the eye tracking results because they are more precise than the questionnaire results, which cannot measure learner emotions in real time.
Figure 7. Example of fixation plot forFigure 8. Example of fixation plot for content 1/style B: user 04 content 2/style A: user 04Figure 9. Example of heat map for content 1/style A: user 08 Figure 10. Example of heat map for content 2/style B: user 08
CONCLUSION
We designed, implemented, and experimentally evaluated a prototype using pre- and post-test scores and questionnaires as well as eye tracking indexes as a fixation index related to learner emotions. Our fixation index consists of fixation and heat map data with AOI. In our experiment, we explored learner emotions with eye tracking indexes. Our new e-learning system consists of five modules: learners, instructors, servers, eye tracking, and analysis of learner emotions. From our experimental results, we found fixation plots and heat maps with AOI that are useful to analyze learner emotions. In future work, we need more precise classification fixation durations and we must also explore eye tracking indexes related to learner emotions.
ACKNOWLEDGMENTS
The Shibaura Institute of Technology, Japan, supported this research. We also thank the eight Brazilian students who volunteered for our experiments.
REFERENCES
Armato, A. Valenza, G. Scilingo, E.P. (2011), “Eye tracking and pupil size variation as response to affective stimuli: a preliminary study”, Pervasive Computing Technologies for Healthcare (PervasiveHealth), 5th International conference, May 23-26, Dublin, Republic of Ireland Areej, A.W. Hebah, E. Remya, P. G. Buthainah, A. D. (2010), “Exploring the Validity of Learning Styles as Personalization
Parameters in eLearning Environments: An Eyetracking Study”, 2010 2nd International Conference on Computer Technology and Development (ICCTD 2010). pp. 174-178. Charoenpit S., Ohkura M. (2013), “A New E-learning System Focusing on Emotional Aspect Using Biological Signals”,15th International Conference, HCI International 2013, Las Vegas, NV, USA, July 21-26, 2013, pp. 343-350. Duchowski, A. (2007). “Eye Tracking Methodology: Theory and Practice” (Second editor): Springer Hend, S. Al, K. Remya, G. (2010), “Eye Tracking and e-Learning: Seeing Through Your Students' Eyes”, in: eLearn
Magazine 2010(6):8. Ismail, E. H. Mohamed, K. (2011), “Learner Behavior Analysis through Eye Tracking”, The 6th International Conference on Virtual Learning ICVL 2011. pp. 458-463. Marco, P. Stefania, R. Calet, J. P. (2012), “Emotional E-Learning through Eye Tracking”, Global Engineering Education
Conference (EDUCON), 2012 IEEE, pp. 1-6. Mark, C. R. (2005), Hotspots and Hyperlinks: Using Eye-tracking to Supplement Usability Testing, Software Usability Research Laboratory Wichita State University Website: http://usabilitynews.org/hotspots-and-hyperlinks-using-eye-tracking-to-supplement-usability-testing/ Mealha, O. Veloso, A. Almeida, S. Rodrigues, R. Roque, L. Marques, R. Manteigueiro, C. (2012), “Eye Tracking Data
Representation and Visualization: on Information and Communication studies at CETAC.MEDIA,” Journal of Eye tracking, Visual Cognition and Emotion, Volume 2 Number 1, pp. 65-75.
LISTED IN THE AHFE DIGITAL BOOKSTORE CATALOGUE
Explore the complete digital volume
Advances in Science, Technology, Higher Education and Society in the Conceptual Age: STHESCA
Read this individual research paper free through the original publisher, or explore the full digital proceedings book.
ISBN 978-1-4951-2110-4
Explore this ISBN in the AHFE Bookstore ↗Listed in the July 2026 bookstore catalogue; search by ISBN to confirm current availability · Digital book purchase optional