Zhiman Zhu, Fei Wang, Ruoyu Hu, Ningyue Peng, Chengqi Xue (2022). The Application of the Aesthetic Measures of Interface Layout in Drawing 2.5D Graphic. In: Intelligent Human Systems Integration (IHSI 2022): Integrating People and Intelligent Systems. AHFE Open Access, vol. 22. https://doi.org/10.54941/ahfe100969
2.5D graphic or Isometric graphic, as a common graphic expression method, has been fully developed in 2021 and has become a prevalent UI illustration element. With the rapid development of computer technology, many two-dimensional graphic images are analyzed and calculated digitally, and integrated data are efficiently and automatically generated. Aesthetic evaluation starts from subjective perceptual evaluation to rational digital calculation. In order to better calculate the aesthetic evaluation of 2.5D graphic, combining various aesthetic evaluation researches in the two-dimensional plane and the existing aesthetic index evaluation methods, this paper puts forward the idea of applying the two-dimensional plane evaluation method to the element layout 2.5D graphic. The research refers to the 13 aesthetic measures in the interface layout proposed by the NGO. In this study ,we selects the 2.5D graphic in 11 existing web pages from the design website as the samples, and extracts two-dimensional layout diagram of these samples. Then the beauty index calculation of the samples layout data found that the 13 aesthetic measures all have significant characteristics. In the experimental part, this study chose to take the measure of balance in the aesthetic measures as an example. By analyzing the numerical setting of the calculation formula, we designed 16 experimental as samples, and 10 design-related practitioners are recruited as subjects for aesthetic evaluation. Finally, the standardized data is fitted with manual evaluation results. The experimental results show a certain similarity with the previous sample data calculations, which proves the applicability of this evaluation method and lays the foundation for the standardized calculation of the beauty of 2.5D graphic. Future research can be carried out on this basis, it is necessary to study a set of overall aesthetic evaluation methods of the system, which can be more intuitively applied to the evaluation and generation of 2.5D graphic aesthetics. When 2.5D material forms a unified material library, the computer can automatically perform aesthetic calculations and layouts to generate the required 2.5D graphic based on the needs and user aesthetics, reducing labor costs and ensuring the stable quality.
Intelligent Human Systems Integration (IHSI 2022): Integrating People and Intelligent Systems https://openaccess.cms-conferences.org/#/publications/book/978-1-7923-8988-7
INTRODUCTION
2.5D graphic(Isometric graphic), as a common graphic expression method, was included as an important trend of the 2019-2020 ISUX design trend report [1] and the 2020 behance design trend report [2]. And then it has been fully developed in 2021 and has become a prevalent UI illustration element.
2.5D graphic, also called isometric graphic, is a graphic element in which the length of each side of the object is scaled according to the drawing ratio, and all parallel lines on the object remain parallel when drawn. The common viewing angle of these graphics are 30-120-30. The isometric view first appeared in the 1980s and was used in the game field to disguise the two-dimensional picture as a three-dimensional effect. This view can not only enhance the spatial sense of the game, but also because the fixed perspective maintains the sense of the order of the game, it is widely loved by users. Now, this method is widely used in icon design, interface design, web design, infographic design, games, videos, etc. With the continuous development of the times, designers are no longer limited to flat homepages. Dynamic interactive pages have become the mainstream trend in 2022. The 2.5D graphics can more realistically transform the dynamics of three-dimensional objects on a two-dimensional plane, and will undoubtedly become the preferred style of designers.
RELATED WORK
With the rapid development of computer technology, many two-dimensional graphic images are analyzed and calculated digitally, and integrated data are efficiently and automatically generated. Aesthetic evaluation starts from subjective perceptual evaluation to rational digital calculation. The calculation of aesthetics originally originated from Brikhoff(1933)proposed famous mathematical calculation formulas for various aesthetic fields in his literature “Aesthetic Measure”[3]. NGO (2002) proposed calculation formulas for 13 aesthetic measure indicators in the interface layout, quantified the characteristics of the interface layout, and constructed an aesthetic measure index system [4]. Then in 2005, the concept of Computational Aesthetics was formally proposed at the first Conference on Computational Aesthetics in Graphics, Visualization and Imaging organized by the European Computer Graphics Society (EG) [5]. Since then, more and more scholars have begun to conduct research on the application and evaluation of computer aesthetics. Bauerly M et al. (2006) introduced the computational modeling of the influence of symmetry, balance, and the number of components on the aesthetic judgment of the interface, and verified them with experiments [6]. Lai CY et al. (2010) calculated the symmetry and balance of the text overlay image based on the principle of visual weight, and studied the best position of the text superimposed on the image [7]. Jin et al. (2012) proposed a piecewise quadratic aesthetic energy function constrained by linear inequality to measure the distance between the original position of the visual element and the aesthetic target position to evaluate the composition of the target image [8]. Zhou L et al. (2013) used gray relational analysis to study the order of beauty superiority of design schemes, and comprehensively evaluated the
Intelligent Human Systems Integration (IHSI 2022): Integrating People and Intelligent Systems https://openaccess.cms-conferences.org/#/publications/book/978-1-7923-8988-7
13 indicators proposed by NGOs [9]. Li M et al. (2019) focused on the aesthetic evaluation based on visual balance, and proposed a new method to analyze the color composition of the image by K-means clustering method, and then combine the visual center position of the image to quantify the law of visual balance and automatically evaluate the aesthetic value of the image [10]. The above-mentioned research on the aesthetic evaluation of these two- dimensional planes supports the application and development of computer-aided graphics and image technology.
Although the 2.5D graphics belongs to a two-dimensional plane, it is different from ordinary plane elements, and it shows a three-dimensional effect. If it can also be studied in combination with the evaluation method of the two-dimensional plane and quantify its aesthetic characteristics, shortly, it will be possible to automatically generate demanded 2.5D graphics based on demand and user aesthetics, reducing labor costs and ensuring stable quality.
UI 2.5D graphic illustrations for web design applications are mostly a small scene. From the design process, it is to draw simple isometric elements first and then combine them into a whole that fits the theme. Designers can change their thinking and regard the drawing of the whole picture as the layout of objects in a three-dimensional scene, that is, the placement of three-dimensional elements on a plane basis. Therefore, we can start with the layout of the elements and study whether the beauty calculation method suitable for two-dimensional planes can be applied to the formal aesthetic evaluation of the element layout in 2.5D graphics. This research first selects the calculation method based on the beauty index system proposed by NGO, collects existing websites with 2.5D graphics as samples, and calculates the beauty index after sample processing, and judges the significance of the value. Then select an indicator from the more significant indicators, design experimental samples combined with manual evaluation to fit standardized data, and conduct subsequent research and analysis.
BEAUTY INDEX CALCULATION BASED ON SAMPLE LAYOUT DATA The 13 aesthetic measures for graphic displays proposed by the NGO are: balance, equilibrium, symmetry, sequence, cohesion, unity, proportion, simplicity, density, regularity, economy, homogeneity, rhythm. These 13 measures play an effective evaluation role in the plane layout, and the 2.5D graphics stretch the two-dimensional plane longitudinally to a visual effect close to three-dimensional. So whether the graphic layout at this time can still be measured by indicators is worthy of further investigation. In order to observe whether the layout of 2.5D graphics in web page illustrations conforms to the rules of formal aesthetics, we selected 11 conceptual web samples with 2.5D graphics as the main visual design. The samples come from the web design section of design websites such as Dribble, Pinterest, Behance, and Qiantu.
Intelligent Human Systems Integration (IHSI 2022): Integrating People and Intelligent Systems https://openaccess.cms-conferences.org/#/publications/book/978-1-7923-8988-7
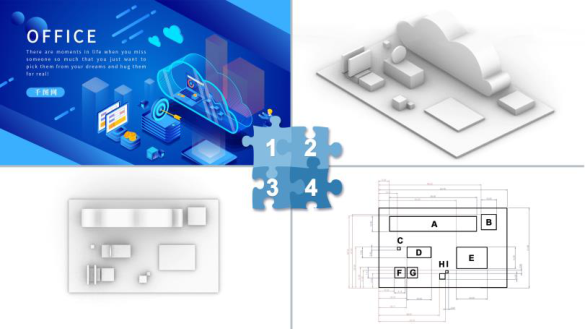
Sample Processing and Data Extraction After confirming the sample, we regarded the 2.5D graphics in the sample as a 3D figure, and use Rhino3D NURBS to simulate and model the sample. We adjusted the projection of the perspective working window of Rhino3D to be parallel, and the angle of view is adjusted to 30-120-30. And simplify the modeling at this angle as similar as possible to obtain a set of three-dimensional models, then record the top view of the model to simplify it to a two- dimensional plane composed of rectangles.
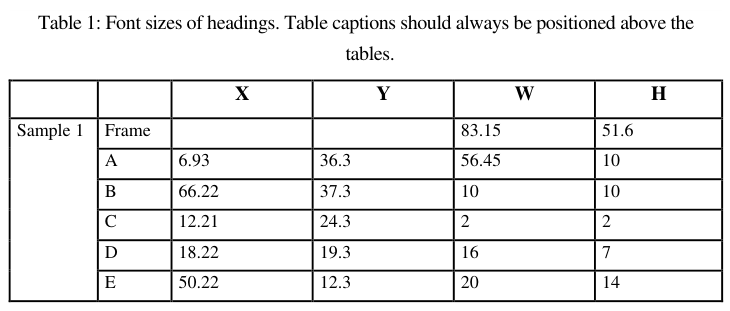
Since the formula needs the overall frame size, this study defines the frame as: take the edge of the rectangular element in the plane as the overall center and magnify it by 1.2 times, and then measure the width (W) and height (H). Then, using the lower left corner of the frame as the origin of the coordinates, the coordinates X and Y of the lower left corner of each rectangular element in this quadrant and the width (w) and height (h) of each rectangular element are measured ( the sample processing flow is shown in Figure 1) .
Figure 1. Sample processing flow chart. (Adapted from U.S Air Force, 2005)Table 1: Font sizes of headings. Table captions should always be positioned above the tables.
Intelligent Human Systems Integration (IHSI 2022): Integrating People and Intelligent Systems https://openaccess.cms-conferences.org/#/publications/book/978-1-7923-8988-7
Sample Data Calculation We putted the data in Table 1. into the 13 aesthetic measures for graphic displays proposed by the NGO to get the calculation results as shown in Table 2.
Table 2: The 13 aesthetic measures for graphic displays calculation results of S1.
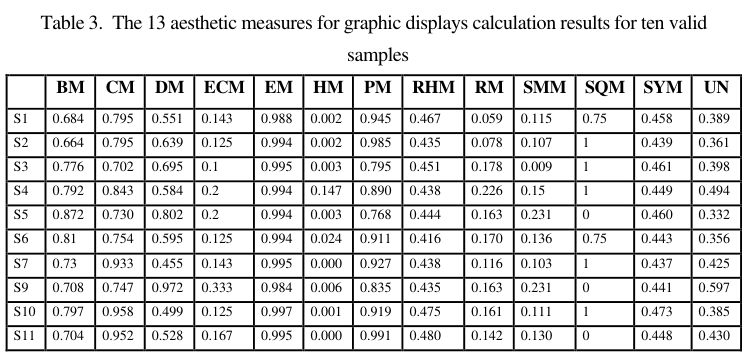
According to the above method, we modeled, simplified, and measured all 11 samples, and put the obtained data into calculations to obtain 143 values. Among them, sample 8 and the other 10 samples have completely different data presentation indicators as invalid data. In the remaining 10 valid samples, 13 indicators all showed significant significance (p <0.05) ( The data results are shown in Table 3.) . Among them, BM, ECM, EM, HM, RHM, RM, SMM, and SYM have low degree of dispersion and relatively high significance, which is worthy of in-depth study.
Table 3. The 13 aesthetic measures for graphic displays calculation results for ten valid samples
Intelligent Human Systems Integration (IHSI 2022): Integrating People and Intelligent Systems https://openaccess.cms-conferences.org/#/publications/book/978-1-7923-8988-7
BEAUTY INDEX CALCULATION BASED ON SAMPLE LAYOUT DATA Choice of Aesthetic Measures
Based on the research in the previous chapter, the calculation method of the two-dimensional aesthetic measurement can be applied to the bottom layout research of the 2.5D graphics, but the relationship between the different aesthetic measures and the overall aesthetic evaluation of the 2.5D graphics needs further verification. This article intends to take the balance index as an example to conduct an aesthetic evaluation research experiment. The balance index mainly calculates the difference between the total weight of each part on both sides of the horizontal axis and the vertical axis. The formula is as follows [4]: (1)
[Equation or mathematical symbol available in the original paper PDF][Equation or mathematical symbol available in the original paper PDF]1,0 2 1 [Equation or mathematical symbol available in the original paper PDF][Equation or mathematical symbol available in the original paper PDF][Equation or mathematical symbol available in the original paper PDF][Equation or mathematical symbol available in the original paper PDF] horizontal BM vertical BM BM R w L w BM [Equation or mathematical symbol available in the original paper PDF][Equation or mathematical symbol available in the original paper PDF] (2)
, max vertical
[Equation or mathematical symbol available in the original paper PDF][Equation or mathematical symbol available in the original paper PDF] R w L w
(3)
• [Equation or mathematical symbol available in the original paper PDF]
w w BM , max ho
B T rizontal w w
[Equation or mathematical symbol available in the original paper PDF][Equation or mathematical symbol available in the original paper PDF] B T
j n
(4)
ij ij j d a w B T R L , , , j [Equation or mathematical symbol available in the original paper PDF]
Equations and mathematical formulas are available in the original paper PDF.
In the formula, L, R, T, and B represent the four situations where the object is on the x and y axis, left, right, up and down, a is the area of the object on this side, and d is the distance from the center of the object on one side to the x, y axis. BMhorizontal is the balance index in the horizontal direction of the object, BMvertical is the balance index in the vertical direction of the object, and BM is the overall balance index. It is not difficult to see from the formula that the two most important variables of this formula are the area of the object and the distance from the center of the object to the x and y axes.
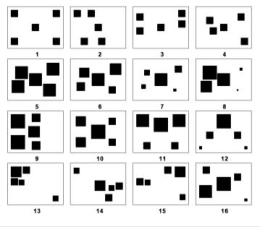
Experimental Sample Design In order to prevent the generation of too many experimental samples, the number of objects in each group of samples was selected as 5 in this experiment. According to the formula, the samples are divided into the following three situations (Figure 2. a):
Intelligent Human Systems Integration (IHSI 2022): Integrating People and Intelligent Systems https://openaccess.cms-conferences.org/#/publications/book/978-1-7923-8988-7
The area of objects do not change, the distance from objects to the x and y axis change.(S1- S4) The area of objects change, and the distance from objects to the x and y axis unchanged.(S5- S8)
The area of objects do change, the distance from objects to the x and y axis change.(S9-S16)
(a) (b)
Figure 2. Experimental sample display diagram, (a) is the layout diagram of the designed preliminary experimental sample, (b) is the final presentation sample stimulus
Based on these sixteen bottom layouts, we build simple models. Considering the influence of the vertical axis on the entire 2.5D graphics is indispensable, the situation where all elements have the same vertical axis is too dull and affects the perception, so the height of the elements in each sample is selected to be 25, 20, 20, 15 ,15. Refer to TSAI[11] et al.'s research results on perceptual aesthetics of text overlay graphics, we fixed the proportion of text in the web page layout, and the WBB value was as close as possible to 0.8 to generate the final sixteen experimental sample stimuli(Figure 2. b) In this experiment, the five-point scale in the Likert scale was used to evaluate the beauty of 16 samples. The number of participants in the experiment was 10, including 4 males and 8 females, with an average age of 23 years old, all of whom were students majoring in design.
Survey value fitting
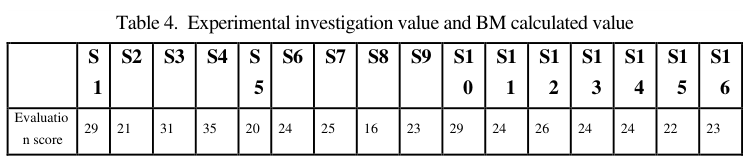
Table 4. Experimental investigation value and BM calculated value S S2 S3 S4 S S6 S7 S8 S9 S1 S1 S1 S1 S1 S1 S1
Intelligent Human Systems Integration (IHSI 2022): Integrating People and Intelligent Systems https://openaccess.cms-conferences.org/#/publications/book/978-1-7923-8988-7
0.62
0.75
0.64
0.22
0.52
0.73
0.60
0.72
0.18
0.37
0.32
0.55
BM 1 0.59
1
2
3 1 0.73
3
1
7
1
6
9
6
7
4
8
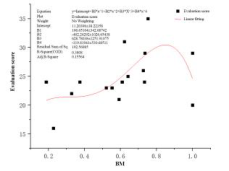
3 We used the data processing software Originlab to use the BM calculation value in Table 4 as x and the experimental investigation value as y to generate a data discrete point diagram, and perform a polynomial fitting experiment. The fitting results are shown in Figure 3.
(a) (b) (c)
Figure 3. (a) is the result of quadratic polynomial fitting, the degree of fit is 0.14113;(b) is the result of cubic polynomial fitting, the degree of fit is 0.20045;(c) is the fitting result of the fourth degree polynomial, the degree of fit is 0.15564
It can be seen from Figure 3. that the degree of fit of the cubic polynomial is the highest, so we finally choose the third-degree polynomial as the moderately standardized formula for the equidistant graph plane layout. The formula extreme value is 0.8185. The BM calculation results of the ten existing sample layout data selected in the previous chapter are between 0.664 and 0.872, with an average value of 0.754,which is very close to the extreme value of 0.8185 in this experiment. This shows that the research results have a certain degree of reliability.
CONCLUSIONS
This paper proposes an aesthetic evaluation method for 2.5D graphics based on planar layout. This method is to process 2.5D graphics as 3D stereo graphics, and then apply the two- dimensional plane aesthetic calculation evaluation method to a brand new evaluation idea of the element plane layout in 2.5D graphics.And we have proved the applicability of this evaluation method through experiments.
The aesthetic evaluation method in this article brings a possibility for the automatic generation of 2.5D graphics on web pages. Through the quantification of the beauty of different indexes in the 2.5D graphics, the drawing of 2.5D graphics becomes intelligent.This trend greatly saves the designer's work cost and time, and can also stabilize the quality of the design through accurate calculations.In the future, we will continue to study and improve this aesthetic evaluation method, and apply it to the evaluation and generation of 2.5D graphic aesthetics as soon as possible.
Intelligent Human Systems Integration (IHSI 2022): Integrating People and Intelligent Systems https://openaccess.cms-conferences.org/#/publications/book/978-1-7923-8988-7
REFERENCES
[1].ISUX Design Trend Report,https://isux.tencent.com/articles/isux-designtrendreport- 2019.html [2].2020-Design-Trends,Mihai Baldean,Loredana Papp-Dinea,Milo Themes, https://www.behance.net/gallery/86124977/2020-Design-Trends [3].Birkhoff, George David. Aesthetic measure. Harvard University Press, 2013. [4].Ngo, David Chek Ling, Lian Seng Teo, and John G. Byrne. "Modelling interface
aesthetics." Information Sciences 152 (2003): 25-46. [5].Neumann, L., et al. "Defining computational aesthetics." Computational aesthetics in graphics, visualization and imaging (2005): 13-18. [6].Bauerly, Michael, and Yili Liu. "Computational modeling and experimental investigation
of effects of compositional elements on interface and design aesthetics." International journal of human-computer studies 64.8 (2006): 670-682. [7].Lai, Chien-Yin, et al. "Computational models and experimental investigations of effects of balance and symmetry on the aesthetics of text-overlaid images." International journal of human-computer studies 68.1-2 (2010): 41-56. [8.]Jin, Yong, Qingbiao Wu, and Ligang Liu. "Aesthetic photo composition by optimal crop-
and-warp." Computers & Graphics 36.8 (2012): 955-965. [9].Lei, Z. H. O. U., et al. "Aesthetic evaluation method of interface elements layout design."
Journal of Computer-Aided Design & Computer Graphics 5 (2013). [10].Li, Mao, Jiancheng Lv, and Chenwei Tang. "Aesthetic assessment of paintings based on visual balance." IET Image Processing 13.14 (2019): 2821-2828. [11].Tsai, Mien-Tsung, et al. "Perceived visual aesthetics of text-overlaid images:
Computational models and experimental research for white-space fraction." International Journal of Human-Computer Interaction 30.1 (2014): 1-23.
Intelligent Human Systems Integration (IHSI 2022): Integrating People and Intelligent Systems https://openaccess.cms-conferences.org/#/publications/book/978-1-7923-8988-7
LISTED IN THE AHFE DIGITAL BOOKSTORE CATALOGUE
Explore the complete digital volume
Intelligent Human Systems Integration (IHSI 2022): Integrating People and Intelligent Systems
Read this individual research paper free through the original publisher, or explore the full digital proceedings book.
ISBN 978-1-7923-8988-7
Explore this ISBN in the AHFE Bookstore ↗Listed in the July 2026 bookstore catalogue; search by ISBN to confirm current availability · Digital book purchase optional