Xinyi Tang, Linlin Wang, Ningyue Peng, Chengqi Xue (2023). Effects of Visual Anchors in Sequential Presentations of Data Visualization. In: Intelligent Human Systems Integration (IHSI 2023): Integrating People and Intelligent Systems. AHFE Open Access, vol. 69, pp. 650–656. https://doi.org/10.54941/ahfe1002887
Nowadays, people need to process a great deal of complex information, and make more elaborate estimations or decisions. One particular concern when handling complex information is that the first piece of information tends to bias cognition and results in estimation deviation, which is referred to as the anchoring effect. Currently, some researchers on information visualization suggest that anchoring effects can not only be found in classical numerical anchors, but in the form of visual anchors. Recent research concerning the anchoring effects in visualization investigated the existence of anchoring effects in a variety of forms and tasks of data visualization. However, these studies seem to focus only on evaluating whether users are subject to anchoring biases in a way similar to previous studies from psychology, and it is still unclear how various sequential presentations of information affect decision-making. The present study is aimed to investigate the effects of different presentations of anchors on the performance of decision-making, thus providing some support for mitigating this kind of cognitive bias.Methods To investigate, two within-subjects experiments were performed. In both experiments, participants were tasked to estimate the value of target stimuli, which presented after anchoring stimuli. In Experiment 1, A 2 (anchor value: higher vs. lower) ×2 (anchor source: experimenter-provided vs. self-generated) experimental design was adopted, to check if these factors of anchoring stimuli play a role in numerical estimation. Based on the results of Experiment 1, showing no anchoring effects under the condition of self-generated anchors, the purpose of Experiment 2 was to evaluate how different presentations of experimenter-provided anchors (with four conditions: control, clockwise, counterclockwise, and vertical) facilitate or hinder visual information processing, thus affecting decision-making. User behavior and performance in decision-making were assessed through multiple behavioral metrics, including an estimation value metrics, an estimation accuracy metric based on the correctness and a time-of-task metrics.Results Evidence of anchoring effects was presented by analyzing a variety of presentations of visual anchors. The data of Experiment 1 revealed that when responding to experimenter-provided anchors, the estimation of the target stimuli was affected by the prior anchoring stimuli, while the same results were not observed under the condition of self-generated anchors. It is shown in the Experiment 2 that these four different types of visual anchors were comparable on most metrics, and there are significant differences between three experimental groups and the control group. Then implications of our results on future work was discussed, such as the need for more physiological and electrophysiological methods to investigate underlying neural mechanisms, and raise concerns on how to alleviate anchoring biases through the design of data visualization. Conclusions To sum up, the existence of anchoring effects in data visualization was uncovered under two sources of anchors. Moreover, the effects of anchors of different presentations on decision-making was evaluated by comparing four types of visual anchors through various behavioral metrics. Our findings of this study open the potential for discovering biased visual information processing and judgements, as well as bring some insights into the design of data visualization, which might be applied to information visual analytic systems.
At present, people need to process a great deal of complex information, and make more elaborate estimations or decisions than before. One particular concern when handling complex information is that the first piece of infor- mation tends to bias cognition and results in estimation deviation, which is known as the anchoring effect (Furnham & Boo, 2011; Tversky & Kahne- man, 1974). Currently, some researchers on information visualization suggest that anchoring effects can not only be found in classical numerical anchors (Blankenship et al., 2008; Mussweiler & Strack, 2000), but in the form of visual anchors (Cho et al., 2017; Valdez et al., 2018; Wesslen et al., 2018). Recent studies in anchoring effects in visualization paid attention to investi- gating the existence of such effects in a variety of forms and tasks of data visualization (Cho et al., 2017; Valdez et al., 2018; Wesslen et al., 2018; Wesslen et al., 2019). However, these studies seem to focus only on exami- ning whether participants’ judgements would be biased in the same way as
Effects of Visual Anchors in Sequential Presentations of Data Visualization 651
classical research in psychology, and it is still unclear how and how far vari- ous sequential presentations of information affect participants’ estimation. The present study is aimed to investigate the effects of different presentations of anchors on reduction of estimate deviation, thus providing some insights into mitigating this kind of cognitive bias.
This paper has two key goals. To examine the performance of bias redu- ction, it is necessary to verify the presence of bias. Thus, the first goal is to examine the existence of anchoring effects using the theory of anchor source, which tries to explain the mechanisms of anchoring by distinguish- ing two main anchoring processes (Epley & Gilovich, 2001). According to this theory, anchors can be divided into “experimenter-provided (EP)” and “self-generated (SG)” anchors. The EP anchor is provided directly by experi- menters, whereas the SG one is generated by participants themselves (Epley & Gilovich, 2004; Mussweiler, 2003; Strack & Mussweiler, 1997). Conside- ring that the existence of anchoring effects has been proved, the second goal is to check if the presentations of anchors modulate estimation deviation.
Based on previous findings (Ma et al., 2015; Qu et al., 2008), we hypothesized the following: H1: Participants’ estimation value would be affected by the prior anchors. H2: The size of the anchoring effect would be lower under SG anchors than EP anchors. H3: The estimate deviation value would be lower in experimental groups than in the control group.
GENERAL METHODOLOGY Two experiments were performed to examine the effects of different presenta- tions of anchors on the human performance of numerical estimation. In both experiments, participants were tasked to estimate the value of target stimuli. The same modified one-step paradigm (Wilson et al., 1996) was adopted in the two experiments.
Participants Two groups of participants were recruited for two experiments (mean age: 23.52 years old, standard deviation (SD)=2.14). Each has a Bachelor’s degree or above in design or engineering. They all have self-reported normal or corrected-to-normal vision. Each of participants was voluntary and was provided the written informed consent approved by Ethics Committee of Southeast University affiliated ZhongDa Hospital.
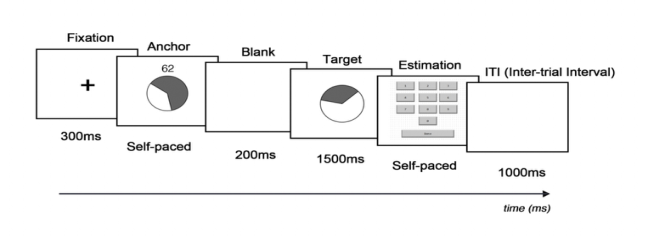
Procedure Participants sat on a comfortable chair in front of a computer screen located at eye level at a distance of 75 cm in a quiet, normal light laboratory. Before taking the experiment, participants signed the informed consent form volun- tarily. Following the practice blocks (10 trials) is the formal experiment. In
Figure 1: The procedure of one trial conducted in both experiments.
both experiments, the main session consisted of 4 blocks and each block con- sisted of 24 trials, resulting in 96 trials in total. The procedure of one trial is illustrated in Figure 1.
EXPERIMENT 1 The first experiment objective is to examine the existence of the anchoring effect, as well as investigate if the value and source of anchoring stimuli affect its existence.
Methods
(1) Experimental design A 2 (anchor value: higher vs. lower) ×2 (anchor source: EP vs. SG) within- subject experimental design was adopted. Trials of EP and SG anchors were presented in separate blocks. Higher anchors or lower anchors were ran- domly presented in each block. The order of blocks was counterbalanced over all participants.
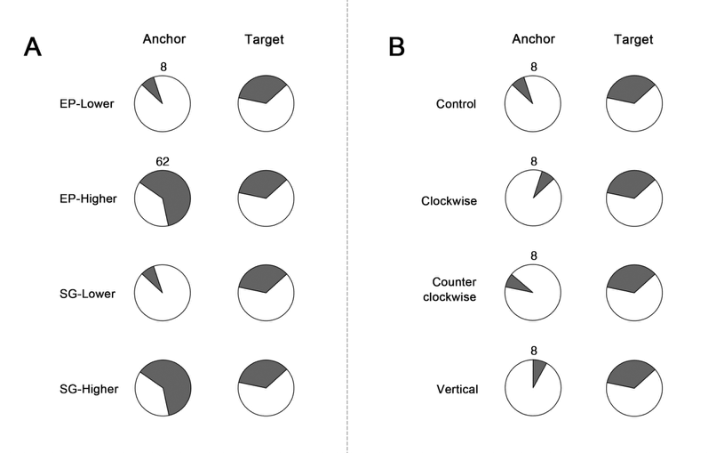
(2) Stimuli Two anchoring pie charts was set for one target pie chart as higher anchor and lower anchor. In EP anchor condition, the anchors were provided directly through visual cues; while in SG anchor condition, the anchors were genera- ted by participants themselves according to their experience of pie charts (see Figure 2A).
(3) Statistical analysis The estimate values were averaged within each condition (EP-lower, EP- higher, SG-lower, SG-higher). For EP and SG anchor conditions, the estimate values under lower and higher anchor conditions were analyzed respectively using the related t-test. An alpha level of .05 was used. The metric of reaction time was analyzed in the same way as the estimate values.
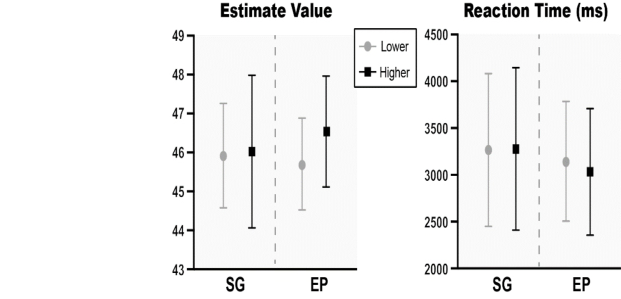
Results and Discussions It is shown that the estimate values are significantly higher for the higher anchor than for the lower one under EP anchors (t (24) = 2.982, p = 0.006). However, when it comes to SG anchors, there is no significant difference between higher and lower anchors (t (24) = 0.476, p = 0.638). In addition, no significant difference in reaction time is found under either EP anchor condition (t (24) = -.161, p = 0.873), or SG anchor condition (t (24) = 1.005, p = 0.325) (see Figure 3).
Effects of Visual Anchors in Sequential Presentations of Data Visualization 653
Figure 2: (A) Sample stimulus pairs used in Experiment 1. (B) Sample stimulus pairs used in Experiment 2.Figure 3: Changes in the metric of estimate value and reaction time under different conditions.
The results indicate a sizeable anchoring effect under the condition of EP anchors (H1 is confirmed), but no anchoring bias under SG anchors. Thus, H2 is partially supported. To further examine the comparative effectiveness of various presentations of data visualization in mitigating the anchoring bias, the second experiment was performed using EP anchors as stimuli.
EXPERIMENT 2 Based on the results of Experiment 1, showing no anchoring effects in SG anchors, the purpose of Experiment 2 is to evaluate how different presentations of EP anchors facilitate or hinder biased performance.
Methods
(1) Experimental design A within-subject design was adopted. The independent variable was the presentations of experimenter-provided anchors (with four conditions: con- trol, clockwise, counterclockwise, and vertical). The task and setting were similar to Experiment 1.
(2) Stimuli Sample stimulus pairs in four conditions are shown in Figure 2B. In con- trol condition, the angle of anchoring stimulus was randomly generated; in clockwise condition, anchor-target pairs aligned clockwise; in counterclo- ckwise condition, anchor-target pairs aligned counterclockwise; in vertical condition, the angle of anchoring stimulus was set in vertical position.
(3) Statistical analysis The estimate deviation values (difference between the correct value and the estimate value input by participants) were averaged within each condition and were analyzed using repeated-measure analysis of variance (ANOVAs). An alpha level of .05 was used. The Greenhouse–Geisser method was used to correct data that violated the spherical hypothesis, and the Bonferroni method was used to correct P-values in multiple comparisons. The metric of reaction time was analyzed in the same way as the estimate values.
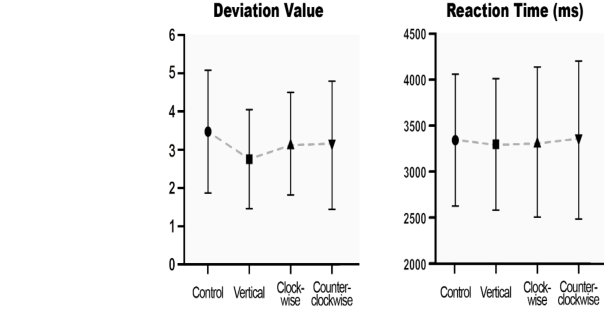
Results and Discussions The ANOVA results show that the main effect of presentation factor is significant on participants’ estimate deviation values (F (3,22) = 6.827, p = 0.01, η2 = 0.221). The multiple comparison analysis shows that the difference in estimate deviation value between the vertical and control con- dition reaches the statistically significant level (p < 0.001). In contrast, no significant difference is found when comparing the estimate deviation values between clockwise and control condition, as well as between counterclockw- ise and control condition. In addition, no significant difference in reaction time is found under four different conditions (F (3,22) = 0.91, p = 0.945, η2 = 0.004) (see Figure 4).
In general, compared with the control condition, the estimate deviation is lower under the condition of vertical presentation. The results indicate that vertical presentations of pie charts help reduce estimation deviation. It is suggested that vertical presentations of pie charts facilitate visual information processing and mitigate anchoring bias. However, compared with the control condition, the estimate deviation under conditions of clockwise and counte- rclockwise shows no significant difference. Therefore, the evidence partially supports the third hypothesis (H3).
GENERAL DISCUSSION The present study explored the influence of visual anchors in different sequ- ential presentations on participants’ performance in a numerical estimation task. The results of Experiment 1 revealed the existence of anchoring bias under EP anchors, but not under SG anchors. Thus, H1 was supported, and H2 was partially supported. In Experiment 2, the estimate deviation was
Effects of Visual Anchors in Sequential Presentations of Data Visualization 655
Figure 4: Changes in the metric of estimate deviation value and reaction time under different conditions.
lower under the condition of vertical presentations of pie charts than the control condition (H3 was partially confirmed).
In Experiment 1, the lack of anchoring effects under SG anchors might be attributed to the experimental design. When the anchoring stimuli presented on the screen, the self-paced procedure made participants tend to skip SG anchors, because SG anchors included less useful information than EP anch- ors. Further work needs to be done to explore how to design an effective self-generated anchor in data visualization.
In Experiment 2, the results of implies that the vertical presentation of pie charts enabled to mitigate anchoring bias to some extent, although the esti- mate deviation has not been eliminated. This finding is in line with previous studies in psychology (Epley & Gilovich, 2005). In addition, although not statistically significant, the overall trends in the average estimate deviation values of three experimental groups are lower than the control group. The reason for statistically nonsignificant results might be the overmuch trials, which cause participants to memorize target stimuli.
CONCLUSION
To sum up, the existence of anchoring effects in data visualization is unco- vered under two sources of anchors. Moreover, the effects of anchors of different presentations on decision-making is evaluated by comparing four types of visual anchors through various behavioral metrics. Our findings of this study open the potential for discovering biased visual information pro- cessing and judgements, as well as bring some insights into the design of data visualization, which might be applied to information visual analytic systems.
ACKNOWLEDGMENT
This work was supported by the National Natural Science Foundation of China [grant numbers 71871056]. The authors would like to thank all the participants for carrying out the experiments. Further, we deliver our sincere
thanks for the editor and anonymous reviewers for their valuable comments and advice.
REFERENCES
Blankenship, K. L., Wegener, D. T., Petty, R. E., Detweiler-Bedell, B., & Macy, C. L.
(2008). Elaboration and consequences of anchored estimates: An attitudinal per- spective on numerical anchoring. Journal of Experimental Social Psychology, 44(6), 1465–1476. doi:10.1016/j.jesp.2008.07.005. Cho, I., Wesslen, R., Karduni, A., Santhanam, S., Shaikh, S., & Dou, W. (2017). The anchoring effect in decision-making with visual analytics. Paper presented at the 2017 IEEE Conference on Visual Analytics Science and Technology (VAST). Epley, N., & Gilovich, T. (2001). Putting adjustment back in the anchoring and
adjustment heuristic: Differential processing of self-generated and experimenter- provided anchors. Psychological science, 12(5), 391–396. Epley, N., & Gilovich, T. (2004). Are adjustments insufficient? Pers Soc Psychol Bull, 30(4), 447–460. doi:10.1177/0146167203261889. Epley, N., & Gilovich, T. (2005). When effortful thinking influences judgmental
anchoring: differential effects of forewarning and incentives on self-generated and externally provided anchors. Journal of Behavioral Decision Making, 18(3), 199– 212. doi:10.1002/bdm.495. Furnham, A., & Boo, H. C. (2011). A literature review of the anchoring effect. The journal of socio-economics, 40(1), 35–42. Ma, Q., Li, D., Shen, Q., & Qiu, W. (2015). Anchors as semantic primes in value
construction: an EEG study of the anchoring effect. PloS one, 10(10), e0139954. Mussweiler, T. (2003). Comparison processes in social judgment: mechanisms and consequences. Psychol Rev, 110(3), 472–489. doi:10.1037/0033-295x.110.3.472. Mussweiler, T., & Strack, F. (2000). Numeric Judgments under Uncertainty: The Role
of Knowledge in Anchoring. Journal of Experimental Social Psychology, 36(5), 495–518. doi:10.1006/jesp.1999.1414. Qu, C., Zhou, L., & Luo, Y.-j. (2008). Electrophysiological correlates of adjustment process in anchoring effects. Neuroscience letters, 445(3), 199–203. Strack, F., & Mussweiler, T. (1997). Explaining the enigmatic anchoring effect:
Mechanisms of selective accessibility. Journal of personality and social psychology, 73(3), 437. Tversky, A., & Kahneman, D. (1974). Judgment under Uncertainty: Heuristics and Biases. Science, 185(4157), 1124–1131. doi:10.1126/science.185.4157.1124. Valdez, A. C., Ziefle, M., & Sedlmair, M. (2018). Priming and Anchoring
Effects in Visualization. IEEE Trans Vis Comput Graph, 24(1), 584-594. doi:10.1109/TVCG.2017.2744138. Wesslen, R., Santhanam, S., Karduni, A., Cho, I., Shaikh, S., & Dou, W. (2018).
Anchored in a data storm: How anchoring bias can affect user strategy, confidence, and decisions in visual analytics. arXiv preprint arXiv:1806.02720. Wesslen, R., Santhanam, S., Karduni, A., Cho, I., Shaikh, S., & Dou, W. (2019). Investigating Effects of Visual Anchors on Decision-Making about Misinformation. Computer Graphics Forum, 38(3), 161–171. doi:10.1111/cgf.13679 Wilson, T. D., Houston, C. E., Etling, K. M., & Brekke, N. (1996). A new look at
anchoring effects: basic anchoring and its antecedents. Journal of Experimental Psychology: General, 125(4), 387.
LISTED IN THE AHFE DIGITAL BOOKSTORE CATALOGUE
Explore the complete digital volume
Intelligent Human Systems Integration (IHSI 2023): Integrating People and Intelligent Systems
Read this individual research paper free through the original publisher, or explore the full digital proceedings book.
ISBN 978-1-958651-45-2
Explore this ISBN in the AHFE Bookstore ↗Listed in the July 2026 bookstore catalogue; search by ISBN to confirm current availability · Digital book purchase optional