Zihan Zhao, Wenzhe tang, Linlin Li, ChengQi Xue (2023). Effects of Users’ Familiarity in Icons on the Cognitive Performance of Icon Identification. In: Intelligent Human Systems Integration (IHSI 2023): Integrating People and Intelligent Systems. AHFE Open Access, vol. 69, pp. 946–953. https://doi.org/10.54941/ahfe1002920
This study investigated the effects of icon familiarity on visual search task and semantic information recall. First, participants need to search for target icons among 10 unfamiliar icons. The familiarity of the ten target icons is different, which is determined by the number of occurrences in the training stage. In the training stage, subjects are familiar with the ten icons and their semantics, and the number of occurrences of each icon is random. After the visual search task, participants first memorize the semantic information of the icon, and then recall the semantic information of the corresponding icon. The results showed that in the visual search task, the participants' response time was faster when the icons were more familiar.
With the improvement of information technology as well as the development of human–computer interactions, icons have become an important compo- nent of digital user interfaces. Compared with words, graphic symbols can transcend language barriers and convey a large amount of information in a more concise and effective way. However, people are still likely to misunder- stand the meaning of poorly designed icons. Therefore, reducing cognitive friction and improving user experience are the key issues in icon design.
Generally speaking, when designers create icons, they need to consider three icon features: visual complexity, concreteness and semantic distance. Up to now, many studies have studied the impact of these icon features on visual search performance: people react faster and more accurately to simple icons than to complex icons, and users can understand specific icons better (Stammers & Hoffffman, 1991), icons with close semantic distance are easier to identify (Goonetilleke, Shih, On, & Fritsch, 2001). However, some rese- archers have noticed that the performance differences among different icon types decrease after users gain a lot of icon experience (Green & Barnard, 1990). McDougall et al. (2000) conducted a series of experiments to examine what is considered to be the core factor of icon usability. The results show that the performance difference between concrete and abstract icons decre- ases when the icon set is used more frequently. In order to further explore
Effects of Users’ Familiarity in Icons on the Cognitive Performance 947
this problem, Isherwood, McDougall, and Curry (2007) tested an icon reco- gnition task in a series of experiments to simulate the impact of increasing user experience. Participants were asked to select the target icon (from the grid of 8 icons) and they thought the label matched the semantic informa- tion. At the same time, when they choose the correct or incorrect icon, they will receive different feedback. The results show that the importance of icon features will change with the change of user experience. Previous studies have shown that familiarity is a very important factor that has a lasting impact on icon recognition.
Although only a few studies have discussed the impact of familiarity on icon recognition, many researchers have conducted extensive research in other related fields, such as picture naming, language learning, and word recognition. Nimmo and Roodenrys (2002) found that immediate continu- ous recall was more accurate for more frequent non word syllables. Popenk, Kohler and Moscovitch (2010) revealed that whether the familiarity was manipulated by experiments or formed by previous experience, participants were more likely to recall familiar proverbs than new proverbs. Nelson and Shiffrin (2013) used a new training paradigm to familiarize participants with new knowledge about Chinese characters, and then tested participants’ performance on memory tasks. These studies suggest that participants’ fami- liarity with stimuli may significantly affect their information encoding or retrieval performance. Therefore, because icon recognition is a cognitive pro- cess, it includes the association between encoding and retrieving icons and repeated operations.
METHOD
In this paper, the experimental design is based on the paper (Shen, 2018). In the training stage, the icons and their semantics are presented to the partici- pants at the same time, and the target icons are searched from ten unfamiliar icons in the search task, Test the time of search and the accuracy of response. Then, participants memorize and learn the target icon, and test the effect of semantic recall.
Participants Eight college students, 6 men and 2 women (ages ranging from 22 to 24 years) from Southeast University participated in this study. All participants were volunteers and had never participated in similar experiments before.
Materials and Design In this experiment, 20 uncommon icons in the direction of intellectual pro- perty service are selected, which are simple and abstract icons, and the complexity of these 20 icons is basically the same. Ten of them were selected as experimental icons and presented to the subjects for familiarity training. Each icon has a corresponding Chinese semantic. The number of familiar icons was divided into high-frequency icons and low-frequency icons. The other ten icons are used as icon material for visual search tasks.
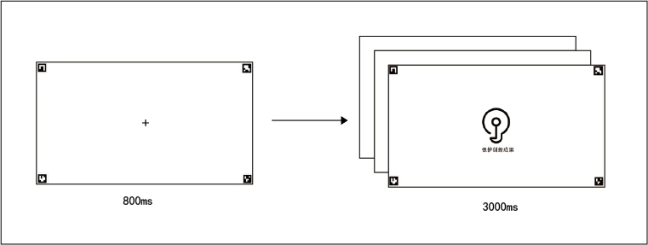
Figure 1: Icon familiarity training.
The experiment consists of one training task and two testing tasks. In the training phase, 10 icons were randomly divided into high frequency group and low frequency group, of which 5 icons were high frequency (presented 10 times), and the other 5 icons were low frequency (presented 1 time). Since the ratio of high frequency to low frequency is set at 10:1, by using these 10 icons, we conducted 50 high frequency tests (i.e. 5 * 10 = 50) and 5 low frequency tests (i.e. 5 * 1 = 5), presenting 55 icons and their corresponding semantics. In the experiment, each icon was randomly presented for 3s (see Figure 1). The logo on the four corners of the page is the marker of d-lab software, which is used to locate and analyze the visual hot area.
Two test tasks were set up in this experiment, namely visual search task and semantic recall task.
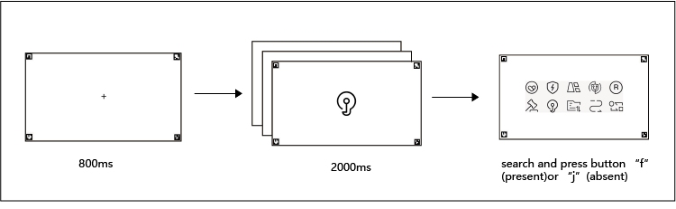
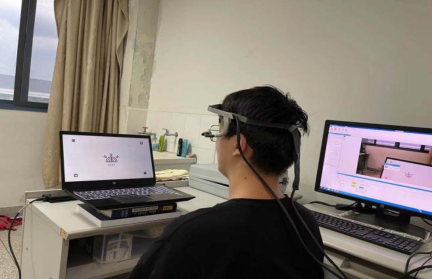
Visual Search Task After the 800ms fixation interface, a target icon is randomly presented on the screen for 2000ms (without semantics), and then 10 icons are presented. Participants need to search and judge whether there are target icons in these icons. If yes, press the “F” key, but not the “J” key. Each icon after fami- liarity training is randomly presented for 3 times, with a total of 30 trails (3 * 10 = 30), The 10 icons in the corresponding search task are composed of 10 icons with familiarity training, or 9 icons without familiarity training and 1 target icon with familiarity training. Among the 30 tracks designed in the experiment, the answer of 20 tracks is “F”, the answer of 10 tracks is “J”, and among the three tracks presented by each target icon, 2 tracks are “F” and 1 track is “J” (see Figure 2, Figure 3).
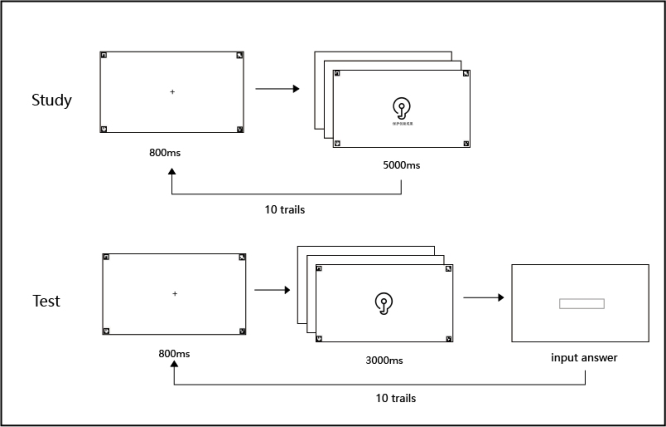
Semantic Information Recall Task In the semantic recall task, participants need to remember first and then test. First, 10 familiar trained icons are presented randomly for 5000ms. Partici- pants’ task is to remember the semantics of these icons. After presenting a target icon at random for 3000ms in the subsequent test task, participants need to recall and input the semantics of the icon. There are 10 trails (see Figure 4).
Effects of Users’ Familiarity in Icons on the Cognitive Performance 949
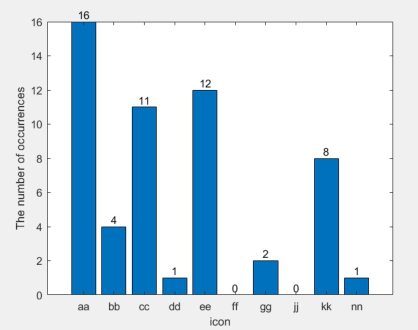
Figure 2: Trial sequence for visual search task.Figure 3: The subject was experimenting.Figure 4: Trial sequence for semantic information study and test.Figure 5: different icons familiarity of subject1. The abscissa is the name of ten icons, and the ordinate is the number of occurrences.
DISCUSSION & CONCLUSION The expectation of experimental analysis is to extract the response time and accuracy of visual search task, and explore the relationship with icon fami- liarity through analysis of variance. However, in the sorting of experimental data, it is found that in the training stage, the presentation times of 10 target icons are completely random, not according to the five pre-designed presen- tations 10 times and five presentations 1 time. There are problems in the preparation of experimental procedures. This bothered me for a long time, because there was no way to control the familiarity of the participants with the icon, and the subsequent test tasks were meaningless, and the data could not be analyzed according to the plan. But the experiment has been done, and it takes a lot of time and energy to design the experiment, prepare the experimental materials, write the program, and then find participants to do the experiment, so I intend to process the existing experimental data and try to find the method of analysis.
After statistics, it is found that the number of times that the 10 targets are presented to different subjects in the training stage is not the same, so the first thing to know is the familiarity of each icon. Because we need to count the data of each subject separately, but the workload of counting 14 subjects is too huge, so we select 8 subjects who are more concentrated in the process of experiment for statistics. First of all, to understand the familiarity of each subject with each icon, it is necessary to count the presentation times of each icon. Firstly, the icon familiarity of 8 subjects should be counted. Take subject 1 as an example (see Figure 5).
The number of times icons appear represents the familiarity of subjects with icons. Since the test times of each icon in the visual search test are also random, calculate the average response time of each icon, and compare the average response time and accuracy of each icon in the visual search task with the icon familiarity.
Effects of Users’ Familiarity in Icons on the Cognitive Performance 951
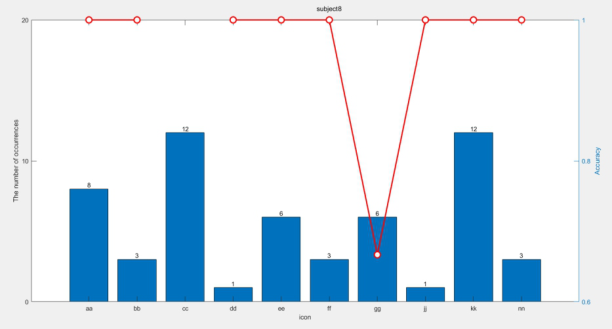
Figure 6: Relationship between icon familiarity and accuracy of subject 8.Figure 7: icon gg (the left) and similar icon in visual search task.
We use the number of times that subjects learn different icons to express their familiarity with each icon. Next, we take the data of No. 8 as an example to analyze the influence of learning times on the accuracy and reaction time of the experiment.
From the figure 6, we can see that the icons aa, cc and kk have learned 8, 12 and 12 times respectively. Compared with the icons bb, dd, jj and nn, they appear much more frequently. We think they are high-frequency icons, while the latter is low-frequency icons. Among them, the icon GG has been learned 6 times, and the frequency is medium, but the accuracy rate is the lowest, only 33%.
Based on the comparative analysis of the images of subjects 3 and 5 on the learning times and accuracy rate of different icons, it can be seen that the icon GG accuracy rate is the lowest, and the accuracy rate of other icons is 100% in the test regardless of the number of learning times. This may be because there are icons similar to GG in the visual search task, which affect the participants’ judgment (see Figure 7).
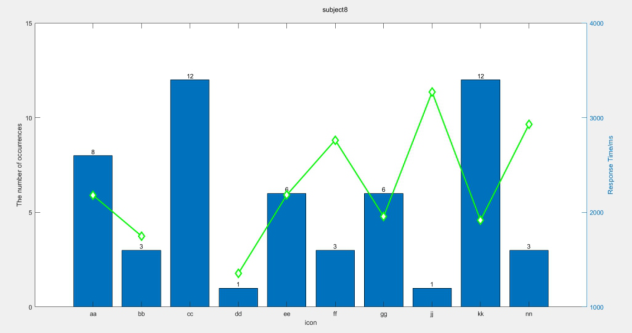
The images of learning times and reaction time of subject 8 on different icons are shown in the following figure.
As can be seen from Figure 8, among the icons ee, ff, gg, jj, kk and nn, the subjects learn the icon kk the most and the reaction time is the shortest. The icons ee and gg learn more and the reaction time is a little longer. The icons ff and nn learn the least and the reaction time is longer. The icons jj learn
Figure 8: Relationship between icon familiarity and response time of subject 8.
at least once and the reaction time is the longest. From this, we can draw a conclusion: the more subjects learn a certain icon, the shorter the time it takes to select this icon in the experiment.
Analysis of variance was conducted with icon familiarity as the indepen- dent variable and average response time as the dependent variable. The sign = 0.046 < 0.05. So icon familiarity has a significant impact on the response time in visual search tasks. This shows that the subjects spend less time and faster in searching familiar icons.
Using icon familiarity as the independent variable and the accuracy of visual search test as the dependent variable, the analysis of variance shows that sign = 0.694 > 0.05, and icon familiarity has no significant effect on the accuracy of visual search task. In other words, no matter how familiar the subjects are with the icon, it does not affect the accuracy of visual search.
The results of ANOVA are consistent with the previous icon analysis. By observing the eye movement trajectory of participants in visual search, we can find that there are usually two kinds of trajectory paths. When the subjects are familiar with the icon, one is to look at the target icon directly from the center point, and the other is to search left and then right from the center point, which is in line with the reading habit of people from left to right.
In the semantic information recall task, there was no significant correlation between participants’ recall and icon familiarity. The design of the experimen- tal process still needs to be improved. There are still many deficiencies in the experimental design. For example, the semantic length of the target icon is inconsistent, and the memory difficulty for participants is inconsistent. The complexity and semantic distance of icons have not been strictly tested.
REFERENCES
Goonetilleke, R. S., Shih, H. M., On, H. K., & Fritsch, J. (2001). Effects of training and representational characteristics in icon design. International Journal of Human-Computer Studies,55, 741–760.
Effects of Users’ Familiarity in Icons on the Cognitive Performance 953
Green, A. J. K., & Barnard, P. J. (1990). Iconic interfacing: The role of icon distinctiveness and fixed or variable screen locations. In D. Diaper, D. Gilmore, G. Cockton, & B. Shackel (Eds.), Human–Computer Interaction – Interact ‘90 (pp. 457–462). Amsterdam: Elsevier Science. Isherwood, S. J., Mcdougall, S. J. P., & Curry, M. B. (2007). Icon identification in
context: The changing role of icon characteristics with user experience. Human Factors, 49, 465–476. McDougall, S.J.P., de Bruijin, O., & Curry, M.B.(2000). Exploring the effects of icon characteristics on user performance: The role of icon concreteness, complexity, and distinctiveness. Journal of Experimental Psychology Applied, 6, 291–306. Nelson, A., & Shiffffrin, R. (2013). The co-evolution of knowledge and event
memory. Psychological Review, 120, 356–394. Nimmo, L. M., & Roodenrys, S. (2002). Syllable frequency effects on phonological short-term memory tasks. Applied Psycholinguistics, 23, 643–660. Poppenk, J., Köhler, S., & Moscovitch, M. (2010). Revisiting the novelty efff-
fect: When familiarity, not novelty, enhances memory. Journal of Experi- mental Psychology: Learning, Memory, and Cognition, 36(5), 1321–1330. doi: 10.1037/a0019900 Shen, Z., Xue, C., & Wang, H. (2018). Effects of users’ familiarity with the objects depicted in icons on the cognitive performance of icon identification. i-Perception, 9(3), 1–17. doi: 10.1177/ 2041669518780807 Stammers, R., & Hoffman, J. (1991). Transfer between icon sets and ratings of icon
concreteness and appropriateness. Human Factors & Ergonomics Society Annual Meeting Proceedings, 35, 354–358.
LISTED IN THE AHFE DIGITAL BOOKSTORE CATALOGUE
Explore the complete digital volume
Intelligent Human Systems Integration (IHSI 2023): Integrating People and Intelligent Systems
Read this individual research paper free through the original publisher, or explore the full digital proceedings book.
ISBN 978-1-958651-45-2
Explore this ISBN in the AHFE Bookstore ↗Listed in the July 2026 bookstore catalogue; search by ISBN to confirm current availability · Digital book purchase optional