RUIFENG YU, Minhui Yuan, Lin Ding, Bing Han (2026). Both insufficient adjustment and selective accessibility exist in the anchoring effect: evidence from eye dynamics in estimation tasks. In: Accessibility, Assistive Technology and Digital Environments. AHFE Open Access, vol. 202, pp. 58–68. https://doi.org/10.54941/ahfe1007297
Extant studies on the underlying mechanism of the anchoring effect are almost based solely on the decisions people make and the findings remain controversial. Focusing on the decision process, this research examined how an individual arrives at his decisions by introducing the methods of eye-tracking and pupillometry into the research on the anchoring effect for the first time. Here, we found in two experiments: in comparison with no anchor situation, the presence of an anchor caused shorter response time, larger pupil size, lower blink frequency, higher saccade frequency, larger amplitude, and shorter duration in the stimuli area. It appeared that both insufficient adjustment and selective accessibility exist in the anchoring effect. The amounts of adjustment based on the anchor value in the participants’ decisions were proportional to the size of the deviation of the anchor value from the true value and were inversely proportional to their confidence level in estimation.
People make many decisions under uncertainty (e.g., product choice, numerical estimation, and investment), and their judgments are often biased toward an initially presented value or information—an effect known as anchoring (Tversky and Kahneman, 1974). When asked to compare a reference value (the anchor) with an unknown target, estimates typically shift toward the anchor (Langeborg and Eriksson, 2016; Snowman and Kucharska, 2020). Although anchoring is robust across domains and settings (Furnham and Boo, 2011), its underlying mechanism remains debated.
The anchoring-and-adjustment account argues that people start from the anchor and adjust insufficiently because adjustment is satisficing rather than optimal (Tversky and Kahneman, 1974; Jacowitz and Kahneman, 1995). Thus, higher anchors tend to yield higher final estimates and vice versa. In contrast, activation-based accounts emphasize automatic processes (Navarre et al., 2022). The dominant selective accessibility model proposes that anchors act as plausible hypotheses and prime anchor-consistent knowledge, leading decision makers to sample information from a biased pool and thereby move Received February 6, 2026; Revised April 12, 2026; Accepted April 27, 2026; Available online July 20, 2026
Both Insufficient Adjustment and Selective Accessibility Exist in the Anchoring 59 judgments toward the anchor (Chapman and Johnson, 1994; Strack and Mussweiler, 1997).
Prior work suggests internally generated anchors may rely more on adjustment, whereas externally provided anchors may rely more on selective accessibility (Epley and Gilovich, 2001, 2006), though both mechanisms may contribute (Simmons et al., 2010; Chaxel, 2014). A key limitation is that most studies infer mechanisms from final estimates, even though both accounts can produce similar outcomes. Theoretical differences should appear in the decision process: adjustment is effortful and cognitively demanding, whereas priming is relatively automatic (Kahneman, 2011). Therefore, process measures are needed to disentangle them.
Eye dynamics can index both cognitive effort and search bias(Leckey et al., 2020) turning to adults for help. Increased workload is associated with larger pupil size (Eldar et al., 2021), and reduced blink frequency (Holland and Tarlow, 1972), leading us to hypothesize that adjustment from an anchor will show pupil dilation and fewer blinks relative to a no-anchor baseline. Because purposeful visual search increases saccade frequency and amplitude (Irwin, 1998), we further hypothesize that selective accessibility will manifest as more frequent, larger saccades and shorter dwell time in areas containing stimulus-related information.
Accordingly, we propose that insufficient adjustment and selective accessibility can co-occur during estimation. We introduce eye dynamics, alongside performance data, to examine anchoring mechanisms during the decision process. Experiment 1 tested anchoring effect in three estimation task types (common knowledge, value estimation, quantity estimation). To reduce confounding effects of question complexity on workload and focus on anchor-based adjustment, Experiment 2 used common knowledge items and manipulated anchor–truth deviation, providing clear evidence consistent with insufficient adjustment.
THE ANCHORING EFFECT ACROSS TASK TYPES: BEHAVIOURAL AND EYE MOVEMENT EVIDENCE Materials and Method
Participants Experiment 1 was approved by the Institutional Review Board at Tsinghua University. Ninety-seven participants (mean age 21.5, SD = 1.8) were recruited from Tsinghua University. None of the participants had taken part in similar experiments or had a background in knowledge related to anchoring effects.
Design and Procedure The experiment comprised three estimation tasks representing common decision contexts under uncertainty: common knowledge (CK) questions adapted for a Chinese context (Jacowitz and Kahneman,1995), value estimation (VE) of low-frequency daily products presented with pictures and consumer reviews from Taobao and Tmall to ensure uncertainty (Ariely et al., 2003; Simonson and Drolet, 2004), and quantity estimation (QE) from
visual displays (Langeborg and Eriksson, 2016). High and low anchors for 21 items were established from a calibration sample of 118 undergraduates, using the 25th and 75th percentiles of their estimates as the low and high anchors, respectively (Jacowitz and Kahneman,1995).
The study followed a 3 (task type) × 2 (anchor presence) mixed design, with task type as a within-participant variable. The study adopted the standard two-step anchoring paradigm (Tversky and Kahneman, 1974). Each trial began with a central fixation cross that participants clicked to initiate stimulus presentation. In the anchor-present condition, participants first made a comparative judgment (higher/lower than the anchor) and then provided an absolute estimate; in the anchor-absent condition, they provided an absolute estimate directly. Task blocks were presented in randomized order across anchor conditions. In VE, anchors appeared alongside consumer reviews; in QE, stimuli were displayed for 2000 ms during the comparative judgment and remained on screen during estimation. After completing each task type, participants reported perceived workload (Hart and Staveland, 1988) and the arousal level (Spielberger, 1980).
Apparatus Participants viewed a 19-inch laptop screen (1920 × 1200 pixels) from ~60 cm. Eye movements were recorded at 250 Hz using a Tobii Pro Fusion eye-tracker (Tobii Technology, Inc., Sweden). Data were processed and exported via the ErgoLAB 3.0 platform (Kingfar, Beijing).
Data Analysis Gaze data were processed using default Tobii filters (min duration: 60ms; merge: 75ms, 0.5°). Pupil diameter was averaged between eyes, applying a moving median filter for noise reduction. ANOVA was employed for parametric data; otherwise, the aligned-rank transformation method was used to analyze main and interaction effects. Significance levels were set at α = 0.05 and α = 0.10 (marginal).
Results
Common-knowledge items were excluded from eye-movement analyses because they lacked visual-search stimuli and primarily elicited knowledge retrieval rather than active sampling. Analyses therefore focused on value and quantity estimation tasks, where gaze better indexed attentional processes in anchor-based estimation judgment.
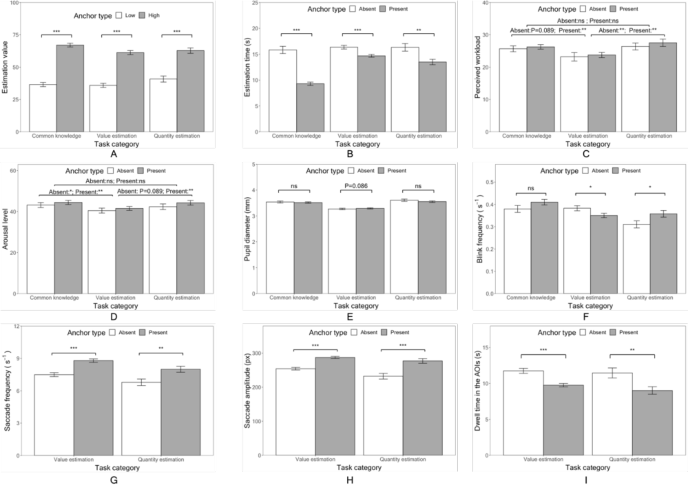
Estimation Value and Estimation Time As expected, the participants’ estimation values for common knowledge (CK), value estimation (VE), and quantity estimation (QE) questions in high- anchor conditions were all much higher than those in low-anchor conditions. These differences were significant (p < 0.05) except for the question on the price estimation of toilet tissue (Mlow = 24, Mhigh = 28, p = 0.306). It was likely that the participants’ familiarity with the price of toilet paper resulted in such
Both Insufficient Adjustment and Selective Accessibility Exist in the Anchoring 61 insignificance. To normalize data across questions, estimation values were converted to percentiles based on calibration group distributions. Significant differences between high- and low-anchor groups were observed across all categories (p < 0.001; Figure 1A), directly demonstrating the anchoring effect.
As for estimation time, significant main effects of anchor presence (F (1, 1737) = 59.05, p < 0.0001, η2 G = 0.033) and task categories (F (2, 1737) = 46.62, p < 0.0001, η2
G = 0.051) were observed (Figure 1B). The participants’ estimation times in the condition of anchor present were significantly shorter than those of anchor absent (p < 0.05). The interaction between them was significant (F (2, 1734) = 12.39, p < 0.0001, η2
G = 0.014), indicating that the effect of anchor presence on estimation time was moderated by the question category. The reduction in decision time between the anchor-present condition and anchor-absent condition was more dramatic for the common knowledge issue than those for the value estimation and quantity estimation issues (For CK and VE: MCK = 6.65, MVE = 1.67, t(14) = 6.33, p < 0.0001; For CK and QE: MCK = 6.65, MQE = 2.80, t(9) = 2.67, p = 0.025).
Figure 1: Effect of anchoring effect on estimation value (A), estimation time (B), perceived workload (C), arousal level (D), pupil diameter (E), blink frequency (F), saccade frequency (G), saccade amplitude (H), dwell time in the AOIs (I). Note. Error bars represent standard errors. *, p < 0.05; **, p < 0.01; ***, p < 0.001; ns, nonsignificant.
Perceived Workload and Arousal Level The participants’ perceived workload and arousal levels in different task categories and anchor presence were different (Figures 1C and 1D). The effects of task category were significant (F (2, 288) = 6.38, p = 0.002, η2
Equation reproduced from the original PDF.
G = 0.023, for arousal level). Although the participants’ perceived workloads and arousal levels in the anchor-present condition were higher than those in the anchor- absent condition, anchor presence yielded insignificant effects on perceived workload (F (1, 289) = 0.85, p = 0.357) and arousal level (F (1, 289) = 2.31, p = 0.136). Additionally, the interactions between anchor presence and task category on workload and arousal level were also insignificant. Whether in the anchor-absent or anchor-present conditions, the participants’ perceived workloads in the tasks of common knowledge and quantity estimation issues were higher than that in value estimation issue (anchor-absent: MCK = 25.68, MVE = 23.19; t (36) = 1.75, p = 0.089; MQE = 26.41, MVE = 23.19; t (36) = 2.76, p = 0.0091; anchor-present: MCK = 26.27, MVE = 23.75; t (59) = 3.41, p = 0.0012; MQE = 27.53, MVE = 23.75; t (59) = 3.44, p = 0.0011). However, the differences between common knowledge and quantity estimation issues were not significant (p > 0.1). Regarding the arousal levels, similar results as those of perceived workloads were obtained.
Eye Movement Data Anchor presence differentially impacted eye movement data across task types (Figures 1E-1F). In value estimation (VE), anchors led to marginally larger pupil diameters (F (1, 957) = 2.96, p = 0.086, η2
G = 0.003) and significantly lower blink frequencies (Mabsent = 0.38 vs Mpresent = 0.35, t (876) = 2.39, p = 0.017). In contrast, effects on pupil diameter for common knowledge (CK) and quantity estimation (QE) were non-significant (p > 0.1). However, a significant interaction was found for blink frequency (F (2,1823) = 5.63, p = 0.004, η2
G = 0.006), with CK and QE showing higher frequencies under anchor-present conditions (Mabsent = 0.38 vs. Mpresent = 0.42, t (491) = −1.43, p = 0.15, for common knowledge issues; Mabsent = 0.31 vs. Mpresent = 0.36, t (453) = −1.89, p = 0.059, for quantity estimation issues).
For information search dynamics (Figures 1G–1I), anchors significantly optimized visual processing in VE and QE tasks. Specifically, anchor presence increased saccade frequency (value estimation questions, Mabsent = 7.50, Mpresent = 8.80; t (941) = −5.52, p < 0.0001; quantity estimation questions, Mabsent = 6.79, Mpresent = 8.00; t (467) = −2.51, p = 0.012) and saccade amplitude (value estimation questions, Mabsent = 254.36, Mpresent = 287.35; t (942) = −6.84, p < 0.0001; quantity estimation questions, Mabsent = 232.30, Mpresent = 277.15; t (462) = −4.12, p < 0.0001). Simultaneously, dwell time in AOIs significantly decreased for both VE and QE (value estimation questions, Mabsent = 11.75, Mpresent = 9.76, t (819) = 4.71, p < 0.0001; quantity estimation questions, Mabsent = 11.46, Mpresent = 9.01, t (457) = 3.85, p = 0.0001). Interaction effects for these saccadic and dwell-time metrics were non-significant (p > 0.1).
Both Insufficient Adjustment and Selective Accessibility Exist in the Anchoring 63 Cognitive Mechanisms of the Anchor-Based Adjustment Process
Experiment 1 could not disentangle whether cognitive workload (e.g., pupil diameter) stemmed from anchor-based adjustment or task complexity. To isolate the impact of the adjustment process, Experiment 2 compared effort levels across different anchor values rather than anchor-absent conditions. Following Chapman & Johnson (1994), we employed a within-participant design where individuals responded to the same items under six anchor levels. By excluding task complexity, this approach reveals whether anchor- based adjustment drives the anchoring effect. Experiment 2 addresses two key questions: (1) whether the anchor’s deviation from the true value influences the adjustment amount, and (2) whether this adjustment amount subsequently affects cognitive workload levels.
Materials and Method Participants
Experiment 2 was approved by the Institutional Review Board at Tsinghua University. Thirty-one participants (mean age 21.6, SD = 3.1) were recruited from Tsinghua University. None of the participants had taken part in similar experiments or had a background in knowledge related to anchoring effects.
Design and Procedure Experiment 2 employed a three-level within-participants design (low, medium, and high anchor levels) using common knowledge questions from Experiment 1. The independent variable was anchor deviation from the true value, defined by calibration group percentiles: low (40th/60th), medium (20th/80th), and high (5th/95th). Following a fixation cross, participants performed the traditional two-step paradigm, providing a comparative judgment before an absolute estimate. The presentation order of the three anchor levels and the 10 questions within each level was fully randomized to ensure no adjacent questions from the same category. Upon completing each task group, participants reported their perceived workload (Hart and Staveland, 1988), arousal level (Spielberger, 1980) and confidence level (Briñol et al., 2007) via questionnaires.
Results
The same data analysis method as in Experiment 1 was used.
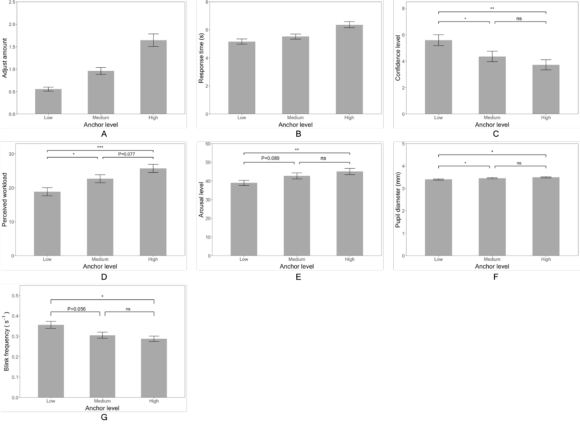
Adjustment Amount and Response Time The adjustment amount—defined as the absolute difference between the estimate and anchor relative to the anchor value—confirmed the effectiveness of the anchor level manipulation (Figure 2A), as participants’ estimates varied significantly across different levels. The ANOVA results showed a significant main effect of anchor level on adjustment amount [F(2,800) = 56.57, p < 0.001; η2
G = 0.12]. All post hoc paired comparisons indicated significant differences (p < 0.001). The more the anchor value deviates from the real
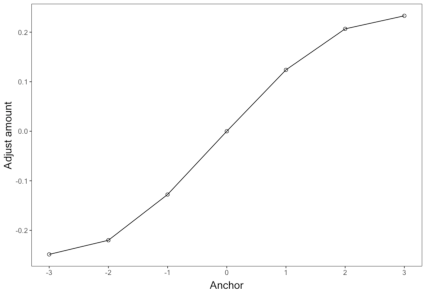
value, the greater the adjustment based on the anchor. Moreover, the direction of the adjustment amount was consistent with the real value. A multilevel regression revealed that the adjustment amount increased as the anchor level increased [Figure 3, B = 0.094, SE = 0.01, t(786) = 9.303, p < 0.001].
The results that response time collapsed across anchor levels (Figure 2B) showed that response time followed a downward trend as anchor level decreased. The effect of anchor level on response time was significant [F (2,894) = 12.85, p <0.001, η2
G = 0.028]. All post hoc paired comparisons indicated significant differences (p < 0.1). The more the anchor value deviated from the real value, the longer the response time.
Confidence Level, Perceived Workload and Arousal Level The confidence level, perceived workload, and arousal level of participants varied by anchor levels (Figures 2C, 2D, and 2E), and these variations were significant for confidence level [F (2, 87) = 5.74, p = 0.005, η2
Equation reproduced from the original PDF.Equation reproduced from the original PDF.
G = 0.083], respectively. In general, the more the anchor value deviated from the real value, the higher the mental workload and arousal level, and the lower the confidence level. These results implied that participants made more efforts, had higher arousal levels, and became more prudent when the increase of the anchor value deviated from the real value.
Figure 2: Effect of anchor level on adjustment amount (A), response time (B), confidence level (C), perceived workload (D), arousal level (E), pupil diameter(F), and blink frequency (G). Note. Error bars represent standard errors. *, p < 0.05; **, p < 0.01; ***, p < 0.001; ns, nonsignificant.Figure 3: Adjustment amount as a function of anchor level. Note. 0 for median; +1, +2, +3 for low-anchor, medium-anchor, high-anchor above the median; −1, −2, −3 for low- anchor, medium-anchor, high-anchor below the median.
Pupil Diameter and Blink Frequency The average pupil diameter and blink frequency of participants varied by anchor levels (Figures 2F and 2G), and these variations were significant [pupil diameter: F (2, 897) = 3.67, p = 0.026, η2
Equation reproduced from the original PDF.
G = 0.007], respectively. Overall, as the anchor’s deviation from the real value increased, the pupil diameter followed an upward trend while blink frequency followed a downward trend, i.e., a person had a larger pupil diameter and lower blink frequency with the increase in the deviation from the real value of the anchor value.
DISCUSSION
The results demonstrate that anchoring emerged as a robust bias in common knowledge (CK), value estimation (VE), and quantity estimation (QE) tasks, and it persisted across both text- and image-based stimuli. A notable boundary condition was observed for highly familiar products (e.g., toilet tissue), where participants’ narrow acceptable price ranges encouraged reliance on prior experience rather than external anchors, attenuating the effect (Alford and Engelland, 2000). This pattern suggests that anchoring is strongest when internal reference values are uncertain or weakly constrained. In Experiment 1, anchors reliably reduced estimation time, with the largest time savings in CK tasks. CK stimuli contain little beyond the question itself, reducing the need for external information search and allowing anchors to be integrated quickly with stored knowledge. By contrast, VE and QE require evaluating reviews or extracting visual quantity information, which can dilute the time advantage of anchoring even when estimates remain biased.
Physiological metrics jointly indicate that anchoring mechanisms vary with task demands. In VE, anchors increased pupil diameter and decreased blink frequency, suggesting elevated mental workload and effortful processing (Holland and Tarlow, 1972) consistent with anchoring-and-adjustment, in which participants engage in cognitively demanding comparison and adjustment that remains typically insufficient (Epley and Gilovich, 2001,
2006). By contrast, comparable physiological shifts were not evident in CK and QE despite higher self-reported workload and arousal, possibly because high baseline demands—memory retrieval in CK and complex spatial estimation in QE (Langeborg and Eriksson, 2016)—mask additional anchor-related load, underscoring the need to disentangle adjustment effort from effort required for unanchored number generation. Complementing these findings, eye-tracking results in VE and QE showed increased saccadic activity and reduced dwell time in task-relevant AOIs under anchoring, indicating faster, more efficient visual search (Irwin, 1998) consistent with selective accessibility: anchors may trigger an initial hypothesis that guides confirmatory information sampling, improving search efficiency while increasing neglect of disconfirming cues (Mussweiler and Strack, 1999).
Experiment 2 strengthened the adjustment account by manipulating anchor deviation within CK, reducing confounds from task heterogeneity. Greater deviation produced larger adjustments but still yielded systematic insufficient adjustment, consistent with anchoring’s stability (Epley and Gilovich, 2001; Mussweiler and Englich, 2005). The continuous relation between deviation and adjustment echoes functional forms proposed previously (Chapman and Johnson, 1994). Response times increased with deviation, indicating that adjustment is time-consuming; however, taken together with Experiment 1, the results suggest anchors can still accelerate overall decision-making by providing a rapid starting point relative to unaided value generation.
Finally, larger adjustments reduced confidence, implying that deviation- induced difficulty may raise cognitive anxiety (Woodman and Hardy, 2003) and that confidence reflects both cognitive and affective inputs (Earle, 2009). Perceived extremity of one’s estimate may further depress confidence (Lewis et al., 2019), complicating the expectation that greater elaboration necessarily increases certainty (Barden and Petty, 2008).
CONCLUSION
Across common knowledge, value estimation, and quantity estimation tasks, the two experiments indicate that anchoring reflects the joint operation of selective accessibility and insufficient adjustment. Experiment 1 showed that anchors accelerated information search, supporting selective accessibility, whereas evidence for insufficient adjustment was task-dependent and emerged reliably only in value estimation. To reduce confounds from task difficulty and mental workload, Experiment 2 manipulated anchor–truth deviation within common knowledge questions and observed systematically varying yet incomplete adjustments, providing clearer support for insufficient adjustment. Overall, these findings clarify the process mechanisms underlying anchoring in estimation and inform practical strategies to mitigate or leverage anchoring effects.
ACKNOWLEDGMENT
This work was supported by the National Natural Science Foundation of China under grant number 72171130.
REFERENCES
Alford, B.L. and Engelland, B.T. (2000) “Advertised reference price effects on consumer price estimates, value perception, and search intention,” Journal of Business Research, 48(2), pp. 93–100. Ariely, D., Loewenstein, G. and Prelec, D. (2003) “Coherent arbitrariness”: Stable
demand curves without stable preferences,” The Quarterly journal of economics, 118(1), pp. 73–106. Barden, J. and Petty, R.E. (2008) “The mere perception of elaboration creates attitude certainty: Exploring the thoughtfulness heuristic.,” Journal of personality and social psychology, 95(3), p. 489. Briñol, P., Petty, R.E. and Barden, J. (2007) “Happiness versus sadness as a
determinant of thought confidence in persuasion: A self-validation analysis.,” Journal of Personality and Social Psychology, 93(5), pp. 711–727. Available at: https://doi.org/10.1037/0022-3514.93.5.711. Chapman, G.B. and Johnson, E.J. (1994) “The limits of anchoring,” Journal of Behavioral Decision Making, 7(4), pp. 223–242. Available at: https://doi. org/10.1002/bdm.3960070402. Chaxel, A.-S. (2014) “The impact of procedural priming of selective accessibility
on self-generated and experimenter-provided anchors,” Journal of Experimental Social Psychology, 50, pp. 45–51. Earle, T.C. (2009) “Trust, confidence, and the 2008 global financial crisis,” Risk Analysis: An International Journal, 29(6), pp. 785–792. Eldar, E. et al. (2021) “A pupillary index of susceptibility to decision biases,” Nature
Human Behaviour, 5(5), pp. 653–662. Available at: https://doi.org/10.1038/ s41562-020-01006-3. Epley, N. and Gilovich, T. (2001) “Putting adjustment back in the anchoring and adjustment heuristic: Differential processing of self-generated and experimenter- provided anchors,” Psychological science, 12(5), pp. 391–396. Epley, N. and Gilovich, T. (2006) “The anchoring-and-adjustment heuristic: Why the
adjustments are insufficient,” Psychological science, 17(4), pp. 311–318. Furnham, A. and Boo, H.C. (2011) “A literature review of the anchoring effect,” The journal of socio-economics, 40(1), pp. 35–42. Hart, S.G. and Staveland, L.E. (1988) “Development of NASA−TLX (Task Load
Index): Results of Empirical and Theoretical Research,” in P.A. Hancock and N. Meshkati (eds.) Advances in Psychology. North−Holland (Human Mental Workload), pp. 139–183. Available at: https://doi.org/10.1016/S0166- 4115(08)62386-9. Holland, M.K. and Tarlow, G. (1972) “Blinking and mental load,” Psychological Reports, 31(1), pp. 119–127. Irwin, D.E. (1998) “Lexical processing during saccadic eye movements,” Cognitive
Psychology, 36(1), pp. 1–27. Jacowitz, K.E. and Kahneman, D. (1995) “Measures of anchoring in estimation tasks,” Personality and Social Psychology Bulletin, 21(11), pp. 1161–1166. Kahneman, D. (2011) Thinking, fast and slow. Macmillan. Langeborg, L. and Eriksson, M. (2016) “Anchoring in numeric judgments of visual
stimuli,” Frontiers in Psychology, 7, p. 225. Leckey, S. et al. (2020) “Response latencies and eye gaze provide insight on how toddlers gather evidence under uncertainty,” Nature Human Behaviour, 4(9), pp. 928–936. Available at: https://doi.org/10.1038/s41562-020-0913-y. Lewis, J., Gaertig, C. and Simmons, J.P. (2019) “Extremeness aversion is a cause of
anchoring,” Psychological Science, 30(2), pp. 159–173.
Mussweiler, T. and Englich, B. (2005) “Subliminal anchoring: Judgmental consequences and underlying mechanisms,” Organizational Behavior and Human Decision Processes, 98(2), pp. 133–143. Mussweiler, T. and Strack, F. (1999) “Hypothesis-consistent testing and semantic
priming in the anchoring paradigm: A selective accessibility model,” Journal of Experimental Social Psychology, 35(2), pp. 136–164. Navarre, A., Didierjean, A. and Thomas, C. (2022) “Anchoring effect induces false memories,” Psychonomic Bulletin & Review, pp. 1–7. Simmons, J.P., LeBoeuf, R.A. and Nelson, L.D. (2010) “The effect of accuracy
motivation on anchoring and adjustment: Do people adjust from provided anchors?,” Journal of personality and social psychology, 99(6), p. 917. Simonson, I. and Drolet, A. (2004) “Anchoring effects on consumers’ willingness-topay and willingness-to-accept,” Journal of consumer research, 31(3), pp. 681–690. Snowman, A. and Kucharska, J. (2020) “The effect of anchoring on curriculum vitae
(CV) judgments.,” The Psychologist-Manager Journal, 23(1), p. 12. Spielberger, C.D. (1980) “Test Anxiety Inventory,” in The Corsini Encyclopedia of Psychology. John Wiley & Sons, Ltd, pp. 1–1. Available at: https://doi. org/10.1002/9780470479216.corpsy0985. Strack, F. and Mussweiler, T. (1997) “Explaining the enigmatic anchoring effect:
Mechanisms of selective accessibility.,” Journal of personality and social psychology, 73(3), p. 437. Tversky, A. and Kahneman, D. (1974) “Judgment under Uncertainty: Heuristics and Biases: Biases in judgments reveal some heuristics of thinking under uncertainty.,” science, 185(4157), pp. 1124–1131. Woodman, T. and Hardy, L. (2003) “The relative impact of cognitive anxiety and
self-confidence upon sport performance: A meta-analysis,” Journal of sports sciences, 21(6), pp. 443–457.
LISTED IN THE AHFE DIGITAL BOOKSTORE CATALOGUE
Explore the complete digital volume
Accessibility, Assistive Technology and Digital Environments
Read this individual research paper free through the original publisher, or explore the full digital proceedings book.
ISBN 978-1-964867-78-6
Explore this ISBN in the AHFE Bookstore ↗Listed in the July 2026 bookstore catalogue; search by ISBN to confirm current availability · Digital book purchase optional