Minhui Yuan, Xiaokun Du, Ruifeng Yu, Xinran Xu (2023). The effect of individual ability differences and personality traits on social comparison. In: Social and Occupational Ergonomics. AHFE Open Access, vol. 106, pp. 77–87. https://doi.org/10.54941/ahfe1003967
These days, some work groups use the publication of employees’ performance information as feedback on their work, such as sales champions in car sales or real estate sales, to improve group performance by using well-performing employees to motivate poor-performing employees to promote their individual work effort. Social comparison theory helps people to evaluate their abilities when lacking an absolute objective standard. This study explored the effects of individual ability level, the combination of ability levels, and personality traits on social comparison among co-operators. Method: A three-way mixed design of 2 (work condition: individual work; group work) X 3 (individual ability level: high ability; medium ability; low ability) X 3 (combination of ability levels: the combination of two high-ability, one medium-ability and one low-ability; the combination of one high-ability, two medium-ability and one low-ability; the combination of one high-ability, one medium-ability and two low-ability) was used, with 180 subjects completing the illusion ensemble task and completing the personality trait questionnaires (including Rosenberg self-esteem scale, Eysenck Personality Inventory(EPQ), Social Comparison Orientation Scale(INCOM) and social comparative effect scale) under different experimental conditions. Results: The results indicated that work condition significantly influenced individual performance. Besides, individual ability level had a significant effect on social comparison. The impact of work condition on individual performance was different for subjects with varying levels of ability: the performance of high-ability subjects significantly decreased, while both medium-ability and low-ability subjects significantly increased, and low-ability subjects had significantly higher performance improvement than medium-ability subjects. Moreover, different combinations of ability levels significantly impacted subjects' individual behavior. Low-ability subjects in the combination of one high-ability, one medium-ability, and two low-ability subjects had the most significant improvement, which was the combined result of the upward identification and parallel comparison. Furthermore, personality traits play a crucial role in social comparison. Self-esteem had a significant effect on participation in social comparison. Subjects with low self-esteem were more inclined to participate in social comparisons and changed sharply in individual performance relative to those with high self-esteem. In addition, neuroticism was associated with adverse effects caused by social comparison (e.g., upward-contrast effect and downward-identification effect), whereas extraversion was associated with positive effects induced by social comparison (e.g., upward-identification). Apart from this, social comparison propensity was found to be positively associated with changes in individual performance and negatively related to self-esteem scores. Additionally, performance change in medium-ability subjects may primarily come from the effect of the downward-contrast effect from the result of the social comparison effect scale. Conclusions: This study illustrates the impact of individual ability and personality traits on social comparison, and provides feasible suggestions for the work organization to improve group performance. Based on the performance changes across groups, an increment in the number of high-ability subjects caused a decrease in team performance, whereas an increment in the number of low-ability subjects positively affected overall team performance. Therefore, group work organizations can improve team performance by increasing the number of low-ability members and reducing the number of high-ability members in future management.
To improve team performance, many groups use published employee perfor- mance information as feedback, such as sales champions in the car or real estate sales categories. This way, low-performing employees could enhance their individual work efforts by comparing them with high-performing ones. Social comparison theory suggests that when people can’t find an absolute objective standard to evaluate and define their ability, they will find their own position by comparing themselves with others (Festinger, 1954). The primary purpose of social comparison is to obtain information about self- ability. The three potential motivations for comparison commonly accepted in social comparison research are self-evaluation, self-improvement, and self- enhancement (Wood, 1989; Taylor, Wayment and Carrillo, 1996; Schunk and DiBenedetto, 2020). By comparing the performance of co-operators, indi- viduals will adjust their behavior. The social comparison effect is used to measure the direction of social comparison, which may be followed by an identification effect, which is the convergence of self-evaluation toward the
goal, or a contrast effect, which is the divergence of self-evaluation from the goal (Van der Zee et al., 2000).
Seta et al. assigned an operator to work with a collaborator whose per- formance level was higher than, lower than, or equal to him and made the operator aware of the performance comparison with the collaborator by giving feedback, then revealing that individuals did not compare performa- nce with collaborator when the difference in ability was too significant (Seta, 1982). Besides, the study of performance differences in operator behavior in the scenario containing two collaborators showed that moderate performa- nce differences were better, regardless of whether individuals were upward or downward comparison (Dan et al., 2009). Moreover, studies showed that upward comparison information produced an identification effect if indivi- duals found that they could achieve success in the comparison goal and a contrast effect if individuals found that they could not achieve success in the comparison goal (Lockwood and Kunda, 1997). However, current studies were conducted in contexts where only one collaborator worked together. Therefore, only one direction of Comparison for each operator was available, such as separate upward, downward, or parallel comparison. But the groups are large in reality and the direction of comparison is often not homogeneous. For example, in a workgroup that includes high-ability, medium-ability, and low-ability participants, there are collaborators with higher and lower per- formance than the medium-ability participants, meaning there may be both upward and downward comparisons.
In addition, research has shown that personality traits also impact the social comparison process. Gibbons et al. defined the personality traits pre- disposing individuals to social comparison as social comparison tendencies. People with high social comparison tendencies often had a strong sense of uncertainty about themselves, were more concerned about interpersonal inte- ractions and interested in information about others’ thoughts and behaviors, thus were more likely to evaluate themselves through social comparison (Gib- bons and Buunk, 1999). Self-esteem also influenced social comparisons, with low self-esteem individuals preferring social comparisons due to the insta- bility of their self-concept. In contrast, individuals with high self-esteem individuals could respond to comparison threat by thinking about their traits, states, and behaviors (Wayment and Taylor, 1995; Diel, Grelle and Hofmann, 2021). Besides, individuals with high neuroticism exhibit a more increased need to compare, and engage frequently in upward comparison, and were more likely to show negative emotions following comparison, whereas extro- verts were more inclined to downward comparison due to their optimism associated with a tendency to want to do better than others (VanderZee, Buunk and Sanderman, 1996).
This study explores social comparison in a four-person group that con- tains both upward, downward, and parallel comparison directions, and discusses the effects of individual ability level, ability level combinations, and personality traits on individual behavior and performance. By analy- zing the performance of individuals in different ability level combinations, we obtain behavioral characteristics of individuals with multiple different com- parison directions (upward, downward, and parallel comparison), extend the
The Effect of Individual Ability Differences and Personality Traits 79
existing social comparison theory to multi-person situations, and explore the group composition that achieves the maximum level of individual performa- nce. This study also help lay the theoretical foundation for designing and optimizing the optimal form of group co-working work organization.
MATERIAL AND METHOD Participants
In this study, 180 participants (i.e., 87 males and 93 females, aged 17–35 years, mean age = 22.27 years) were recruited. All had normal or corrected- to-normal vision.
Design A mixed experimental design of 2 (work condition) × 3 (individual abi- lity level) × 3 (combination of ability levels) was used in this study. Work condition included individual work and group work. In the individual work condition, the participants completed the illusion ensemble task alone, while in the group work condition, the participants completed the same task in a four-person group. The four participants were positioned at a 90
angle to each other, and the distance between them was 1m. Individual ability level was categorized into high, medium, and low ability based on participants’ actual performance in the individual work condition. Before group work, all participants were informed of the simulated performance. The simulated performance was a random number generated according to the actual abi- lity level of the participants (Muller, Atzeni and Butera, 2004), where the stimulated performance of high-ability participants was a random number in [72.5%,77.5%], stimulated performance of medium-ability participants being a random number in [57.5%,62.5%], and stimulated performance of low-ability participants being a random number in [42.5%,47.5%]. There were three combinations of ability levels, namely, a combination of two high-ability participants, one medium-ability participant, and one low-ability participant (“group1”), a combination of one high-ability participant, two medium-ability participants, and one low-ability participant (“group2”), and a combination of one high ability participant, one medium ability participant and two low ability participants (“group3”). The dependent variable was the correctness of the illusory collocation task.
In addition, personality traits and social comparison tendencies and effe- cts were also measured. The personality traits included the self-esteem scale, extraversion and neuroticism scale, where the self-esteem scale used the Rosenberg Self-Esteem Inventory (Rosenberg, 1965), and extraversion and neuroticism scale were measured using the “E”and “N”scales of the Eysenck Personality Inventory (Qian et al., 2000). The Chinese version of the Social Comparison Orientation Scale(INCOM) was used to measure social com- parison tendencies and evaluate individual differences in social comparison (Wang, Wang and Shi, 1991). The direction and effects of social comparison were measured using the Chinese version of the Social Comparison Effects
Scale, which measures the willingness to social comparison in four directi- ons: upward-identification, upward-contrast, downward-identification, and downward-contrast (Van der Zee et al., 2000).
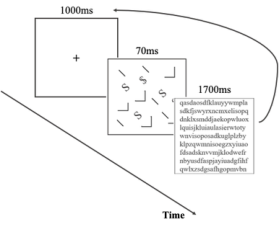
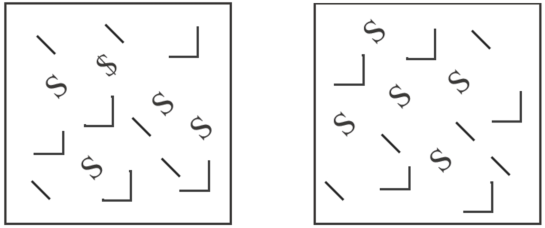
Material The experiment used the illusion ensemble task, including conjunctive item (Figure 2, left) or non-collocation item (Figure 2, right). Both items consisted of five diagonal lines, five right angles and five tilted letters “S”, with a tilted “$” replacing the letter “S” in the conjunctive item. The order of presenta- tion was randomized. For the single-experiment task (Figure 1), participants were first required to focus on the “+” in the center of the screen to eliminate the effects of the previous task and to allow them to concentrate on the pro- cessing of the stimulus interface (Van der Zee et al., 2000). After 1000ms of presentation of the gaze interface, the stimulus page was presented, and the stimulus page was last for 70ms, followed by the presentation of the judgment page, where the participant need to respond by pressing a key to indicate the presence (“F”) or absence of “$” (“J”). The judgment page consisted of a random arrangement of letters, which is not related to the experimental jud- gment task. The duration of the judgment page was 1700ms, and timeout was regarded as an error. The experimental software was run on a Dell 21-inch computer with the resolution of 1920*1080 and refresh rate of 60 Hz.
Figure 1: Process of the single task.Figure 2: Conjunctive item (left) and non-conjunctive item (right).
The Effect of Individual Ability Differences and Personality Traits 81
Procedure Participants were required to complete illusion ensemble tasks separately under individual and group work conditions. Each experimental phase inclu- des 100 trials (50 conjunctive items and 50 non-conjunctive items). Before the group task, each participant’s simulated performance was announced in the presence of all. After completing the group task, participants need to fill out personality trait questionnaires and social comparison-related questionnaires.
RESULT
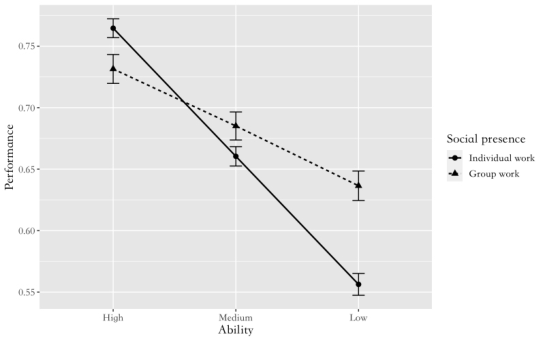
Effect of Individual Ability Level on Social Comparison Descriptive statistics of all participants’ performance on the illusory ensem- ble task are shown in Table 1. To verify the reasonableness of the individual ability classification, ANOVA was conducted on the indivi- dual performance of participants with different ability levels. Results showed a significant difference in participants’ performance with diffe- rent ability levels (F (2, 149) = 78.83, P < 0.001). Besides, there was a significant difference in performance across different work conditi- ons (t (149) = 15.99, P < 0.001). In addition, the individual ability level significantly moderated performance in different work conditions (F (2, 149) = 31.14, P < 0.001) (Figure 3). The group performance of high-ability participants was significantly lower than the individual perfor- mance (t (57) = 2.89, P = 0.005), while both medium-ability and low- ability participants showed elevated group performance relative to individual performance (medium-ability participants: t (52) = −2.18, P = 0.03; low-ability participants: t (52) = −6.93, P < 0.001). Furthermore, the per- formance improvement of low-ability participants was significantly higher than that of medium-ability participants (t (104) = 4.03, P < 0.001).
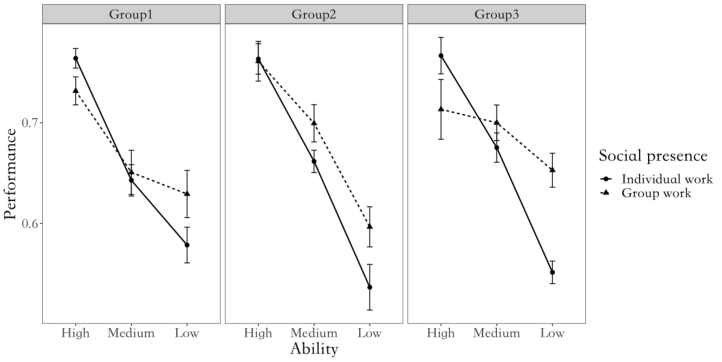
Effect of Combination of Ability Levels on Social Comparison The performance of participants in different work conditions among var- ying combinations of ability levels is shown in Figure 4. ANOVA results
Table 1. Descriptive statistics of illusory ensemble task performance.
Table available in the original PDF paper.
Combination of ability level
Individual ability level
Individual work performance
Group work performance
Performance change Group 1 High ability 0.76(0.05) 0.73(0.08) −0.032 Group 1 Medium ability 0.64(0.06) 0.65(0.08) 0.008 Group 1 Low ability 0.58(0.07) 0.63(0.09) 0.051 Group 2 High ability 0.76(0.05) 0.76(0.06) −0.002 Group 2 Medium ability 0.66(0.05) 0.70(0.08) 0.038 Group 2 Low ability 0.54(0.07) 0.60(0.06) 0.06 Group 3 High ability 0.77(0.07) 0.71(0.12) −0.053 Group 3 Medium ability 0.68(0.06) 0.70(0.07) 0.025 Group 3 Low ability 0.55(0.06) 0.65(0.09) 0.101
Note: Performance change is the difference between group work performance and individual work performance.
Figure 3: Performance of different ability level participants.Figure 4: Performance of different ability level participants in different groups.
showed a significant difference in the performance changes across varying combinations (F (2, 149) = 4.25, P = 0.016). For group 1, the group performance of the high-ability participants was significantly lower rela- tive to the individual performance (t (29) = 3.04, P = 0.005), while the group performance of the medium-ability participants was impro- ved but not significantly (t (13) = −0.34, P = 0.74), and the group performance of the low-ability participants was significantly improved (t (13) = −2.20, P = 0.047). For group 2, compared with individual performance, the group performance of high-ability participants was decrea- sed but not significantly (t (8) = 0.14, P = 0.89), the group performance of medium-ability and low-ability participants was significantly improved (medium-ability participants: t (17) = −2.13, P = 0.048; low-ability par- ticipants: t (8) = −7.68, P < 0.001). For group 3, the group performance of high-ability participants significantly decreased (t (14) = 2.59, P = 0.021),
The Effect of Individual Ability Differences and Personality Traits 83
whereas the group performance of medium-ability and low-ability partici- pants significantly increased (medium-ability participants: t (14) = − 2.24, P = 0.042; low-ability participants: (t (27) = −5.84, P < 0.001)). To determine whether there was a parallel comparison, the performance changes of same ability level participants in different groups were analy- sed (e.g., high-ability participants in group 1 and high-ability participants in groups 2 and 3). The results showed that there was a non-significant parallel comparison effect in high-ability participants (t (43) = 0.10, P = 0.92), and medium-ability participants (t (33) = −0.98, P = 0.35), but a significant parallel comparison effect in low-ability participants (t (49) = 2.10, P = 0.041), and the performance improvement of low-ability participants with parallel comparison effect (M = 0.101) was significantly higher than other low-ability participants (M = 0.054). The difference in total performance change between groups was significant (F (1, 162) = 7.56, P = 0.007), with the total performance change in group 1 being negative and significantly lower than group 2 (t (104) = − 2.53, P = 0.013) and group 3 (t (119) = −2.59, P = 0.011). Besides, total performance change in group 2 was not significantly lower than group 3 (t (99) = −0.27, P = 0.79).
Effect of Personality Traits on Social Comparison
Self-esteem had a significant effect on performance change under different work conditions (t (132) = −3.12, p = 0.04). Participants with high self- esteem scores had significantly lower performance change than those with low self-esteem scores (Mhigh self−esteem = 0.015, Mlow self−esteem = 0.045). Beside, neuroticism scores were positively but not significantly related to per- formance change in upward comparisons (r = 0.11, p = 0.41), while extroversion scores were positively but not significantly related to perfor- mance change in downward comparisons (r = 0.04, p = 0.78). The results of the Social Comparison Effect Scale showed the contrast effect was significantly higher than the identification effect both in the upward comparison (t (332) = −7.17, p < 0.001) and downward compari- son (t (321) = −2.063, p = 0.04). For high-ability participants, the downward-contrast effect was higher than the downward-identification effect but not significant (t (112) = −1.179, p = 0.24). For medium- ability participants, the downward-contrast effect was significantly higher than the upward-identification effect
Equation reproduced from the original PDF.
. This indicated that the contrast effect in the downward comparison played a major role in the performance enhancement of medium-ability participants. For low-ability participants, the results of subjective debriefing showed that the upward-identification effect was significantly lower than the upward- contrast effect
t (57) = −4.52, p < 0.01
, but the behavioral results sho- wed that low-ability participants significantly improved their performance in the experiment, which means upward-identification effect was stronger than upward-contrast effect. To further analyse the relationship between neuroti- cism and extraversion scores and social comparison effects, the correlation analysis between them is shown in Table 2, which revealed that neuroticism
Table 2. Correlation analysis between personality traits and social comparison effects.
was negatively correlated with the upward-identification effect and positively correlated with the upward-contrast and downward-identification effect; extraversion was positively correlated with the upward-identification effect and negatively correlated with the upward-contrast effect.
DISCUSSION
This study investigated the effects of individual ability level, combination of ability levels and personality traits on individual behavior in social compa- rison. While neuroticism and extraversion were related to the direction of social comparison, no significant correlation was found between personality traits and performance change, which may be associated with two oppo- site effects on performance following upward and downward comparisons. The results of the correlation analysis between the Social Comparison Effects Scale and personality traits indicated that participants with high neuroticism intention engaged in frequent upward comparisons and tended to produce contrast effects after comparisons. In addition, participants with high neuro- ticism also tended to have identification effects after downward comparisons. This is consistent with the finding that the high neuroticism group was more likely to produce negative emotions after comparisons. Surprisingly, extrover- sion was not found to be more inclined to downward comparisons; instead, they showed a solid tendency to upward comparisons and were more likely to produce identification effects after comparisons, which is consistent with findings from an experiment conducted by Karen et al. in cancer treatment patients (Van Der Zee et al., 1999), which may attribute to the fact that they were more likely to produce positive emotions after comparisons (VanderZee, Buunk and Sanderman, 1996).
From the result of the social comparison effect scale, participants preferred the contrast effect after comparison in both upward and downward compa- risons, but this was in contrast to the behavioural performance results of high-ability and low-ability participants. High-ability participants showed a decrease in performance after social comparison, which could result from a downward identification effect. In contrast, the low-ability participants showed a significant increase in performance after social comparison, which could result from an upward-identification effect. Besides, parallel compari- sons played a positive role in groups with multiple low-ability participants.
The Effect of Individual Ability Differences and Personality Traits 85
This contradiction between behavioral performance and subjective repor- ting may be due to a fundamental inconsistency in people’s accounts of their social comparison habits, reflecting their reluctance to acknowledge or pos- sibly their lack of awareness of their apparent involvement in comparisons (Hemphill and Lehman, 1991).
In the workgroup of this study, group 3 was the best combination, follo- wed by group 2, and group 1 was the least effective. The results indicated that the number of high-ability participants had no improvement effect and parallel comparison on performance, but rather a decrease in performance. However, the number of low-ability participants caused both parallel com- parison and upward-identification effect, which significantly contributed to the performance improvement. Since the performance improvement mainly originated from the downward-comparison effect for medium-ability par- ticipants, the increase of low-ability participants could also promote their performance improvement. Therefore, to improve the performance of the whole group, the number of high-ability participants in future work organiza- tion should be reasonable. Still, the number of medium-ability and low-ability participants could increase. Moreover, the influence of personality traits on social comparison should be considered to help achieve total performance improvement.
CONCLUSION
This study applied an illusion ensemble experiment to investigate individual ability differences and personality traits on social comparison. The results indicated that individual ability level significantly affected social comparison. The impact of work condition on individual performance was different for participants with varying levels of ability: the performance of high-ability par- ticipants significantly decreased, while both medium-ability and low-ability participants significantly increased, and low-ability participants had signi- ficantly higher performance improvement than medium-ability participants. Moreover, different combinations of ability levels significantly impacted par- ticipants’ individual behavior. Low-ability participants in the combination of one high-ability, one medium-ability, and two low-ability participants had the most significant improvement, which was the combined result of the upward identification and parallel comparison. Furthermore, personality traits pla- yed a crucial role in social comparison. Self-esteem had a significant effect on participation in social comparison. Participants with low self-esteem were more inclined to participate in social comparisons and changed sharply in individual performance relative to those with high self-esteem. In addition, neuroticism was associated with adverse effects caused by social compa- rison (e.g., upward-contrast effect and downward-identification effect). In contrast, extraversion was associated with positive effects induced by social comparison (e.g., upward-identification). Apart from this, social comparison propensity was positively associated with changes in individual performa- nce. Additionally, performance change in medium-ability participants may primarily come from the effect of the downward-contrast impact from the result of the social comparison effect scale. Based on the performance changes
across groups, an increment in the number of high-ability participants cau- sed a decrease in team performance, whereas an increment in the number of low-ability participants positively affected whole team performance. There- fore, group work organizations can improve team performance by increasing the number of low-ability members and reducing the number of high-ability members in future management.
ACKNOWLEDGMENT
This work was supported by the Natural Science Foundation of China under Grant 71771134 and 72171130.
REFERENCES
Dan, L. et al. (2009) ‘THE EFFECTS OF THE ACCESSIBILITY OF THE SOCIAL COMPARISON TARGETS ON THE OPERATE LEVEL’, Studies of Psychology and Behavior, 7(4), p. 295. Diel, K., Grelle, S. and Hofmann, W. (2021) ‘A Motivational Framework of
Social Comparison’, Journal of Personality and Social Psychology, 120(6), pp. 1415–1430. Available at: https://doi.org/10.1037/pspa0000204. Festinger, L. (1954) ‘A theory of social comparison processes’, Human relations, 7(2), pp. 117–140. Gibbons, F. X. and Buunk, B. P. (1999) ‘Individual differences in social comparison:
development of a scale of social comparison orientation.’, Journal of personality and social psychology, 76(1), p. 129. Hemphill, K. J. and Lehman, D. R. (1991) ‘Social Comparisons and their Affective Consequences: The Importance of Comparison Dimension and Individual Diffe- rence Variables’, Journal of Social and Clinical Psychology, 10(4), pp. 372–394. Available at: https://doi.org/10.1521/jscp.1991.10.4.372. Lockwood, P. and Kunda, Z. (1997) ‘Superstars and me: Predicting the impact of role
models on the self.’, Journal of personality and social psychology, 73(1), p. 91. Muller, D., Atzeni, T. and Butera, F. (2004) ‘Coaction and upward social comparison reduce the illusory conjunction effect: Support for distraction–conflict theory’, Journal of Experimental Social Psychology, 40(5), pp. 659–665. Available at: ht tps://doi.org/10.1016/j.jesp.2003.12.003. Qian, M. et al. (2000) ‘Development of the revised Eysenck personality questionnaire
short scale for Chinese (EPQ-RSC)’, Acta Psychologica Sinica, 32(03), p. 317. Rosenberg, M. (1965) ‘Rosenberg self-esteem scale (RSE)’, Acceptance and commitment therapy. Measures package, 61(52), p. 18. Schunk, D. H. and DiBenedetto, M. K. (2020) ‘Motivation and social cognitive
theory’, Contemporary Educational Psychology, 60, p. 101832. Available at: https://doi.org/10.1016/j.cedpsych.2019.101832. Seta, J. J. (1982) ‘The impact of comparison processes on coactors’ task performance.’, Journal of Personality and Social Psychology, 42(2), p. 281. Taylor, S. E., Wayment, H. A. and Carrillo, M. (1996) ‘Social comparison, self-
regulation, and motivation.’ Van der Zee, K. et al. (2000) ‘Social comparison and coping with cancer treatment’, Personality and Individual Differences, 28(1), pp. 17–34. Available at: https://doi.org/10.1016/S0191-8869(99)00045-8.
The Effect of Individual Ability Differences and Personality Traits 87
Van Der Zee, K. I. et al. (1999) ‘The Big Five and identification–contrast processes in social comparison in adjustment to cancer treatment’, European Journal of Per- sonality, 13(4), pp. 307–326. Available at: https://doi.org/10.1002/(SICI)1099- 0984(199907/08)13:4<307:: AID-PER342>3.0. CO;2-R. VanderZee, K., Buunk, B. and Sanderman, R. (1996) ‘The relationship between
social comparison processes and personality’, Personality and Individual Diffe- rences, 20(5), pp. 551–565. Available at: https://doi.org/10.1016/0191-8869(96) 00007-4. Wang M., Wang L. and Shi J. (1991) ‘Reliability and Vaiidatioa of the Social Comparison Orientation Scale’, Chinese Mental Health Journal [Preprint]. Available at: https://dx.doi.org/ (Accessed: 30 January 2023). Wayment, H. A. and Taylor, S. E. (1995) ‘Self-Evaluation Processes: Motives,
Information Use, and Self-Esteem’, Journal of Personality, 63(4), pp. 729–757. Available at: https://doi.org/10.1111/j.1467-6494.1995.tb00315.x. Wood, J. V. (1989) ‘Theory and research concerning social comparisons of personal attributes.’, Psychological bulletin, 106(2), p. 231.
LISTED IN THE AHFE DIGITAL BOOKSTORE CATALOGUE
Explore the complete digital volume
Social and Occupational Ergonomics
Read this individual research paper free through the original publisher, or explore the full digital proceedings book.
ISBN 978-1-958651-82-7
Explore this ISBN in the AHFE Bookstore ↗Listed in the July 2026 bookstore catalogue; search by ISBN to confirm current availability · Digital book purchase optional