Amina Ziegenbein, Joachim Metternich (2022). Data-based Quality Analysis in Machining Production: A Case Study on Sequencing Time Series for Classification. In: Intelligent Human Systems Integration (IHSI 2022): Integrating People and Intelligent Systems. AHFE Open Access, vol. 22. https://doi.org/10.54941/ahfe1001021
The introduction of AI applications is accelerated by an on-going development phase at present, creating a technology push. The application of machine learning methods not only in manufacturing research but also in manufacturing practice is still a growing field. Against a backdrop of increasingly volatile markets, highly customised products and increasingly complex production processes with consistently high-quality requirements, manufacturing is facing growing challenges. The rush of new providers of Industrial Internet of Things (IIoT) solutions and machine learning applications to the market is opening up new possibilities for data collection and analysis that go beyond the classic approach of model- and empirical-based process analysis and challenge traditional approaches to production management, such as lean management.However, at the value stream level, certain problems in lean production resulting from a lack of data can be addressed precisely with IIoT applications. As an extension to the challenges described, classic production tasks should be critically reviewed for their relevance. Reducing waste is one of the key principles in lean manufacturing for which data analytics can be used to increase labour productivity by either supporting or eliminating existing processes.We present the underlying goal of replacing one step in the value chain, the measurement of product quality, with the prediction of product quality using machine tool signals from the machining process. This idea has the potential for great cost reduction in manufacturing, especially if the use of existing data sources such as machine tool signals is sufficient as a data source. Although more data is being generated in companies than ever before, its potential can only be utilised if it is selected and analysed. Collecting high-quality data in machining practice often requires installing sensors and performing time-consuming data preparation steps. Given the sparse availability of useful data and the additional cost of new data sources, we use machine tools as data providers for machining processes.The advanced analytics goal derived from this business objective is the classification of time series, in particular strong sequence classification. Although there are several approaches to this classification problem, we opted for a feature vector-based approach, which has shown both potential and limitations in previous studies.In this case study, we demonstrate the potential of time series sequencing of machine tool control data for quality prediction. A comparison of optimised feature vector-based random forest classification models trained on different sequences of a real drilling time series database is conducted. The results suggest that while sequence length has a subordinate effect, sequence overlap offers great potential for effective classification without exhaustive feature engineering, which in practice is limited by computational constraints.
Intelligent Human Systems Integration (IHSI 2022): Integrating People and Intelligent Systems https://openaccess.cms-conferences.org/#/publications/book/978-1-7923-8988-7
INTRODUCTION
Increasing complexity in manufacturing is a phenomenon already described in 1994 (Wiendahl and Scholtissek 1994). (Teti and Kumara 1997) mention the potential of introducing artificial intelligence (AI) to manage self-same. However, considering the waves of AI development (Zhang et al. 2019) indicating phases of minor and major relevance, the introduction of AI applications is currently accelerated by an ongoing development phase creating a technology push. Applying ma-chine learning methods not only in manufacturing research but in industrial practice is still a growing field (Fahle et al. 2020). Against the background of increasingly volatile markets, very customer−specific products and more complex production processes with constantly high quality requirements, machining faces growing challenges (Spath et al. 2013). The rush of new providers of Industrial Internet of Things (IIoT) solutions and machine learning applications onto the market open up new possibilities for data acquisition and analysis that go beyond the traditional approach of model- and empirical-based process analysis (Du Preez and Oosthuizen 2019). In the light of the challenges and potential described, traditional production tasks should be critically reviewed for their relevance. Reducing waste is one of the main principles in lean production for which data analysis can be utilised to in-crease labour productivity (Malavasi and Schenetti 2017), either in supporting or eliminating existing processes. Hence our underlying goal is to replace one step of the value chain, product quality measurement, by predicting product quality through machine tool control signals gained during the machining process. This approach has the potential for great cost reduction in manufacturing. While there are various devices for data acquisition offered (Lenz et al. 2018), the utilisation of machine tool control data bears certain advantages, i e. no need for synchronisation of different sources and no reduced machining space (Girardin et al. 2010). The potential of data in this use case can only be assessed by pre-studies (Cai and Zhu 2015), requiring the investment in data acquisition tools. The advanced analytics objective de-rived from this business goal is time series classification, particularly strong sequence classification based on the definition in (Xing et al. 2010). While there are several approaches for this classification problem, we choose a feature vector-based approach, which showed potential and limitations in previous studies (Ziegenbein et al. 2020). Here, we investigate the influence of different sequencing choices in feature vector−based time series classification of machine tool signal data of a drilling process. We suggest a method for pre-liminary data set assessment based on feature importance. In section 2 we describe the method and material of this study. The results are presented in section 3. Section 4 discusses and concludes this paper.
MATERIAL AND METHOD While the decision on how to sequence time series data to generate meaningful feature vectors is due early in the data mining process, the effect of this choice is measured
Intelligent Human Systems Integration (IHSI 2022): Integrating People and Intelligent Systems https://openaccess.cms-conferences.org/#/publications/book/978-1-7923-8988-7 by model evaluation, which is computationally expensive. Therefore, we evaluate slicing strategies by computing feature importance as a metric. This approach is then validated by model evaluation of certain samples.
In this section we describe the systematic approach to find a slicing strategy, the underlying technical production process to generate a data set, the experimental design, and the validation strategy.
Approach The objective of this study is to find a slicing strategy with two rivalling goals: To maintain explanatory value while reducing data set size and computing effort. For this, two parameters are considered: (1) section width (𝑅) and (2) section shift (𝑆). Section width describes the amount of data points included in each section. Shift describes the number of data points by which each data window is shifted to form a new section. We conduct a design of experiment, a method to optimise parameter settings with reduced experimental effort (Siebertz et al. 2017) and define 𝑅 and 𝑆 as factors with three levels (−, 0, +). To evaluate the effect of each sequence setting, we calculate features for each section, test and compare feature relevance as well as computing time. The results are weighted to derive a utility value for each set. To provide a sufficient sample size, we draw 60 random time series data sets for each experimental setting. To achieve statistical evidence, this process is repeated 30 times with new samples each. To validate this approach, three representative settings (lowest explanatory value, high time-efficiency, and highest utility value) are used as a basis for machine learning classifiers and evaluated accordingly. Each inducer is trained on a sample of 1000 similar time series. For model comparison, a train-test split of 80% - 20% is chosen and each trained model is evaluated by accuracy, to measure bias, and generalisation error, to measure variance. This is repeated 30 times with a random split, resulting in n=30 results per set for evaluation.
Drilling Process and Labelling The data base to detect faulty bores through machine learning rather than coordinate measurement, requires a certain data quality, which can be defined as fitness for use (Wand and Wang 1996). We aim for a large proportion of rejects in the data set for testing purposes, which requires a process that is not capable according to (Dietrich and Schulze 2009). The experimental design therefore is based on the following considerations.
Scope. Boreholes allow to generate many similar data sets with little material consumption. Preliminary tests have shown that very different data sets can be generated even with similar processes (Ziegenbein et al. 2020).
Simplicity. Identical material and process setting for each sample allow to reduce influencing factors and enhance data representation in small data. The material
Intelligent Human Systems Integration (IHSI 2022): Integrating People and Intelligent Systems https://openaccess.cms-conferences.org/#/publications/book/978-1-7923-8988-7 chosen is a CrMo-alloyed quenched and tempered steel (1.7225) with a strength of 900 −1200 N m2 which has a wide range of applications in industry (Thyssenkrupp Hohenlimburg GmbH 2019).
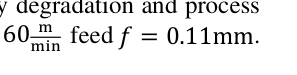
Process Stability. A trade-off between measurable quality degradation and process stability is required. The bores are cut with a speed of 𝑣𝑐= 60 m
Equation reproduced from the original PDF.
Data Characteristics Machine tool control data is dense tabular time series data. The rate of missing values is about 0.02-0.4 %. These missing instances can be interpolated based on process knowledge. Since data acquisition is costly and time intensive, experimental data sets are small compared to other domains, bioinformatics for instance. The amount of noise in the data set cannot easily be assessed (Wheway 2001). A time series decomposition provides insights to safely assume that the data is noisy. However, data repair or filtering techniques bear the risk of introducing different properties, as discussed in data base research (i. a. (Afrati and Kolaitis 2009; Chomicki and Marcinkowski 2005; Fagin et al. 2015)). Since removing noise could remove class related information from the data set, no such steps are taken.
Experimental Design To address our research question, we first define our factor levels, then we slice the time series accordingly using a sample size of 30 bores of each class, drawing balanced samples. We generate nine features from each signal section, measuring time consumption. We chose an univariate approach to test feature importance for each feature individually, utilising (Christ et al. 2017). Within this software package, measures against increased error rates in multiple hypothesis testing (i. a. (Shaffer 1995; Savin 1984)) are implemented as described in (Benjamini and Yekutieli 2001).To achieve statistical evidence, this process is repeated 30 times with new samples each. The factor settings are summarised in Table 1.
Section width. The lower bound is defined by the smallest period length of the time series, the revolution (𝑈≈50𝐻𝑧 ), which results in ten data points. The largest possible section is one bore sequence. However, since this violates the instance by dimension 𝐼
𝑑≥10 ratio suggested by (Jain and Chandrasekaran 1982), we chose a width that is within this boundary. We generate nine features for each of the 𝑑= 22 signals, which results in 𝐼≥3960 for balanced binary classes and a maximal section width of 118 data points.
Overlap. The smallest overlap is zero, the maximal overlap is a shift by one data point.
Intelligent Human Systems Integration (IHSI 2022): Integrating People and Intelligent Systems https://openaccess.cms-conferences.org/#/publications/book/978-1-7923-8988-7
Table 1. Factor Settings Setting
Table available in the original PDF paper.
Factor Symbol − ○ + Unit Width R 2 60 118 Data points Overlap S R R/2 1 Data points Model and Hyperparameter Tuning
The choice of an inducer algorithm is influenced by both the task at hand and implications for practical use. The algorithm chosen must be applicable to the described data set characteristics. While there are many algorithms arguably applicable, several comparative studies found random forest builds to perform very well (i. a. (Niculescu-Mizil and Caruana 2005; Caruana and Niculescu-Mizil 2006; Caruana et al. 2008; Kotsiantis 2013)). A random forest is a good fit for the underlying data set characteristics as it is not prone to noisy data and performs well on both smaller and larger data sets, considering our study covering a fairly large range of sizes. (Breiman 2001) Choosing an ensemble learner rather than a decision tree mitigates overfitting on smaller data sets through the introduction of a random element. The ensemble consists of decision trees based on C4.5 as introduced by (Quinlan 1987), chosen due to fitting pruning rules. Bootstrapping is used to build the trees; impurity is measured by the Gini index.
In our two-dimensional search space, a full search is not a feasible choice due to its time complexity (see (Moshkov 2005) for complexity analysis in decision trees). Partial search algorithms showed promise in research, where random search outperformed grid search (Bergstra and Bengio 2012). Bayes optimisation enhances this idea by restricting the search space based on an assumption for areas of interest (Pelikan et al. 1999). This optimisation strategy gained interest in recent time due to its wide range on application areas, performance and customisability as (Shahriari Bobak et al. 2016) describe in their overview. In our study, we use a bayes search with gaussian a priori distribution, that is stratified fivefold cross validated. We chose a search space of (5, 15) for tree depth and (5, 500) for forest size. The packages sklearn (Pedregosa et al. 2011) and skopt (Head et al. 2020) are utilised as a basis for implementation.
Evaluation Strategy The issues in comparing machine learning algorithms are thoroughly discussed in (Dietterich 1998). While a tenfold cross validation and accuracy scores are commonly used in research (Kohavi and others 1995), there is ongoing debate in literature concerned with the ideal metric (i. a (Delgado and Tibau 2019; Hossin and Sulaiman 2015; Powers 2015; Sokolova et al. 2006)), and sampling strategy (i. a. (Alpaydin 1999; Varoquaux 2018; Varma and Simon 2006)) for model evaluation. Since we compare identical inducers on data sets of different properties, we chose to
Intelligent Human Systems Integration (IHSI 2022): Integrating People and Intelligent Systems https://openaccess.cms-conferences.org/#/publications/book/978-1-7923-8988-7 train each model on a subset of 80% of a 1000 bores balanced data set and test it on 20%, calculating classifier accuracy (correctly classified elements by all elements (Forsyth 2019)), and error rate (err = 1 −acc). Training is repeated 30 times for each model to generate a larger basis for evaluation.
RESULTS
The results of our preliminary study suggest a negative correlation between explanatory value and 𝑅, but a positive correlation for 𝑆. The effect for 𝑆 is larger by a factor of about six. The results of the preliminary study are summarised in Table 2, sorted by utility value. The weights of the target variables are determined by pairwise comparison in a preference matrix. Dimensionality, instances, explanatory value, and time consumption are considered.
Table 2. Results Design of Experiment
Table available in the original PDF paper.
Experiment
Mean amt. rel. features Time consumption [s] Instances per bore Utility value R−S+ 146.03 8.38 2361 76.18 R○S+ 157.57 8.72 2311 74.58 R+S+ 157.90 8.96 2253 72.71 R−S○ 128.13 1.78 473 15.40 R−S− 111.63 1.07 237 7.78 R○S○ 113.83 0.72 78 2.66 R○S− 94.37 0.59 39 1.38 R+S− 58.70 0.55 20 0.72 Validation. These results are based on the assumption, that the number of relevant features, calculated through hypothesis testing is a measure for explanatory value in each data set. However, there are various strategies for feature selection, both for univariate and multivariate data sets. This approach was chosen based on computational considerations and applicability early in the machine learning process. However, the reliability of this assumption must be validated. Therefore, we pick three representative slicing settings, (Table 2, bold; highest utility value, time- efficient trade-off, and lowest utility value○) as a basis for training. The models are trained with a maximal tree depth of 15 leaves and 500 estimators. The results are summarised in Table 3. A high generalisation error for set R+S− suggests overfit on the training data. Lower error scores for set R−S+ compared to R−S○ suggest a lower variance, reflecting the trade-off between variance and bias in model training.
Intelligent Human Systems Integration (IHSI 2022): Integrating People and Intelligent Systems https://openaccess.cms-conferences.org/#/publications/book/978-1-7923-8988-7
Table 3: Results model evaluation, n=30 Train accuracy Test accuracy generalisation error
DISCUSSION AND FUTURE RESEARCH The evaluation results suggest that explanatory value of a data set can be measured by univariate feature importance testing. R−S+ and R−S○ provided a similar number of relevant features and the associated models performed similarly well. The weight of time consumption to calculate the utility value resulted in a considerably low utility value for R−S○, however a reduced data preparation time by a factor of four may be of great interest in real-time applications or when dealing with larger data sets. It is worth mentioning, that model complexity has a great influence on model performance on larger data sets. Restricting the search space for hyperparameter tuning, may result in weaker performance. As discussed briefly, the choice of model evaluation strategy should reflect the underlying machine learning goal if applied in practice, as a specialised metrics aim to highlight certain model properties.
This case study shows promise in terms of both, time series slicing and an efficient approach to evaluate input data at an early stage. However, we only considered one type of data and one type of inducer algorithm. Since early-stage evaluation is of great interest in machine learning applications in practice and narrows the search space for following steps, it is worth to further investigate this approach, for example conducting a benchmark of different feature importance metrics and inducer algorithms.
Since the behaviour of imbalanced data is of high interest from an industrial perspective, but cannot be extrapolated, this is a topic for future research.
ACKNOWLEDGMENTS
Extensive calculations on the Lichtenberg high-performance computer of the Technical University Darmstadt were conducted for this research. The authors would like to thank the Hessian Competence Center for High Performance Computing – funded by the Hessian State Ministry of Higher Education, Research, and the Arts – for helpful advice.
Intelligent Human Systems Integration (IHSI 2022): Integrating People and Intelligent Systems https://openaccess.cms-conferences.org/#/publications/book/978-1-7923-8988-7
REFERENCES Afrati, Foto N./Kolaitis, Phokion G. (2009). Repair checking in inconsistent databases: algorithms and complexity. In: Proceedings of the 12th International Conference on Database Theory, 31–41. Alpaydin, E. (1999). Combined 5 x 2 cv F test for comparing supervised classification
learning algorithms. Neural computation 11 (8), 1885–1892. https://doi.org/10.1162/089976699300016007. Benjamini, Yoav/Yekutieli, Daniel (2001). The control of the false discovery rate in multiple testing under dependency. Annals of statistics, 1165–1188. Bergstra, James/Bengio, Yoshua (2012). Random search for hyper-parameter optimization.
Journal of machine learning research 13 (2). Breiman, Leo (2001). Random forests. Machine learning 45 (1), 5–32. Cai, Li/Zhu, Yangyong (2015). The challenges of data quality and data quality assessment in the big data era. Data science journal 14. Caruana, Rich/Karampatziakis, Nikos/Yessenalina, Ainur (2008). An Empirical Evaluation
of Supervised Learning in High Dimensions. In: Proceedings of the 25th International Conference on Machine Learning. New York, NY, USA, Association for Computing Machinery, 96–103. Caruana, Rich/Niculescu-Mizil, Alexandru (2006). An empirical comparison of supervised learning algorithms. In: William Cohen (Ed.). Proceedings of the 23rd international conference on Machine learning, the 23rd international conference, Pittsburgh, Pennsylvania, 6/25/2006 - 6/29/2006. New York, NY, ACM, 161–168. Chomicki, Jan/Marcinkowski, Jerzy (2005). Minimal-change integrity maintenance using
tuple deletions. Information and Computation 197 (1-2), 90–121. Christ, Maximilian/Braun, Nils/Neuffer, Julius (2017). tsfresh: Time Series Feature extraction based on scalable hypothesis tests. Available online at https://github.com/blue-yonder/tsfresh. Delgado, Rosario/Tibau, Xavier-Andoni (2019). Why Cohen’s Kappa should be avoided as
performance measure in classification. PloS one 14 (9), e0222916. Dietrich, Edgar/Schulze, Alfred (2009). Statistische Verfahren zur Maschinen- und Prozessqualifikation. Mit 61 Tabellen. 6th ed. München, Hanser. Dietterich (1998). Approximate Statistical Tests for Comparing Supervised Classification
Learning Algorithms. Neural computation 10 (7), 1895–1923. https://doi.org/10.1162/089976698300017197. Du Preez, Anli/Oosthuizen, Gert Adriaan (2019). Machine learning in cutting processes as enabler for smart sustainable manufacturing. Procedia Manufacturing 33, 810–817. https://doi.org/10.1016/j.promfg.2019.04.102. Fagin, Ronald/Kimelfeld, Benny/Kolaitis, Phokion G. (2015). Dichotomies in the complexity
of preferred repairs. In: Proceedings of the 34th ACM SIGMOD-SIGACT-SIGAI Symposium on Principles of Database Systems, 3–15. Fahle, Simon/Prinz, Christopher/Kuhlenkötter, Bernd (2020). Systematic review on machine learning (ML) methods for manufacturing processes- Identifying artificial intelligence (AI) methods for field application. Procedia CIRP 93, 413–418. Forsyth, David (2019). Applied Machine Learning. Girardin, François/Rémond, Didier/Rigal, Jean-François (2010). Tool wear detection in
milling—An original approach with a non-dedicated sensor. Mechanical Systems and Signal Processing 24 (6), 1907–1920. Head, Tim/Kumar, Manoj/Nahrstaedt, Holger/Louppe, Gilles/Shcherbatyi, Iaroslav (2020).
scikit-optimize/scikit-optimize. Zenodo.
Intelligent Human Systems Integration (IHSI 2022): Integrating People and Intelligent Systems https://openaccess.cms-conferences.org/#/publications/book/978-1-7923-8988-7
Hossin, Mohammad/Sulaiman, Md Nasir (2015). A review on evaluation metrics for data classification evaluations. International journal of data mining & knowledge management process 5 (2), 1. Jain, A. K./Chandrasekaran, B. (1982). 39 Dimensionality and sample size considerations in
pattern recognition practice. In: Classification Pattern Recognition and Reduction of Dimensionality. Elsevier, 835–855. Kohavi, Ron/others (1995). A study of cross-validation and bootstrap for accuracy estimation and model selection. In: Ijcai, 1137–1145. Kotsiantis, S. B. (2013). Decision trees: a recent overview. Artificial Intelligence Review 39
(4), 261–283. https://doi.org/10.1007/s10462-011-9272-4. Lenz, Juergen/Wuest, Thorsten/Westkämper, Engelbert (2018). Holistic approach to machine tool data analytics. Journal of Manufacturing Systems 48, 180–191. https://doi.org/10.1016/j.jmsy.2018.03.003. Malavasi, Mila/Schenetti, Gabriele (2017). Lean Manufacturing and Industry 4.0: an
empirical analysis between Sustaining and Disruptive Change. Moshkov, Mikhail Ju. (2005). Time Complexity of Decision Trees. In: David Hutchison/Takeo Kanade/Josef Kittler et al. (Eds.). Transactions on Rough Sets III. Berlin, Heidelberg, Springer Berlin Heidelberg, 244–459. Niculescu-Mizil, Alexandru/Caruana, Rich (2005). Predicting Good Probabilities with
Supervised Learning. In: Proceedings of the 22nd International Conference on Machine Learning. New York, NY, USA, Association for Computing Machinery, 625–632. Pedregosa, F./Varoquaux, G./Gramfort, A./Michel, V./Thirion, B./Grisel, O./Blondel, M./Prettenhofer, P./Weiss, R./Dubourg, V./Vanderplas, J./Passos, A./Cournapeau, D./Brucher, M./Perrot, M./Duchesnay, E. (2011). Scikit-learn: Machine Learning in Python. Journal of machine learning research 12, 2825–2830. Pelikan, Martin/Goldberg, David E./Cantú-Paz, Erick/others (1999). BOA: The Bayesian
optimization algorithm. In: Proceedings of the genetic and evolutionary computation conference GECCO-99, 525–532. Powers, David M. W. (2015). What the F-measure doesn't measure: Features, Flaws, Fallacies and Fixes. arXiv preprint arXiv:1503.06410. Quinlan, J.R. (1987). Simplifying decision trees. International Journal of Man-Machine
Studies 27 (3), 221–234. https://doi.org/10.1016/S0020-7373(87)80053-6. Savin, Nathan E. (1984). Multiple hypothesis testing. Handbook of econometrics 2, 827–879. Shaffer, Juliet Popper (1995). Multiple hypothesis testing. Annual review of psychology 46 (1), 561–584. Shahriari Bobak/Swersky Kevin/Wang Ziyu/Adams Ryan P./de Freitas Nando (2016).
Taking the Human Out of the Loop: A Review of Bayesian Optimization. Proceedings of the IEEE 104 (1), 148–175. https://doi.org/10.1109/JPROC.2015.2494218. Siebertz, Karl/van Bebber, David/Hochkirchen, Thomas (2017). Statistische Versuchsplanung. Design of Experiments (DoE). 2nd ed. Berlin, Heidelberg, Vieweg. Sokolova, Marina/Japkowicz, Nathalie/Szpakowicz, Stan (2006). Beyond Accuracy, F-Score
and ROC: A Family of Discriminant Measures for Performance Evaluation. In: Abdul Sattar/Byeong-ho Kang (Eds.). AI 2006: advances in artificial intelligence. 19th Australian Joint Conference on Artificial Intelligence, Hobart, Australia, December 4- 8, 2006 ; proceedings. Berlin, Springer, 1015–1021. Spath, Dieter/Ganschar, Oliver/Gerlach, Stefan/Hämmerle, Moritz/Krause, Tobias/Schlund, Sebastian (2013). Produktionsarbeit der Zukunft-Industrie 4.0. Fraunhofer Verlag Stuttgart.
Intelligent Human Systems Integration (IHSI 2022): Integrating People and Intelligent Systems https://openaccess.cms-conferences.org/#/publications/book/978-1-7923-8988-7
Teti, R./Kumara, S. R. T. (1997). Intelligent Computing Methods for Manufacturing Systems.
CIRP Annals 46 (2), 629–652. https://doi.org/10.1016/S0007-8506(07)60883-X. Thyssenkrupp Hohenlimburg GmbH (2019). Produktinformation für warmgewalztes Mittelband aus Hohenlimburg. Varma, Sudhir/Simon, Richard (2006). Bias in error estimation when using cross-validation
for model selection. BMC bioinformatics 7 (1), 1–8. Varoquaux, Gaël (2018). Cross-validation failure: small sample sizes lead to large error bars.
Neuroimage 180, 68–77. Wand, Yair/Wang, Richard Y. (1996). Anchoring data quality dimensions in ontological foundations. Communications of the ACM 39 (11), 86–95. Wheway, Virginia (2001). Using Boosting to Detect Noisy Data. In: G. Goos/J. Hartmanis/J.
van Leeuwen et al. (Eds.). Advances in Artificial Intelligence. PRICAI 2000 Workshop Reader. Berlin, Heidelberg, Springer Berlin Heidelberg, 123–130. Wiendahl, H.-P./Scholtissek, P. (1994). Management and Control of Complexity in Manufacturing. CIRP Annals 43 (2), 533–540. https://doi.org/10.1016/S0007- 8506(07)60499-5. Xing, Zhengzheng/Pei, Jian/Keogh, Eamonn (2010). A brief survey on sequence
classification. ACM SIGKDD Explorations Newsletter 12 (1), 40–48. Zhang, Xianyu/Ming, Xinguo/Liu, Zhiwen/Yin, Dao/Chen, Zhihua/Chang, Yuan (2019). A reference framework and overall planning of industrial artificial intelligence (I-AI) for new application scenarios. The International Journal of Advanced Manufacturing Technology 101 (9), 2367–2389. https://doi.org/10.1007/s00170-018-3106-3. Ziegenbein, Amina/Fertig, Alexander/Metternich, Joachim/Weigold, Matthias (2020). Data-
based process analysis in machining production: Case study for quality determination in a drilling process. Procedia CIRP 93, 1472–1477. https://doi.org/10.1016/j.procir.2020.03.063.
Intelligent Human Systems Integration (IHSI 2022): Integrating People and Intelligent Systems https://openaccess.cms-conferences.org/#/publications/book/978-1-7923-8988-7
LISTED IN THE AHFE DIGITAL BOOKSTORE CATALOGUE
Explore the complete digital volume
Intelligent Human Systems Integration (IHSI 2022): Integrating People and Intelligent Systems
Read this individual research paper free through the original publisher, or explore the full digital proceedings book.
ISBN 978-1-7923-8988-7
Explore this ISBN in the AHFE Bookstore ↗Listed in the July 2026 bookstore catalogue; search by ISBN to confirm current availability · Digital book purchase optional