Edisson Pugo-Mendez, Luis Serpa-Andrade (2022). Development of a platform based on artificial vision with SVM and KNN algorithms for the identification and classification of ceramic tiles. In: Artificial Intelligence and Social Computing. AHFE Open Access, vol. 28, pp. 173–181. https://doi.org/10.54941/ahfe1001460
1 Research Group on Artificial Intelligence and Assistive Technologies–GIIATa
2 Research Group on Artificial Intelligence and Assistive Technologies–GIIATa; Research Group on Applied Embedded Hardware–GIHEA, Universidad Politécnica Salesiana Cuenca, Ecuador ↗
In the ceramic tile manufacturing industry, the quality of production achieved depends to a large extent on the quality of the tile, which is very important for its classification and price. Currently, this process is performed by human operators, but many industries aim to improve performance and production through automation of this process. In this work, we present the development of a platform based on an artificial vision that allows the identification of defects in ceramic tiles, so that we can classify them according to their quality. The algorithms chosen to develop the platform are Support Vector Machine (SVM) and K-Nearest Neighbor (KNN). In order to implement these algorithms, the images are preprocessed, the descriptors for defect detection are obtained, then the algorithms are used and the results obtained
The quality of the final product determines the future of the industry, and only an objective and strict inspection can guarantee the best product qua- lity (Oh et al. 2020). The combination of automatic inspection systems in industry (machine vision) (Onita et al. 2018; Feng et al. 2019)aims to use the knowledge base to collect the information needed to determine if the product is within the correct range of parameters. These robust systems, can operate in real time on the production line, provide deterministic results and can be used in environments that are harmful to humans (radiation, temperature, toxic substances (Jiang, Wang & Zhao 2019).
The successful implementation of the automated visual inspection system is based on: application rationality, system efficiency and system performance considerations (considering integration capabilities, robustness, ease of use and capabilities including intelligence), adaptation to existing environmental
conditions, image acquisition dependence on quality and resolution, produ- ction line performance, image preprocessing technology and image analysis related options (Aslam et al. 2019).
The quality control of ceramic tile manufacturing is accomplished in an environment that is not suitable for the operators, as they will be affected by high levels of noise, dust, extreme temperatures (Hocenski, Mati´c & Vidovi´c 2016). Generally speaking, the production lines in these industries have a high degree of automation (Shire, Khanapurkar & Mundewadikar 2011; Hanzaei, Afshar & Barazandeh 2017), but quality control is still executed by the opera- tors. In this sense, a person’s ability to perform this process depends on his or her training, knowledge and experience, and can also lead to misclassification of products affected by fatigue and subjectivity (Najafabadi & Pourghassem 2011; Singh & Kaur 2012). In previous work, there are methods for detecting image defects, but with some limitations (Shire et al. 2011), for edge detection as in Naja- badi’s work, the angle method is used by comparing them to know which ceramic is defective in edges and dimensions (Najafabadi & Pourghassem 2011) An investigation of the existing methods for the detection of defects by means of artificial vision was carried out, which can be seen in the work of Pugo-Mendez E (Pugo-Mendez & Serpa-Andrade 2021).
The article is organized as follows: in section 2 related works, in section 3 the methodology, in section 4 results and discussion, in section 5 the conclusions and in section 6 the references.
RELATED WORKS The production of ceramic tiles is a complex process in stages: preparation of the material, followed by milling with the mixing of the material, conti- nuing this process by pressing to obtain a tile for subsequent decoration, then firing it in a kiln at high temperatures to obtain the final product, to finish the manufacturing process the last stage is the classification and packaging of the ceramic tiles (Pugo-Mendez & Serpa-Andrade 2021). Most of the tile manu- facturing process is automated except for the final stage of classification, in which a worker is in charge of detecting tile defects and classifying them by class: first, second, third and discarded (Pugo-Mendez & Serpa-Andrade 2021). Workers who perform tile classification tend to make errors in the process either due to fatigue or inattention, as well as they may not match the criteria for classification resulting in misclassification (Pugo-Mendez & Serpa-Andrade 2021).
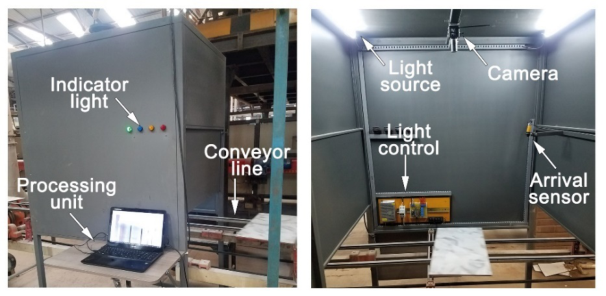
As can be seen in Fig. 1, there is the platform developed by means of arti- ficial vision, the operation of which will be described in the methodology section below.
METHODOLOGY
The present work proposes to develop a platform to detect ceramic defects and their respective classifications. Defects in tiles can occur in any of the production phases, from the beginning to the final phase of the process. In
Development of a Platform Based on Artificial Vision 175
Figure 1: Artificial vision based platform model.
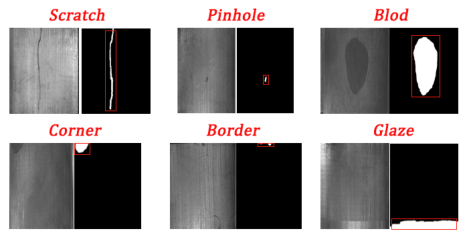
this work we intend to detect 6 types of defects that may be present in the manufacture of the tiles (Pugo-Mendez & Serpa-Andrade 2021):
Scratch: tile breakage
Pinhole: scattered isolated black-white spot
Blob: drop on the tile surface
Corner: corner break
Border: edge breakage
Glaze: blurred surface on tile The platform was developed with the implementation of artificial vision through Support Vector Machine (SVM) and K-Nearest Neighbor (KNN) algorithms for the detection of the ceramic defects mentioned above and their respective classifications, which will be done through a camera for the acqui- sition of images, for these to be optimal, it will be necessary to perform a protocol of data acquisition, frame adjustment, lighting, image preproces- sing to obtain the defects of the ceramics and thus be able to do the training using the SVM and KNN algorithms, for which the analysis of the behavior of the platform in the detection and classification of ceramics will be perfor- med (Pugo-Mendez & Serpa-Andrade 2021). The algorithms to be used are Support Vector Machine (SVM) and K-Nearest Neighbor (KNN).
Support Vector Machine (SVM) The support vector machine classifier is a method used in the development of a hyperplane or set of hyperplanes in high quarter or unlimited dimension, which can be used for classification, or other work. Intuitively, good sepa- ration can be achieved by using the hyperplane that has the largest distance to the nearest training data point of each class (called the functional mar- gin), because generally the larger the margin, the smaller the overall error of the classifier. However, the best separation area not only separates the data, but also has the largest margin (Nirsal et al. 2021; IEEE Centro Occidente Section & Institute of Electrical and Electronics Engineers no date).
176 Pugo-Mendez and Serpa-Andrade
The data in this margin area is called the support vector. Two classes can be separated by a pair of margin areas that are parallel. The first margin area bounds the first class while the second margin area bounds the second class, thus obtaining: xi.W + b ≥+1 f or yi = +1 (1)
Equations and mathematical formulas are available in the original paper PDF.
K-Nearest Neighbor (KNN) The KNN algorithm is one of the most famous classification algorithms used to predict the class of a record or (sample) with unspecified class based on the class of its neighboring records. The algorithm consists of three steps, as fol- lows (Kuhkan 2016; IEEE Centro Occidente Section & Institute of Electrical and Electronics Engineers no date):
Calculate the distance of the input record with respect to all training records. Sorting of training records based on distance and selection of the nea- rest neighbor. Using the class that has the most among the k nearest-nearest neighbors (this method considers the class as the class of the input record that is observed more than all other classes among the K nearest neighbors) (Kuhkan 2016; IEEE Centro Occidente Section & Institute of Electrical and Electronics Engineers no date). In general, to predict the class of a new record, the algorithm searches for similar records among the training dataset, so if the records have n attributes, then it will consider them as a vector in an n- dimensional space and predict the class label of the new record based on a distance criterion in this space, such as the Euclidean distance, as well as the class label of the neighboring records (Kuhkan 2016; IEEE Centro Occidente Section & Institute of Electrical and Electronics Engineers no date). The clas- sifier assumes the distance of the records from each other as a criterion of their proximity and selects the most similar records. There are numerous methods for calculating the distance, such as the Euclidean distance function, Manh- attan, etc., among which the Euclidean distance function is one of the most common, defined as Equation (4) (Kuhkan 2016; IEEE Centro Occidente Section & Institute of Electrical and Electronics Engineers no date).
(x1i −x2i)2 (4)
One of the most important parameters in the KNN algorithm is the value of K; in fact, there is no exact value for k and its appropriate amount depends on the distribution of the data and the problem space (Kuhkan 2016; IEEE Centro Occidente Section & Institute of Electrical and Electronics Engineers no date).
Development of a Platform Based on Artificial Vision 177
Acquisition Preprocessing and Segmentation of Imagines The first stage in the detection of defects and the classification of ceramics is through the acquisition of images the same that is obtained from the plat- form this was implemented in the Rialto ceramics in a production line. For the development of the preprocessing was performed by samples of defects and also with the knowledge of experts in the classification of ceramics according to their criteria, to all images should be applied the color change to grayscale for better segmentation of defects in ceramics, so also for better performance of the algorithm the images are sized to 200 by 200 pixels. For segmentation is performed using the U-Net algorithm (Ronneberger, Fischer & Brox no date), it obtains the area of interest through the knowledge that the experts have for each of the defects presented by the ceramics, being able to repre- sent and describe each of them, thus also a knowledge base of the defects is created with a class of each of them to be able to perform the training of the algorithms.
Recognition and Classification Once obtained the recognition of each of the defects of the ceramics, we proceed to perform the training of the SVM and KNN algorithms taking into account that for each of the defects we have a class and also a class with which the ceramics do not have defects, the universe of data for the adjustment of the algorithms is 1800 images, The training was developed using the Tenserflow tool, Scikit Learn and keras, with which the training of the algorithms is performed with 70% of data for training and 30% for validation. For SVM classification was used with the sigmoid kernerl, in the KNN method the number of nearest neighbors was k = 7 with the calculation of the Euclidean distance.
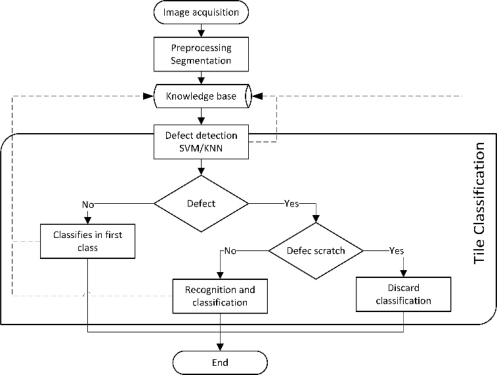
In the classification is done with the criteria that the company handles that are for the first class are those ceramics that do not exceed 9% of defects, for the second class are those that do not exceed 21% of defects, for the third class are those that do not exceed 52% of defects and for the discard ceramics are those that have greater defects to the percentage of 52%, it should be noted that when the defect is rupture this ceramic will be classified as discard. Our algorithm can be seen in simplified form in the flowchart in Fig. 2.
RESULTS AND DISCUSSION
We proceed to train the algorithms with the database obtained for each of the defects that the ceramics have in order to obtain the results of each of these as shown in Table 1.
Real Case Pronostical Total Defect Normal Defect True Positive VP False Positives FN Total Actual Positives TPR Normal False Negatives FP
True Negative VN
Grand Total
Total Actual Denials TNR TOTAL Total Positives Forecast TPP
Total Negatives Forecast TNP
In order to evaluate the performance of the classifier used, the confusion matrix, which is a standard statistical model evaluation tool, is employed. Also, the predictions of the defects in the columns and the normal data in the rows are presented, it can then be seen if the data of the classes generated in this case are confounded by the defects of the normal cases of the ceramics.
Table 2 shows the nomenclature of the data to be entered in the confu- sion matrix, these data will be used for the evaluation of the classifier from the calculation of precision, sensitivity, specificity and accuracy (Cruz & González 2008).
Precision-. It is the total number of correct positive predictions
TPP ∗100% (5) Sensitivity-. Percentage of positive labels that were placed as positive.
Development of a Platform Based on Artificial Vision 179
Table 3. Confusion matrix data using SVM.
Table available in the original PDF paper.
Real Pronostical Defect Normal Defect 96 29 125 Normal 27 103 130 123 132 255
Table 4. Confusion matrix data using KNN.
Table available in the original PDF paper.
Real Pronostical Defect Normal Defect 101 24 125 Normal 23 107 130 124 131 255
Table 5. Confusion matrix result using SVM and KNN.
Specificity-. Percentage of negative labels that were predicted negative cases.
Accuracy-. Percentage predictions that were correct
A = vp + vn Total General ∗100% (8) Equations (5)-(8) provide statistical data which are analyzed to verify the correct operation of the ceramic classifier (Cruz & González 2008).
We proceed to evaluate the performance of the classifier with the trained defects and also with ceramics that do not present defects. In the evalua- tion part, we proceed to verify the performance with 255 images of which 125 of these have some defect and 130 do not present defects, obtaining the following results: As can be seen in Table 3, the results of the confusion matrix by applying SVM to 255 images we obtain the results that can be seen in Table 5.
As can be seen in Table 4, the results of the confusion matrix by applying SVM to 255 images we obtain the results that can be seen in Table 5.
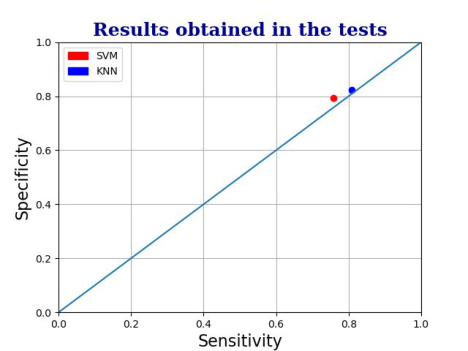
Fig. 4 shows the results of the tests performed to find the effective method for defect detection. As can be seen, a comparison between SVM and KNN is established. The final result indicates that the blue color space gives better results with respect to SVM.
180 Pugo-Mendez and Serpa-Andrade
Figure 3: Segmentation of area of interest.Figure 4: Results obtained represented in a ROC curve.
CONCLUSION
In this paper, we explore the potential of image analysis in the industrial application, the detection of defects in ceramics. Holes and breaks are the ones that draw special attention due to their crucial impact on the manufa- cturing of ceramics. Comparing with other analyzed works such as the work done by Honcenski in which detects the contour and surface of the ceramic with which detects defects in the contour and if the surface defect is big, it detects it, in the proposed method improves the detention of defects by algo- rithms SVM and KNN, in addition, the classification is of four classes in the proposed method, since in Honcenski’s work it is classified into two classes, without defects and with defects.
We propose a ceramic tile detection and classification platform, the results obtained show that the best performing algorithm is the KNN with an accu- racy of 81.45% with respect to the SVM algorithm which has an accuracy of 78.55%. There are still some defects that are difficult to detect, such as Glaze, which is highly dependent on illumination and contrast, as well as contamination of the ceramic surface by dust, which can lead to incorrect classification. In
Development of a Platform Based on Artificial Vision 181
the future, we will focus on improving the algorithms to further satisfy the comprehensive defect detection by Deep Learning and also with hardware for the cleaning of the ceramics before entering the platform.
REFERENCES
Aslam, M., Khan, T.M., Naqvi, S.S., Holmes, G. & Naffa, R., 2019, “On the Application of Automated Machine Vision for Leather Defect Inspection and Grading: A Survey,” IEEE Access, 7, 176065–176086. Cruz, A. & González, F.A., 2008, Aprendizaje Transductivo para la Clasificación de
Imágenes Médicas de Radiolog\’\ia. Feng, X., Jiang, Y., Yang, X., Du, M. & Li, X., 2019, “Computer vision algorithms and hardware implementations: A survey,” Integration, 69(April), 309–320. Hanzaei, S.H., Afshar, A. & Barazandeh, F., 2017, “Automatic detection and
classification of the ceramic tiles’ surface defects,” Pattern Recognition, 66, 174–189. Hocenski, Ž., Mati´c, T. & Vidovi´c, I., 2016, “Technology transfer of computer vision defect detection to ceramic tiles industry,” Proceedings of 2016 International Conference on Smart Systems and Technologies, SST 2016, 301–305. IEEE Centro Occidente Section & Institute of Electrical and Electronics Engineers,
no date, 2018 IEEE International Autumn Meeting on Power, Electronics and Computing (ROPEC) : Ixtapa, Guerrero, Mexico, 14–16 November 2018. Jiang, Y., Wang, W. & Zhao, C., 2019, “A Machine Vision-based Realtime Anomaly Detection Method for Industrial Products Using Deep Learning,” Proceedings - 2019 Chinese Automation Congress, CAC 2019, 4842–4847. Kuhkan, M., 2016, “A Method to Improve the Accuracy of K-Nearest Neigh-
bor Algorithm,” International Journal of Computer Engineering and Information Technology, 8(6), 90–95. Najafabadi, F.S. & Pourghassem, H., 2011, “Corner defect detection based on dot product in ceramic tile images,” Proceedings - 2011 IEEE 7th International Colloquium on Signal Processing and Its Applications, CSPA 2011, 293–297. Nirsal, N., Paembonan, S., Yasir, F.N. & Djusmin, V.B., 2021, Classification of
medicine characteristic using Super Vector Machine (SVM) at Palopo regional public Hospital Sawerigading, Journal of Physics: Conference Series, vol. 1833, IOP Publishing Ltd. Oh, S., Cha, J., Kim, D. & Jeong, J., 2020, Quality Inspection of Casting Product Using CAE and CNN, Proceedings - 2020 4th International Conference on Ima- ging, Signal Processing and Communications, ICISPC 2020, 34–38, Institute of Electrical and Electronics Engineers Inc. Onita, D., Vartan, N., Kadar, M. & Birlutiu, A., 2018, “Quality control in porcelain
industry based on computer vision techniques,” Proceedings - 2018 International Young Engineers Forum, YEF-ECE 2018, 79–84. Pugo-Mendez, E. & Serpa-Andrade, L., 2021, Proposal for a Platform Based on Artificial Vision for the Identification and Classification of Ceramic Tiles, International Conference on Applied Human Factors and Ergonomics, 223–229. Ronneberger, O., Fischer, P. & Brox, T., no date, U-Net: Convolutional Networks for
Biomedical Image Segmentation. Shire, A.N., Khanapurkar, M.M. & Mundewadikar, R.S., 2011, “Plain ceramic tiles surface defect detection using image processing,” International Conference on Emerging Trends in Engineering and Technology, ICETET, 215–220. Singh, S. & Kaur, M., 2012, “Machine vision system for automated visual inspection
of tile’s surface quality,” IOSR J. Eng, 2(3), 429–432.
LISTED IN THE AHFE DIGITAL BOOKSTORE CATALOGUE
Explore the complete digital volume
Artificial Intelligence and Social Computing
Read this individual research paper free through the original publisher, or explore the full digital proceedings book.
ISBN 978-1-958651-04-9
Explore this ISBN in the AHFE Bookstore ↗Listed in the July 2026 bookstore catalogue; search by ISBN to confirm current availability · Digital book purchase optional