Jian-Ping Yang, Lixia Hua (2022). Measuring and Testing Elderly People's Understanding of Internet Products APP Interface Design with Event‑Related Potentials. In: Human Factors in Aging and Special Needs. AHFE Open Access, vol. 38, pp. 88–97. https://doi.org/10.54941/ahfe1001668
As more and more elderly people begin to accept and use Internet product app, the importance of interface icon design is becoming increasingly prominent. The aesthetic feeling and logic of interface icons will seriously affect the performance and experience of user information retrieval, especially for the elderly. Accurately understanding the semantics of interface icons is a part of efficient information retrieval. Questionnaires and behavioral tests are commonly used to measure icon understanding. However, biometric indicators have also been developed to measure icon understanding. The neural indexes of interface icon understanding were studied by measuring event-related potentials (ERPs). The stimulus 1-stimulus 2 paradigm was adopted in this study. 60 participants were divided into two groups and carried out icon recognition experiments independently in the laboratory. This study shows that N300 and N400 are effective neural indicators to evaluate interface icon understanding and can be used to predict interface icon understanding and behavior in the elderly.
In recent years, the use of Internet app by the elderly has shown an increasing trend year by year. App interface icon is the channel for users to communi- cate with information system. Good interface icon design can improve the elderly’s experience of using app and increase the elderly’s willingness to continue to use app. Bateman and others believe that app interface icons pro- vide rich resources and methods for the consistency of overall information transmission, and information consistency is an important cornerstone of user behavior construction. Therefore, they investigated the aesthetic history and developed a set of integration methods of graphic interface icons based on aesthetic theory and empirical research methods. Correct understanding of interface icons is very important to user experience. Many studies have investigated the icon characteristics of understanding speed, accuracy and influencing factors. Jason and Marco (2017) proved that standardization,
Measuring and Testing Elderly People’s Understanding of Internet Products 89
color and shape are three key factors affecting the correctness of under- standing icons. These results provide ergonomic guidelines and icon design suggestions. High understanding helps to minimize ineffective operations caused by human errors. Interface icons should convey clear information to guide the elderly to make appropriate responses. Unfortunately, many studies have shown that misunderstandings about interface icons are com- mon among older people around the world. Understanding icons involves many types of cognitive processing, such as perception, attention and pattern matching. Icon intelligibility is usually measured by an understanding test (brucal et al., 2015), and an understanding accuracy of more than 67.00% is considered acceptable according to the International Organization for Standardization (ISO; ISO 3864, 2011). The American National Standards Institute (ANSI) sets the acceptable level of comprehension at 85.0% (ANSI Z535.32002).
Researchers usually use digital rating scales to measure and check the com- prehensibility of interface icons. For example, many studies use digital scores to measure understanding, consistency, and familiarity with interface icons (yuan et al., 2014;). However, the intelligibility of icons measured by these methods may be affected by subjective bias. There are few objective indicators and methods to measure icon intelligibility, and there are few physiological indicators suitable for measuring icon intelligibility. This study developed an objective method to examine and measure icon understanding in the elderly, and investigated the neural indicators of icon understanding and their rela- tionship with participants’ prediction of icon understanding response in the elderly.
Training to Improve Icon Understanding Previous studies have shown that (Tingru and Alan 2013; ou and Liu 2012;). Educational background is positively correlated with icon understanding. Interface icons can only be understood when users clearly understand their meaning. Mitzner and Rogers (2006) show that low contrast is more unfa- vorable to the elderly than young people, while high predictive words are beneficial to the elderly, and the reading time of young people is significan- tly reduced. However, in any case, it is difficult for users to understand each interface icon in an intuitive and correct way. Therefore, training is a com- mon method to make up for the lack of interface icon design worldwide. Training improves the understanding of interface icons, but is only effective for careful elderly people (Zhang et al. 2018). Lesch (2003) reported that training is beneficial to both young and old people, and adults can signifi- cantly improve the accuracy and speed of understanding. Ou and Liu (2012) demonstrated that training can immediately improve the icon understanding scores of two cross-cultural groups. Even after a month of training, their comprehension scores were still higher than those who did not receive trai- ning. In addition, Lesch (2008) compared two training methods (oral icon training and situational operation training) to improve icon understanding, and found that situational operation training produced a higher propor- tion of correct responses, greater confidence in these responses and longer
90 Yang and Hua
duration of response time. These studies show that training is essential for understanding interface icons. Therefore, this study uses training to con- trol participants’ understanding of interface icons, and uses ERP method to measure and evaluate the impact of understanding on ERP indicators.
N300 and N400 in Semantic Understanding Research ERPs provide a high temporal resolution to study the temporal process of the cognitive mechanism behind semantic violation (Hamm et al., 2002; Ma et al., 2016). N300 is a negative ERP component that appears about 300ms after the start of stimulation. Semantic inconsistencies, such as mismatches between categories, usually lead to large amplitude of N300 (Hamm et al., 2002). N300 can be used to represent semantic understan- ding. Research shows that the picture word metaphor mismatch condition (Balconi and Amenta 2010; Ma et al. 2016) may lead to greater amplitude of N300, which highlights the contribution of N300 to metaphor understan- ding. Therefore, this study tested whether N300 can be used to measure symbol understanding.
In addition to the indicators of response time and accuracy, N400 is a negative component, which can also effectively indicate semantic inconsiste- ncy (Hou and Lu 2018), peaking 350-450 ms after the start of stimulation. Kutas and Hillyard (1980 a) first revealed the ability of N400 index semantic processing. A large number of studies have proved that N400 is very sensi- tive to semantic inconsistency and semantic ambiguity (Hamm et al. 2002; Ma et al. 2016). In general, semantically inconsistent conditions cause greater N400 amplitude than semantically ambiguous and semantically consistent conditions (Polich 1985). In addition, semantic ambiguity causes greater N400 amplitude than semantic consistency (Lee and Federaer, 2009). With the deepening of N400 research, some research reports say that N400 is sen- sitive not only to semantically inconsistent words, but also to semantically inconsistent picture words (Hamm et al. 2002; Ma et al. 2016). In addition, Wang and Chung (2017) proved that there are significant differences betw- een consistency, ambiguity and inconsistency in picture matching tasks. In the app interface design of Internet products, it is almost impossible to observe that the interface icon violates the expected meaning, but semantic ambiguity will occur, especially the interface icon unfamiliar to the elderly. Therefore, we discussed whether N400 can indicate icon understanding in the process of information processing.
METHOD
Participant In this experiment, 60 subjects were recruited to participate in the test. These subjects were all from the University of the elderly. All of them had long-term experience in using smart phones. Their educational experience was similar. The average age was 65.14 years old, the standard deviation was 3.41 years old, and the sex ratio of the subjects was close to 1:1. The corrected visual acuity was normal and all were right-handed. Before the experiment, no one
Measuring and Testing Elderly People’s Understanding of Internet Products 91
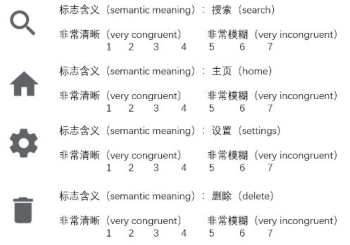
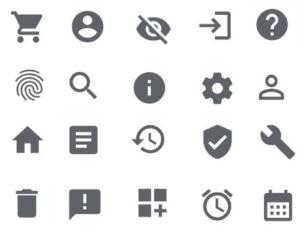
Figure 1: Example of semantic detection task.Figure 2: Interface icons used as stimuli in this study.
had received any interface operation training. The training was very time- consuming. We randomly divided the participants into two groups with 30 people in each group. One group received training in understanding inter- face icons, while the other group did not. Participants agree by signing a statement.
Experimental Materials Semantically ambiguous interface icons are selected from fonts.google.com network platform. We selected 100 generic or indicative icons and scored their semantic consistency with the help of experts. Five experts were asked to rate interface icons and meanings from 1 (very consistent) to 7 (very inconsi- stent). Each expert must evaluate 100 icons. The sample is shown in Figure 1. According to the scoring results, we selected 20 icons (mean value 6.653, standard deviation 0.517) as ERP Experimental materials. The selected logo for expert evaluation is pretreated with Adobe Photoshop CS to standardize its size, color and brightness. They are at 1280 × 1024 pixel resolution is displayed 30 cm from the participant. Figure 2 shows an example of icons.
Experimental Design and Procedure This study used a mixed experimental design; icon training was the between- group factor and icon comprehension was the key factor investigated. The experiment includes an exercise session and a formal experiment session.
92 Yang and Hua
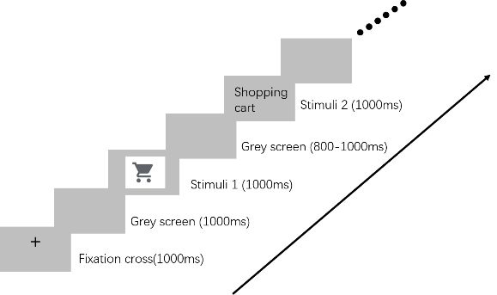
Figure 3: Experimental process.
After a brief introduction, participants begin to practice the course. During the practice session, a “+” will appear in the center of the screen to attract the participants’ attention. After that, the screen turns gray. After 1000ms an interface icon appears in the center. After another 1000ms, the screen turns gray again, giving participants time to think about the meaning of the icon. Then, the interval is 1000ms. Then, a word is displayed on the screen for 1000ms. Participants were asked to press keys to indicate whether the semantics were consistent with the icon (“1”means consistent and “2”means inconsistent). Subsequently, 60 trials were conducted. Another group of par- ticipants received a five-day training before participating in the experiment to understand the exact meaning of the interface icon. By the fifth day, the understanding accuracy of all signs reached 95%, which was higher than the acceptable level / Standard specified by ANSI. After that, the experiment began.
The ERP experiment adopts the stimulus 1 – stimulus 2 (S1-S2) paradigm, which is a popular paradigm in nonverbal semantic processing experiments (Federaer and Kutas 2002; Hamm et al. 2002). This paradigm presents two kinds of stimuli in turn; Here, stimulus 1 is the interface icon and stimulus 2 is the semantic content of the icon. In each test, the center fixed crosso- ver lasted 1000ms. Then, a gray screen is displayed for 1000ms, and then an interface icon is displayed in the center of the gray screen for 1000ms. Another gray screen randomly displays 800 to 1000ms, and then displays a word for 1000ms (Figure 3). Participants must press the corresponding key to indicate whether its meaning is consistent with the icon. We have pre- pared five misleading or confusing meanings for icons as interference terms. After installing the electrode cap, participants were asked to relax and remain stationary during the experiment.
Data Acquisition Neuroscan Synapps 2 amplifier (Scan 4.3.1; Neurosoft Labs Inc., Sterling, Virginia, USA) is used to continuously record electroencephalogram (EEG) (band-pass 0.1 – 30 Hz, sampling rate 1000 Hz) through the electrode cap.
Measuring and Testing Elderly People’s Understanding of Internet Products 93
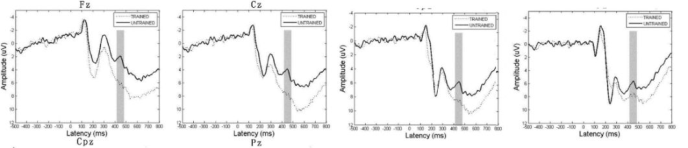
Figure 4: Total average waveform of trained and untrained participants. (left).
The electrode cap has 64 Ag / AgCl electrodes, which conforms to the interna- tional 10 – 20 system and refers to the left and right mastoids. The electrode at FCZ position is used for grounding. The electrode impedance is kept below 5K . The interface icon is the target domain of the image mode, and its semantics (described by text) is the source domain.
Data Analysis Matlab 2018a (MathWorks company, Natick, Massachusetts, USA) and EEGLAB toolbox are used for off-line preprocessing of EEG data. EEGLAB is an interactive MATLAB toolbox used to process continuous and event- related EEG data. It also processes other electrophysiological data related to several useful modes of independent component analysis (ICA), time /freque- ncy analysis, artifact suppression and visualization of average and single test data. EEG records were extracted from 500ms before writing stimulation to 800ms after writing stimulation. After that, the calibration baseline was recorded using the first 500ms of each channel. Before averaging, The peak to peak deflection of the unqualified track may exceed ± 80µv is rejected. ADJUST 1.1.1 was used to correct artifacts such as EMG. Finally, the data of the training group and the untrained group were averaged.
Based on visual inspection, the ERP waveform (shown in Figure 4) shows that the time windows of N300 and N400 are 280-310ms and 430-460ms respectively when analyzing the average amplitude of frontal and parietal regions. These results are similar to previous ERP Studies (Ma et al., 2016; Wang and Chung 2017). Strong N300 and N400 amplitudes are caused by semantic inconsistency or ambiguous conditions.
As mentioned earlier, this study used training to control the understanding of interface icons. The trained participants clearly understood the meaning of the icon; This is called understanding condition. Untrained participants do not understand the meaning of these icons; This is called an incomprehensible state.
RESULTS
Behavioral Results The collected behavior data include the response time of icon word meaning and the accuracy of semantic judgment. Under the training condition, the average response time of participants was about 671.33 MS (SD 120.45),
94 Yang and Hua
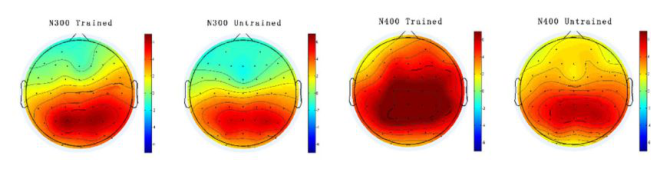
Figure 5: Topographic map of trained and untrained participants. (right).
which was much shorter than that of participants under the untrained con- dition (750.60 MS; standard deviation 140.12 MS). Paired t-test showed that icon training significantly shortened the response time (t = −10.605, P < 0.001).
The understanding accuracy (AOC) of each icon is calculated according to the participants’ answers. The average AOC of the training group was 0.934 ± 0.032, which was higher than the acceptable understanding level of 85% accuracy set by ANSI. The average AOC of the untrained group was 0.279 ± 0.143, which was lower than the acceptable understanding level of 67% accuracy specified in ISO 3864. There was significant difference between the two groups (t = 21.001, P < 0.001).
ERP Results
Figure 5 shows the topographic map of N300 and N400 under incomprehen- sible and understandable conditions. The red depth indicates the magnitude of the positive vibration amplitude of each electrode, and the blue indicates the negative value. The color presents the scalp distribution of N300 and N400 amplitudes. The topographic map of N300 response shows that the processing areas of the cerebral cortex are distributed in the frontal lobe. In addition, training reduced the blue depth in the frontal region. The topogra- phic map of N400 response shows that training reduces the depth of red, indicating that training reduces the negative component. In addition, the scalp distribution was similar in both cases. In general, topographic maps provide intuitive insights into ERP results.
DISCUSSION
This study combines interface icons and words expressing their meaning, and evaluates the impact of training on icons by analyzing ERPs. Record the rea- ction time and accuracy of semantic judgment without understanding and understanding. In addition, N300 and N400 ERP components were obse- rved; Regression analysis showed that N300 and N400 of FCZ and CZ were effective indicators of understanding accuracy.
Impact of Icon Understanding on Behavioral Response Previous studies reported that training significantly reduced response time and improved the accuracy of icons (OU and Liu, 2012). The reaction time
Measuring and Testing Elderly People’s Understanding of Internet Products 95
results of this study are consistent with those of previous studies. Understan- ding the icon significantly shortened the response time (671.33 ± 120.45 vs. 750.60 ± 141.12ms, t = −10.605, P < 0.001). The results showed that participants in the untrained group spent more time trying to understand confusing icons and had a high probability of misjudgment. In contrast, the five-day training helped participants understand the semantics of icons; As a result, trained participants can respond more quickly. This evidence suggests that a clear understanding of icons can help older people respond quickly and save time.
Impact of Icon Understanding on ERP Response Without understanding and understanding, the significant difference in ERP data of interface icon word meaning shows that we can measure and evaluate semantic understanding by exploring the cognitive semantic processing mech- anism behind ERP. The app interface conveys inconsistent semantic informa- tion through icons. Under the condition of no understanding, N300 produces a greater amplitude of negative ERP than under the condition of understan- ding. The amplitude of N400 reflects the impact of icon understanding on ERP evaluation. Under the condition of no understanding, the amplitude of N400 is greater, and under the condition of understanding, the amplitude of N400 is smoother, which indicates that the understanding of icons reduces the conflict between icons and subsequent semantic context. In conclusion, icon understanding significantly affects the amplitudes of N300 and N400, indica- ting that these ERP can be used as indicators to measure and predict symbol understanding.
Research Significance This study used ERP method to explore the neural processing related to interface icon understanding and explain the behavioral responses of participants. The amplitude changes of about 300 and 400ms after the start of stimulation reveal the neurocognitive processing mechanism of icon understanding. The large negative amplitude of N300 indicates a logical mismatch between icon and meaning; The results of N400 show that there are misunderstandings or semantic inconsistencies between icons and meanings. Therefore, this study proves that ERP method, which uses the inherent response of the brain, is a useful analytical symbol understanding.
This study used event-related potentials to study the effect of icon under- standing. N400 ERP component is an indicator of semantic inconsistency, which disappeared among participants with icon understanding. Previous studies used subjective scales to measure the semantic distance between icons and their meaning. In this study, N400 is mainly caused by the disharmony between the a icon and its meaning, which shows that N400 is an effe- ctive indicator of semantic distance. Compared with subjective scale, neural index provides more objective and accurate information to evaluate semantic distance.
96 Yang and Hua
The results of this study have the following three meanings: (a) interface icons should clearly convey semantic information to users and use the mini- mum semantic distance. (b) In addition, the characteristics of icons and signs provide clues to understanding. Users can interpret icons through feature analysis. Complex icons with functions unfamiliar to users may confuse users and even lead to misunderstandings. (c) Finally, the N300 and N400 ERP components can be used to evaluate icon understanding in practice. ERP method provides an objective method to check icon design and determine whether the elderly fully understand icons.
LIMITATIONS The experiment strictly controls the variables, but the actual situation is much more complex. In addition, the ERP method requires at least 60 icon word meaning demonstrations to confirm the understanding effect. In addition, the electrode cover takes 10-15minutes to install. Future technological advances may overcome these shortcomings.
CONCLUSION
This study used ERP measurements to test the effect of interface icon under- standing on neural indicators. The results provide neurological evidence that ERPs indicators can detect the understanding of interface icons. It also reve- als the neural mechanism of people’s understanding of symbolic semantics. As shown by the significant reduction of N300 and N400, icon understan- ding reduces the logical and semantic inconsistency between icons and their meanings.
ACKNOWLEDGMENT
This project was sponsored by grant No. LGG19G010001 from the Natural Science Foundation of Zhejiang province.
REFERENCES
Balconi M, Amenta S (2010) “A fighter is a lion”. Neuropsychological indexes in comprehending frozen metaphors. J Pragmatics 42:3246–3257 Barrett E, Rugg D (1990) Event-related potentials and the semantic matching of
pictures. Brain Cogn 14:201–212 Federmeier KD, Kutas M (1999) Right words and left words: electrophysiological evidence for hemispheric differences in meaning processing. Cogn Brain Res 8(3):373–392 Franklin MS, Dien J, Neely JH, Huber E, Waterson LD (2007) Semantic priming
modulates the N400, N300, and N400RP. Clin Neurophysiol 118(5):1053–1068 Hou G, Lu G (2018) Semantic processing and emotional evaluation in the traffic sign understanding process: evidence from an eventrelated potential study. Transp Res Part F Traffic Psychol Behav 59:236–243 Hamm JP, Johnson BW, Kirk IJ (2002) Comparison of the N300 and N400 ERPs
to picture stimuli in congruent and incongruent contexts. Clin Neurophysiol 113:1339–1350
Measuring and Testing Elderly People’s Understanding of Internet Products 97
Kutas M, Hillyard S (1980a) Reading senseless sentences: brain potentials reflect semantic incongruity. Science 207:203–205 Kutas M, Hillyard SA (1980b) Event-related brain potentials to semantically inap-
propriate and surprisingly large words. Biol Psychol 11:99–116 Lee CL, Federmeier KD (2009) Wave-ering: an ERP study of syntactic and semantic context effects on ambiguity resolution for noun/ verb homographs. J Mem Lang 61:538–555 Ma Q, Hu L, Xiao C, Bian J, Jin J, Wang Q (2016) Neural correlates of mul-
timodal metaphor comprehension: evidence from eventrelated potentials and time-frequency decompositions. Int J Psychophysiol 109:81–91 Mitzner TL, Rogers WA (2006) Reading in the dark: effects of age and contrast on reading speed and comprehension. Hum Factors 48:229–240 Polich J (1985) N400s from sentences, semantic categories, number and letter
strings? Bull Psychon Soc 23:361–364 Wang CY, Chung YJ (2017) Detecting the semantic differences of congruence, ambiguity, and incongruence in the picture-word matching task using the event-related potential. J Des 22:25–45
LISTED IN THE AHFE DIGITAL BOOKSTORE CATALOGUE
Explore the complete digital volume
Human Factors in Aging and Special Needs
Read this individual research paper free through the original publisher, or explore the full digital proceedings book.
ISBN 978-1-958651-14-8
Explore this ISBN in the AHFE Bookstore ↗Listed in the July 2026 bookstore catalogue; search by ISBN to confirm current availability · Digital book purchase optional