Youngjun Park, Chajoong Kim, Jungkyoon Yoon (2022). Exploring the relationship between an emotional experience with everyday products and its contribution to people’s well-being and life satisfaction. In: Affective and Pleasurable Design. AHFE Open Access, vol. 41, pp. 293–299. https://doi.org/10.54941/ahfe1001809
Emotions have a huge impact on people in various ways. Learning ability, behaviour, and judgment are substantially influenced by Emotion (Analysis & Signals, 2017). Recent clinical studies have shown that positive emotion regulation in daily life has the advantage of preventing and solving health risks (e.g., reducing the risk of cardiovascular disease). Many previous studies illustrate that emotions have their own role, which shows that there are no good or bad emotions. Emotion itself is an important signal indicating a person's well-being. In the case of negative emotions, they can enrich the consumer experience (Desmet, 2010; Desmet, Fokkinga, Ozkaramanli, & Yoon, 2021): for instance, they play a very important role in human security. However, designers generally want products that elicit only good or pleasant emotions to affect users' emotions. Various emotions are indispensable for a person's well-being. Therefore, this paper explores how negative and positive emotions in interacting with the product are related to our happiness and life satisfaction. For this, a diary study was conducted to determine whether emotions provided by the product affect people's happiness and life satisfaction. Six participants were recruited and they participated in a three-week diary study. They were asked to rate their emotions with everyday products and also how the emotions contributed to their life satisfaction as well as happiness. An in-depth interview was conducted with their dairy. A total of 216 products were reported from the diary study, and related emotions were categorized into three groups: positive emotion, positive-negative emotion, and negative emotion. It was statistically analyzed how each group is correlated with their well-being and life satisfaction. The results indicate that only positive emotion is a major contributor to their well-being and life satisfaction than positive-negative emotion. The findings highlight that the more positive emotions are provided, the higher the user's happiness which can lead to an increase in life satisfaction. It was found that there is a discrepancy between findings from previous studies and those of our study. The implications and limitations of the study are discussed in the end.
Emotions have a huge impact on people in various aspects, such as Lear- ning ability, behavior, and judgment are substantially. Recent clinical studies have shown that positive emotion regulation in daily life has the advantage of preventing and solving health risks (e.g., reducing the risk of cardiovascular disease). Much previous research illustrates that both positive and negative experiences benefit people in some ways. Emotion itself is an important signal indicating a person’s condition. The different emotions have different influ- ences on people’s perceptions, thoughts, and behavior (Frijda, 2017). In the case of negative emotions, they are very sensitive to changes and play a very important role in human security. However, designers generally want produ- cts that elicit good or pleasant emotions to affect users’ emotions. However, negative emotions can also enrich the consumer experience. (Desmet, 2010; Pieter M A Desmet, Fokkinga, Ozkaramanli, & Yoon, 2021). Even if it is a negative emotion, it can play a sufficiently positive role when it is regulated properly for well-being. For example, the thrill felt on roller coasters can pro- vide a fun experience, but fun can become fear when it goes to strong. Also it
is not good to provide a tremendously good feeling at once; it was more like happier and satisfied when the small positive experiences are frequently expe- rience in daily life (Diener, Sandvik, & Pavot, 2009, Diener et al., 2009). And when it comes to providing this small happiness, the importance of emotions provided by-products around people increases. In this product can defined as any product that people can imagine in their daily lives. Therefore, in this study, we want to determine which product emotions make people happier and contribute to users’ satisfaction.
METHOD
To evaluate the product emotion leads to happiness and satisfaction, the diary study method was undertaken. The diary study contains definition of 20 posi- tive and negative emotions, and definition of product, 185 products of daily product examples and seven sets of three pages of research materials. The three pages determine which products created memorable emotions in daily life, what emotions were felt by those products, and whether the products affected happiness and life satisfaction. this research was conducted for three weeks to obtain many daily product emotions.
first page, participants reported feelings and episodes about the memorable product of the day by drawing or text. Second page, participants measure it from list of 20 positive emotions and 20 negative emotions in a scale of 1 to 5. Finally, the last page ended by measuring of its influence on happiness and life satisfaction and measured by Likert scale of 1 (strongly disagree) to 9 (strongly agree). a total of six participants who majored in design graduate students. Four women and two men were recruited, whose ages ranged from 24 to 38 years old, on average 28 years old. Each participant received three diaries for three weeks, and each person reported feelings and episodes about the memorable product of the day. Then, participants wrote about which particular emoti- ons they felt and their intensity with the product among positive and negative emotions. Finally, the last page ended by writing about its influence on hap- piness and life satisfaction. This procedure was repeated every day for three weeks with three diaries.
RESULT
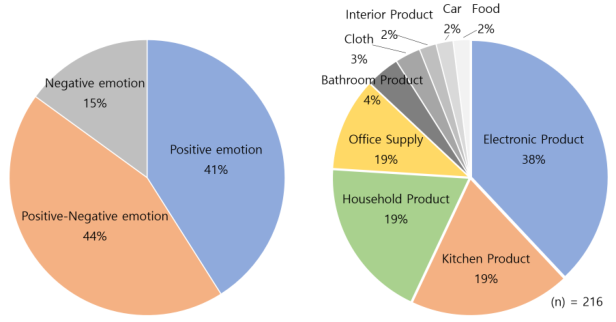
Two hundred sixteen classified products and products and all emotions divi- ded into positive and positive-negative products were classified. The number of products that made only positive emotions were 87, positive and nega- tive emotions was 96, and 33 negative emotions. As shown in Figure 1, the product category with the most number was positive-negative at 44%. Next was positive 41%, and the smallest number was negative 15%. In positive-negative emotions, the correlation between happiness and life sati- sfaction was generally reduced. Lastly, in the case of positive Emotion, it was found that most of the happiness was high, the same or more score in life satisfaction.
Exploring the Relationship Between an Emotional Experience with Everyday Products 295
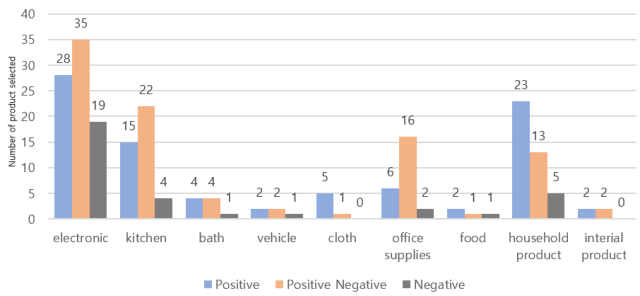
Figure 1: The percentages of emotions with everyday products (Left) and the percen- tages of everyday products reported in the study (Right).Figure 2: Emotion classification according to product type.
Eleven categories were categorized and mentioned, and they were all cate- gorized according to the categories defined in the online market. According to the product analysis from online market categories, the most selected product classification was electronics products (38%). The second most sele- cted product categories are kitchen products (19%)) and household products (19%) each. Finally, the fourth category is office supply (11%), including post-its, calendars, ballpoint pens, etc. other categories are bathroom pro- ducts (4%), clothes (3%), and automobiles (2%), food (2%), and interior products (2%).
From Figure 2, classifications of various emotions show that products that made participants feel positive the most were electronics, kitchen pro- ducts, and household products. In the case of positive-negative products, electronics, kitchen product, and office supplies were chosen the most. Conversely, the products with the most negative emotions were electro- nics, household products, and kitchen products, which were the same as positive ones.
Table 1. Result of t-test analysis between emotion, happiness, and life satisfaction.
Link to Product Emotions, Happiness, and Life Satisfaction Prior to the analysis, outliers and normality checks were conducted. In the total number of samples, negative emotions were judged not to provide hap- piness and life satisfaction, so the number of products that provided only negative emotions was excluded from the experiment. This reduced the total number of samples to 183. After that, with SPSS checking the outlier, and could not find the extreme outlier, so the t-test proceeded.
If the t value is less than 0.05, the difference between the two groups, positive and positive-negative, is significant. However, with the t-values of happiness and satisfaction set to 4.5 and 3.6, it can be seen that the differe- nce between happiness and satisfaction, positive emotions, and positive and negative emotions in this study is not significantly different.
Emodiversity of Product
Table 2 determines the results of the emotions selected by the participants for three weeks. In the positive emotions felt in the product, the top three were satisfaction, relaxation, and joy. On the contrary, the top three negative emotions are annoyance, boredom, and dissatisfaction. Among them, it can be seen in satisfaction and dissatisfaction as opposite factors to each other. Also, joy and boredom are judged to be contradictory emotions.
DISCUSSION
The main goal of this study was to define the product emotion that increa- ses life satisfaction. As a result, shows the investigation of whether positive, positive-negative emotions affect happiness and life satisfaction. Through the T-test, there was no statistically significant difference in happiness and life satisfaction for the product (p >.05). However, there is a positive product that provides more happiness and life satisfaction than the positive-negative product. Therefore, when manufacturing a product, it is important to design it so that as many positive emotions as possible. Saariluoma (2014) noted that the positive and negative emotional dimensions of user experience are independent. So, negative emotions do not necessarily eliminate positive emo- tions. However, products without negative emotions provide better happiness and life satisfaction than products that create negative emotions.
Participants’ emotional state in various products data has shown that it greatly influences users’ emotions depending on their emotional state. For example, a user’s emotional state may impact on negative mood due to long work commutes (Novaco and Gonzalez, 2009), worries about economic
Exploring the Relationship Between an Emotional Experience with Everyday Products 297
Table 2. Amounted emotion selected from participant’s table.
hardship (Mani, Mullainathan. 2013; K., Sendhil. 2012), and poor sleep quality (Kahneman and Krueger, 2006). This negative emotional state has a significant impact on the emotions the product gives. The list of emoti- ons felt in the products and why the product provides them were largely related, and the product emotions were maintained when it solves the pro- blem. Through this, It explains it will be possible to maintain or amplify a person’s basic emotional state according to the emotions provided by the product.
Product Emotion and Happiness As a result, products that provide satisfaction, comfort, and joy bring happi- ness to people. Satisfaction would be achieved by product usability to solve the problem that participants had. In the case of comfort and joy, it appe- ars during or after a problem is solved. On the contrary, if usability is not achieved, it may provide negative Emotion, which would be dissatisfaction. Products with negative emotions cause annoyance, boredom, and dissatisfa- ction. Inconveniences after actual use solve the problem. If using a product interferes with their behavior, is boring or unsatisfying, people feel very nega- tive emotions. In this way, when users do not do what they want or are not satisfied with what the product provides, it creates many negative emotions. However, it was also able to confirm the desire for improvement for better satisfaction.
Everyday Products and Emotional Experiences Positive-negative products were the most common in everyday products because the emotions are given in using the product gradually become familiar. (eg. Hedonic adaptation). In the case of products, many products were nearby users and used every day. They are familiar products from ele- ctronic products in their hand to kitchen products and household products. It is familiar to the users, but there is no clear relation between certain sti- muli and certain types of emotions (Desmet et al., 2016). Even if users use the same product, the same event would provide different emotions towards the different people which one person may be delighted, and others may offend the same product. In the case of smartphones, it is a product that appears in all emotional categories. However, depending on the situation, the feelings changed. It provided positive emotions when they solved users’ needs or pro- blems, but vice versa. They provided negative emotions when they could not solve the problem.
CONCLUSION
This study aimed to determine how much product emotions affect people’s happiness and life satisfaction. A Diary study was done with six recrui- ted participants. They were asked to evaluate 40 different emotions, and life satisfaction assessment. They gave an appraisal of 216 products over three weeks. Through the t-test, to find out which emotional state provide happiness and life satisfaction, but as a result, positive Emotion and positive- negative Emotion did not find any significant difference to happiness and life satisfaction.
However, when looking at the t results, users gained a lot of happiness and life satisfaction when they provided only positive emotions. Therefore, considering the emotions of the product, it is recommended to provide only positive emotions as much as possible. The limitation of this study is that when looking at the life satisfaction evaluation, users’ emotional state can provide different results from those in other emotional states. Life satisfaction and happiness were often used in economic or political research (Arechavala, Espina and Trapero, 2015) to measure emotional well-being. Therefore, as an additional study, further research on emotional well-being is needed.
ACKNOWLEDGMENT
This work was supported by the Ministry of Education of the Repu- blic of Korea and the National Research Foundation of Korea (NRF- 2020S1A5A2A03045893).
REFERENCES
Arechavala, N. S., Espina, P. Z. and Trapero, B. P. (2015) ‘The economic crisis and its effects on the quality of life in the European Union’, Social Indicators Research. Springer, 120(2), pp. 323–343. Desmet, P. M. A. (2010) ‘Three levels of product emotion’, in Proceedings of the inter-
national conference on Kansei engineering and emotion research, pp. 236–246.
Exploring the Relationship Between an Emotional Experience with Everyday Products 299
Desmet, P. M. A. et al. (2016) Emotion-Driven Product Design, Emotion Measurement. Elsevier Ltd. doi: 10.1016/B978-0-08-100508–8. 00016–3. Desmet, P. M. A. et al. (2021) ‘Emotion-driven product design’, in Emotion
Measurement. Elsevier, pp. 645–670. Diener, E., Sandvik, E. and Pavot, W. (2009) ‘Happiness is the frequency, not the intensity, of positive versus negative affect’, in Assessing well-being. Springer, pp. 213–231. Frijda, N. H. (2017) The laws of emotion. Psychology Press. K., S. A., Sendhil, M. and Eldar, S. (2012) ‘Some Consequences of Having Too Lit-
tle’, Science. American Association for the Advancement of Science, 338(6107), pp. 682–685. doi: 10.1126/science.1222426. Kahneman, D. and Krueger, A. B. (2006) ‘Developments in the Measurement of Subjective Well-Being’, Journal of Economic Perspectives, 20(1), pp. 3–24. doi: 10.1257/089533006776526030. Mani, A. et al. (2013) ‘Poverty impedes cognitive function.’, Science (New York,
N.Y.). United States, 341(6149), pp. 976–980. doi: 10.1126/science.1238041. Novaco, R. W. and Gonzalez, O. I. (2009) Commuting and well-being, Technology and Psychological Well-being. doi: 10.1017/CBO9780511635373.008. Saariluoma, P. and Jokinen, J. P. P. (2014) ‘Emotional dimensions of user experience: A user psychological analysis.’, International Journal of Human- Computer Interaction. Saariluoma, Pertti: Department of Computer Science and Information Systems, University of Jyvaskyla, Box 35, Jyvaskyla, Fin- land, 40014, pertti.saariluoma@jyu.fi: Taylor & Francis, pp. 303–320. doi: 10.1080/10447318.2013.858460. Arechavala, N. S., Espina, P. Z. and Trapero, B. P. (2015) ‘The economic crisis and its
effects on the quality of life in the European Union’, Social Indicators Research. Springer, 120(2), pp. 323–343. Desmet, P. M. A. (2010) ‘Three levels of product emotion’, in Proceedings of the international conference on Kansei engineering and emotion research, pp. 236–246. Desmet, P. M. A. et al. (2016) Emotion-Driven Product Design, Emotion Measure-
ment. Elsevier Ltd. doi: 10.1016/B978-0-08-100508–8. 00016–3. Desmet, P. M. A. et al. (2021) ‘Emotion-driven product design’, in Emotion Measurement. Elsevier, pp. 645–670. Diener, E., Sandvik, E. and Pavot, W. (2009) ‘Happiness is the frequency, not the
intensity, of positive versus negative affect’, in Assessing well-being. Springer, pp. 213–231. Frijda, N. H. (2017) The laws of emotion. Psychology Press. K., S. A., Sendhil, M. and Eldar, S. (2012) ‘Some Consequences of Having Too Little’, Science. American Association for the Advancement of Science, 338(6107), pp. 682–685. doi: 10.1126/science.1222426. Kahneman, D. and Krueger, A. B. (2006) ‘Developments in the Measurement of
Subjective Well-Being’, Journal of Economic Perspectives, 20(1), pp. 3–24. doi: 10.1257/089533006776526030. Mani, A. et al. (2013) ‘Poverty impedes cognitive function.’, Science (New York, N.Y.). United States, 341(6149), pp. 976–980. doi: 10.1126/science.1238041. Novaco, R. W. and Gonzalez, O. I. (2009) Commuting and well-being, Technology
and Psychological Well-being. doi: 10.1017/CBO9780511635373.008. Saariluoma, P. and Jokinen, J. P. P. (2014) ‘Emotional dimensions of user experience: A user psychological analysis.’, International Journal of Human- Computer Interaction. Saariluoma, Pertti: Department of Computer Scie- nce and Information Systems, University of Jyvaskyla, Box 35, Jyvaskyla, Finland, 40014, pertti.saariluoma@jyu.fi: Taylor & Francis, pp. 303–320. doi: 10.1080/10447318.2013.858460.
LISTED IN THE AHFE DIGITAL BOOKSTORE CATALOGUE
Explore the complete digital volume
Affective and Pleasurable Design
Read this individual research paper free through the original publisher, or explore the full digital proceedings book.
ISBN 978-1-958651-17-9
Explore this ISBN in the AHFE Bookstore ↗Listed in the July 2026 bookstore catalogue; search by ISBN to confirm current availability · Digital book purchase optional