Rogério Ribeiro, Daniel Raposo, Rita Almendra, João Neves (2023). Visual Thinking Through Diagrams. In: Human Dynamics and Design for the Development of Contemporary Societies. AHFE Open Access, vol. 81, pp. 29–39. https://doi.org/10.54941/ahfe1003530
The purpose of this paper is to identify what kind of schemas or diagrams are most functional as a way of visualizing and transposing ideas.It aims to gather knowledge about how some ideas were interpreted after visualizing visual schemes, especially abstract concepts and the union of dispersed information. Currently, the intangible concepts that define a brand become increasingly complex to express and are almost never fully transmitted to internal and external stakeholders of the entity, creating in the mind of each one, a brand image little related to other aspects, goals and visions that the brand may have.This topic becomes relevant in the transposition of concepts during the development of brands, having visual identity systems or even brands that have their concepts, but need tools capable of communicating them visually.A systematic methodology was adopted, with a non-interventionist basis, with case studies of schemes and diagrams used by major brands and international brands.The results consist in the identification of a set of graphic principles and characteristics that brands should use in order to ensure their clear communication and ideological coherence.
Approximately 50% of the brain is dedicated (directly or indirectly) to visual functions, so Professor Mriganka Sur (MIT Research, 1996) and for the visual process about hundreds of millions of neurons are dedicated and occupy about 30% of the cortex, compared to 8% for touch and only 3% for hearing. Each of the two optic nerves, which carry signals from the retina to the brain, is composed of a million fibers compared to each auditory nerve, which is only 30,000 (Grady, 1993). Therefore, it can be stated that our brain is more apt to process images than sounds.
As Rato (2010) states, since the origin of mankind, man felt the need to create a way to communicate with his peers, exposing ideas, feelings, emoti- ons and reactions. He used painting for this purpose, the ones we call cave paintings today. These same paintings became more abstract, giving rise to pictograms that later became letters and numbers. In other words, he created visual models that became visually preceptive, distinguishing man from the animal, which, through each one’s eyes, treats the perceived information in a different way.
Arnheim (1969) states that visual perception is visual thinking, because the perception of something automatically involves the need to think. It is in this conception that the visualization process begins to be an intentional process, being determined by the communicator’s intention, the viewer’s interpreta- tion and disposition, as well as the context in which all this visual perception happens. It is possible to state that the communicator’s intention is often to persuade or help the viewers to understand what they visualize.
Klein & Bevington (2008) state that graphic visualizations can be divided into four interchangeable areas. (1) visualizations that tend to represent real or abstract images, but associated with the way humans see the world, as are the cases of photographs or illustrations; (2) visualizations that use quanti- tative methods to convey ideas of time, space, volume, or more factors, as are the cases of graphs; (3) visualizations that are composed of symbols, such as those used in text documents or navigational maps; (4) visualizations that tend to convey complex structured relationships, as are the cases of diagrams or tables.
Most of these graphic visualizations are used in conjunction with the emphasis and precision one wishes to convey, and it can also be said that the most effective approaches are based on the balance between standardized and non-standardized approaches, because excessively conventional approaches run the risk of not holding the viewer’s attention, and excessively innovative approaches may not be fully understood, always depending on the viewer’s interpretation at a given time and environment.
An example of this is the letters that form texts, being symbols, it is up to the viewer to interpret which letters they are and, being based on his kno- wledge, to interpret what they mean. If we think about this, it is natural to realize that it is simpler for the brain to process schemas and diagrams than texts, because in order to read, the brain needs to decode and combine letters that are stored in its knowledge, and from there, form words, which form sentences, paragraphs, etc., whereas images are treated at once.
Thus, as Costa (1998) states, schemas help understanding more quickly, because they use historical and cultural tools of graphic communication, such as image and text, to treat visual information, adapting them to a culture, information technology, and the viewers’ knowledge.
Lupton & Phillips (2008) refer to the term diagram for this purpose, being a diagram a graphical representation of a structure, situation or process, and may represent a company’s hierarchy, as a flow of ideas, as even the ana- tomy of an animal. They allow us to perceive existing relationships, which we would not be able to perceive in a list of numbers or verbal descriptions.
To improve this understanding, diagrams are sometimes used that con- tribute to a more transversal, accessible and fluid understanding of the information. In this study, we intend to understand the influence and impor- tance that diagrams have as a way of explaining complex concepts or ideas, namely business structures, organizations, or methods, with various levels of importance or sequence, with main cores and right or possible declinations or dependencies, using the explanatory case study methodology referred to by Yin (1994).
Visual Thinking Through Diagrams 31
THE USE OF SCHEMAS AND DIAGRAMS AS A FORM OF VISUALIZATION As Bonnici (2000), Dondis (2003), Munari (2006) and Erlhoff and Marshall (2008) state, the term visualization has two distinct and related definiti- ons. On the one hand, we have the perception of visual information, which we call “seeing”, and on the other hand we have the act of conceiving, which implies the process and production of visual information communi- cation products. In designing, the visualization process is determined by the communicator’s intention, who needs, the disposition of the viewer/recei- ver to interpret the message, and the context in which the communication is performed. Therefore, the communicator needs effective means, capable of persuading or helping the receivers, who are willing and able to understand what is visualized.
Within visual communication there may be four distinctions, 1- graphics that represent real or abstract images, which are associated with the way humans visualize the world, such as photographs or illustrations; 2- graph- ics that use quantitative methods to convey idea of time, number, or other factors, being these, very usual use in scientific and financial fields; 3- graph- ics composed of symbols, with the most varied use, from text documents or signage; and, increasingly common, 4- graphics that convey more complex structured relationships, such as diagrams or node-and-link schemes. Today, most visualizations are composed of all of these, using varying degrees of highlighting and precision for any particular subject.
If in the conception of a visual communication is inherent the existence of effective means, capable of persuading or helping the viewers to understand the message, then the knowledge of language and signs, determines which are the people who are the target of that communication, forming walls that prevent clear communication. In other words, within the simple premise of communicating, with the sender, the message and the receiver as stakeholders, the process can be much more complex. As a communication object, the message is a set of signs that are organized by predefined rules, thus building a code that must be common to both sender and receiver for the message to be attainable (Silva et al., 2012).
In this follow up, sketches and diagrams have been helping as an unlocker of the message, using visual graphics with cultural logic. What in slang we can say as “making a sketch...”, gains greater meaning when we know that the sketch is the simplest and most direct expression we can have.
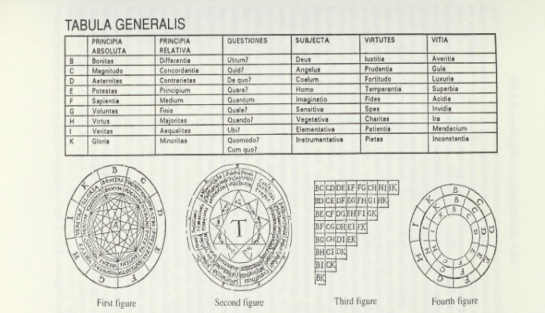
An example of this was the father of combinatorics, Ramon Llull, who in 1380 released the book Arsgeneralis ultima, where he approached the conce- ption of a logic machine. This construction had the purpose of showing all the possible truth, because for Llull there could only be a certain number of undeniable truths, and if combined, in all possible ways, we could find the absolute truth (Cuevas, 2016).
Ramon Llull sought through a model of knowledge, known as Ars Magna, a universal art of divine inspiration, interrelated with all the disciplines of knowledge of his time (astronomy, philosophy, theology, logic, medicine, law, among others), demonstrating through the Ars Combinatoria method and
encouraging dialogue between Jews, Christians and Muslims, but also betw- een Latin Christians and Greeks, leading to peace between religions. This method of combinatory logic, was a mechanism built on paper, composed of seven concentric discs with letters and other graphic symbols, which when rotated were combined with each other.
In this way, Llull formed texts that combined prayers to God with alge- braic annotations and diagrams that sought to clarify, like a great network structure of relationships between the divine, the world and the human. Thanks to his work in the art of combinatorics, he opened precedents for the development of today’s communication technologies (see Figure 1).
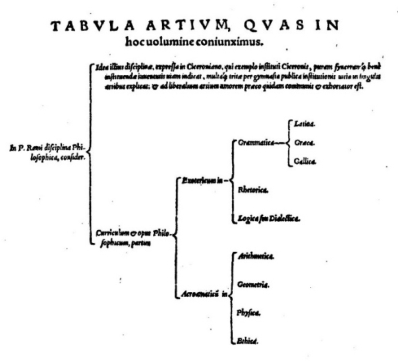
In the same vein, Petrus Ramus, in 1576, needed to understand the various forms that could represent the concept of knowledge, and created meth- ods through systems, thus managing to conceive formal education within a framework of efficiency and natural perfection, which was his purpose (see Figure 2).
Figure 1: Llull’ s Alphabet (Eco, 1995).Figure 2: The chart is titled “Tabula Artium quas in hoc uolumine coniunximus” (Ramus and Freig, 1576).
Visual Thinking Through Diagrams 33
Ramus specialized in the principles of order and increasing complexity, dichotomies, distribution and arrangement, and other diagrammatic opera- tions, bringing all this knowledge together in bifurcated, arborescent-type spatial models (Do Ó and Paz, 2019).
The maps Ramus developed allow for quick perception of a whole and were therefore his preferred means of planning and distributing the concepts and content of the learning developed. In other words, he created a model of representation and organization, which allowed him to place the teacher as the decision-maker and driver of proven, established, and useful knowledge. The ramism model uses the concepts of analysis and synthesis, coming from geometry, and therefore resorts to graphical representation, on a sheet of paper, in a diagrammatic tree format, challenging the student to perceive beyond what the image gives him, thus being able to see the subject (Sellberg, 2020). Until then, there was no technology capable of creating such favorable conditions for memorization and mimicry.
Ramism should be understood as the movement that made the objective departure from the traditional oral dialogue possible, by providing a set of discursive practices to the objective reality of the didactic process (Do Ó and Paz, 2019).
Diagrams thus became the organizational basis of textbooks, starting to confer audible environments and visible objects to students, contributing to the significant mutation in knowledge and communication. Thanks to ramism, dialogue left room for visual thinking, as a union of all kinds of objects, which our eyes can grasp.
This form of learning involves creativity and creative thinking, and cre- ativity is defined as the cognitive ability to develop something new, this definition comes mainly from the research of J. P. Guilford in the 1950s (Tsch- immel, 2022). Guilford brought out in the psychometric approach, divergent thinking, dubbed by himself, where the principle of a problem will not have only one solution, because divergent thinking goes through different directi- ons, generating multiple solutions to that same problem, unlike convergent thinking (Landau and O’ Hara, 2012).
This approach enabled him to create a series of tests that quantify divergent thinking by scoring responses on four key dimensions: originality, fluidity, flexibility, and elaboration. In his framework model of intelligence, Guilford combines three fundamental dimensions of intelligence: content, which is the types of information or data involved; products, or results of applying ope- rations to a content; and operations, of which there are six types, including memory, cognition, and evaluation; all of which contribute to convergent and divergent outcomes (Batey and Furnham, 2006).
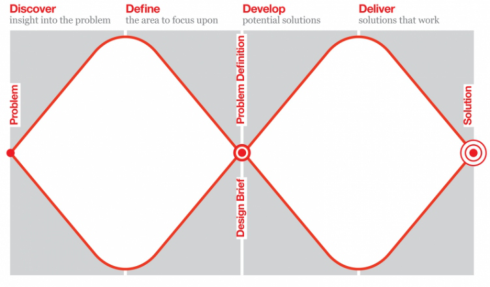
The notion of divergent and convergent thinking had been seen before, in the 1970s, in the work of John Chris Jones and Victor Papanek, where we find the root of the diamond-shaped diagram. But these models had not been widely shared, which is part of the reason for the Design Council to create the Double Diamond (see Figure 3).
As can be seen in the diagram, creative thinking needs the production of convergent and divergent thoughts to find possible solutions to the pro- blem, it is the visual representation of the design and innovation process. It
Figure 3: Double Diamond model (Design Council Double Diamond, created in 2004).
becomes the simplest way to describe the stages of any project, regardless of the methods and tools used.
In 2020, Jonathan Ball gave a talk at the 7th EIMAD about the pheno- menon that this diagram, where he shows us the main stages of any design process and commented on the development. Ball was part of the multidi- sciplinary team at Design Council, eventually helping to polish the Double Diamond between 2003 and 2004.
In this lecture Ball recalled the words of Richard Eiserman, Director of Design and Innovation at the Design Council at the time, who initiated the project that led to the realization of the Double Diamond diagram: “The team put in the work trying to define design, process, methods, etc. What we did with the Double Diamond was codify it, rename the steps, and popularize it. It was important work, but we were certainly standing on the shoulders of giants” (Ball, 2020). For this diagram arises in a consequence of events that Eisermann had contact, namely, when exposed to the diagram deve- loped at IDEO and presented by Dave Duncanson, where one could see a rhombus, with a tail composed of small progressively smaller rhombuses; or when exposed to an identical diagram, at Whirpool where he works before the Design Council, presented by Gary Hamel, as a way to frame the com- pany’s innovation, containing names of the four steps different from those presented in the Double Diamond model (Ball, 2019).
This diagram has become universally accessible and representative of the design process and is now used and referenced all over the world.
In short, diagrams are useful tools to visualize information, helping to bet- ter convey the message to the receiver by simplifying it into visual elements that can be understood by anyone.
Explanatory Case Study There are many examples that could be covered here. Several authors have been collecting and cataloguing the various types of diagrams, as is the case of Manuel Lima, creator of the website Visual Complexity (Lima, no date) and the books Visual Complexity: Mapping Patterns of Information; The
Visual Thinking Through Diagrams 35
Book of Trees and The Book of Circles, where he explains various types of shapes, meanings and visual elements used to convey the purpose of the diagram. Another example is the book Visualizing Complexity, where the authors aim to help understand the complexity, we find ourselves in, through visual communication systems, called modular information design (MID), by cataloguing and allowing various visual forms to be combined. The MID is divided into four top-level modules: data dimensions (yellow), schematic dimensions (blue), visual dimensions (red), and structuring dimen- sions (green). Putting the last three dimensions together forms 80 clearly identifiable elements.
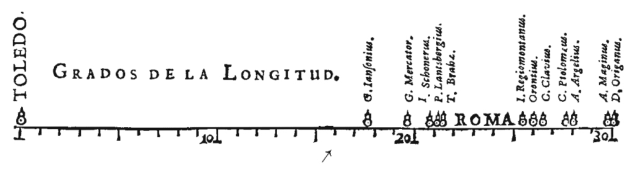
“Using a simple framework, it is possible to encode not only all known diagram types also a nearly infinite number of new visualizations. This system can be understood as a visual algorithm.” (Hil and Lachenmeier, 2021, p. 11) We will use MID to analyse and decode existing visualizations, starting with one of the first visual representations of statistical data, the diagram drawn by Michael Florent van Langren in 1644, demonstrating 12 various distance estimates between Toledo and Rome (see Figure 4).
What we can see is that Toledo is in the first meridian of 0
, in compari- son with Rome which occupies the interval of 4 meridians, from 22 to 25. With this we can already see that Langren’s scale is too wide and maladju- sted, besides the fact that the known distance from the earth today is 16
30’ and can never reach 30
. But, as Tufte (1997) points out, this diagram was quite advanced for its time, with several spatially organized quantity estima- tes. He used the opinions of astronomers and cartographers to develop these space estimates but received criticism even then for the irregularities of the distances.
Based on MID we can state that this diagram uses two visual forms of the schematic dimensions module, the points in space - One coordinate axis, from the Position subdivision, represented by the points that appear on an axis as a scale; and the area size, from the Quantity subdivision, represented by the visual size that the city names of Toledo and Rome occupy on that axis, compared to the other names, as well as, to each other.
But despite the distance scale not being the correct one, being one of the disadvantages pointed out by Hil and Lachenmeier (2021), in relation to this visual method, this diagram was able to convey a visual perception about the distance between these two cities, at a time when knowledge was more limited, and the perception of time and space was different.
Figure 4: Michael Florent van Langren, La Verdadera Longitud por Mar y Tierra (Antwerp, 1644 apud Tufte, 1997).
It contributed to the statement of purpose and contributed to the creation of the idea of scale, represented visually.
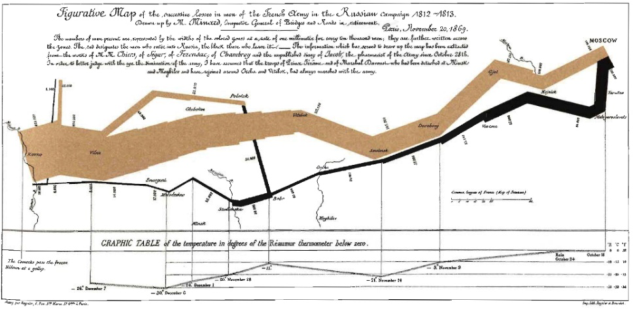
Another classic diagram is that of Charles Joseph Minard, drawn in 1869, with the purpose of demonstrating the terrible fate that Napoleon’s army would meet in Russian territory (Tufte, 2001) (see Figure 5).
Starting on the Polish-Russian border, the size of the army contrasts with the timid line of demarcation of the coast. Through the golden line, we can see that the army begins the invasion of Russia with about 422,000 men in June 1812, and it is not until September that they arrive in Moscow with about 100,000 soldiers.
This diagram at once depicts six variables: the size of the army, its loca- tion on a two-dimensional surface, direction of the army’s movement, and temperature at various dates during the retreat from Moscow.
The path of retreat, which is represented by the darker line below the golden line, is directly related to a temperature scale and some important dates.
Thanks to this diagram it is possible to perceive the dimension of the human effort necessary for an invasion of this dimension, in the middle of winter, where many of these soldiers froze to death. It is also possible to perceive the movements of auxiliary troops, who sought to protect the flank and the rear of the enemy army’s advance.
As Katz (2012) further states, this map-like diagram by Minard integrates four types of information design: (1) Space, in this example represented by the route that Napoleon’s troops took, as well as the consistent and precise scale of the geographical references; (2) Time, only represented in the return, using the introduction of dates, demonstrating the speed of the army and the distance that was traveled; (3) Relation between number of troops, demon- strating in conjunction with temperature and the amount of men lost; (4) Events, indicating the reinforcements of troops needed, through river cros- sings during the brutal winter on the way home, mainly on the Berezina River, a current synonym of catastrophe for the French.
Figure 5: Figurative Map of the excessive losses in mon of the French Xeny in the Russian Campain 1812-1813 (Katz, 2012).
Visual Thinking Through Diagrams 37
Based on the MID, we can state that this diagram uses a mixture of several visual methods, among them, points in space - geographic coordinates (from the schematic dimensions module, Position subdivision), represented by the route taken by the soldiers, as if they were geographic coordinates, and the points in space - Two Coordinate axes, represented by the centigrade degrees axis and the time axis, where the temperature at a given moment is percei- ved, relating directly to the non-hierarchical network (from the module of schematic dimensions, subdivision Relationship), represented by the conne- ction that exists between the degrees centigrade felt at a given moment and the amount of living men returning to their homes, and also, Line Color and Line thickness (from the module of visual dimensions, subdivision Lines), represented by the difference in colors of the lines, being able to make a com- parison between the path to glory (golden) and the path to death (black); and by the thickness of the lines, representing the number of soldiers fighting at a given moment of the fight.
This diagram manages to captivate our attention and tell us a story from beginning to end, with only data and visual elements, demonstrating once again the power of graphics and diagrams. Of an enormous complexity of information, but with an incredible clarity of information, it may be the best diagram ever built.
RESULTS
We can see that there are several types of visual language schemes and that their use depends on the information and message we want to convey, being possible to use these types of schemes in an organized and combinable system. These visual modules have the ability to express complex concepts, making them perceptible to everyone, breaking barriers that verbal and written lan- guages hold. In this way, they become very useful tools for brands to use in communicating the intangible concepts that define them, both to their inter- nal and external stakeholders, cultivating and strengthening the brand image in their minds.
Thus, we can conclude that it becomes extremely relevant, the creation and addition of visual modules in visual identity systems as a tool for visual communication of a brand’s values and mission.
ACKNOWLEDGMENT
The authors would like to acknowledge CIAUD, Lisbon School of Archite- cture, Universidade de Lisboa, Portugal and FCT – Foundation for Science and Technology, for their financial support. This paper is part of the research for doctorate in design carried out by Rogério Ribeiro.
REFERENCES
Arnheim, R. (1969) Visual Thinking. University of California Press. Ball, J. (2019) ‘The Double Diamond: A universally accepted depiction of the design process - Design Council’, Design Council. Available at:
https://www.designcouncil.org.uk/our-work/news-opinion/double-diamond- universally-accepted-depiction-design-process/ (Accessed: 12 February 2023). Ball, J. (2020) ‘The Double Diamond. An icon or a cliche? - Jonathan Ball - 7th EIMAD’. Portugal: 7th EIMAD, ESART-IPCB. Available at: https://www.youtub e.com/watch?v=v_lF-dMEST4&ab_channel=eimadipcb Batey, M. and Furnham, A. (2006) ‘Creativity, intelligence, and personality: A cri-
tical review of the scattered literature’, Genetic, Social, and General Psychology Monographs, 132(4), pp. 355–429. doi: 10.3200/MONO.132.4.355–430. Bonnici, P. (2000) Linguagem visual: o misterioso meio de comunicação. Lisboa: DestArte. Costa, J. (1998) La esquemática: visualizar la información. 1st editio. Barcelona:
Paidós Ibérica, S. A. Cuevas, D. (2016) ‘Ramon Llull, la máquina de pensar’, Jot Down Cultural Magazine, October. Available at: https://www.jotdown.es/2016/10/ramon-llull-la-maq uina-pensar/ (Accessed: 4 February 2023). Dondis, A. D. (2003) Sintaxe da Linguagem Visual. 4a ed. São Paulo: Martins Fontes. Eco, U. (1995) The search for the perfect language. Blackwell. Erlhoff, M. and Marshall, T. (eds) (2008) Design dictionary: perspectives on design
terminology. Birkhäuser Verlag AG. Grady, D. (1993) ‘The Vision Thing: Mainly in the Brain’, Discover Magazine, 1 June. Available at: https://www.discovermagazine.com/mind/the-vision-thing-m ainly-in-the-brain (Accessed: 4 February 2023). Hil, D. and Lachenmeier, N. (2021) Visualizing Complexity. Birkhäuser Verlag AG. Katz, J. (2012) Designing Information: Human Factors and common sense in
information design. John Wiley & Sons, Inc. Klein, A. and Bevington, W. (2008) ‘Visualization’, in Erlhoff, M. and Marshall, T.
(eds) Design Dictionary: Perspectives on Design Terminology. Basel, Switzerland: Birkhäuser Verlag AG, pp. 443–444. Landau, C. and O’Hara, S. (eds) (2012) The Psychology Book. 1st Editio. New York: DK Publishing. Lima, M. (no date) visualcomplexity.com | A visual exploration on mapping com-
plex networks. Available at: https://www.visualcomplexity.com/vc/ (Accessed: 14 February 2023). Lupton, E. and Phillips, J. C. (2008) Graphic Design: The New Basics. New York: Princeton Architectural Press. MIT Research (1996) ‘Brain Processing of Visual Information’, MIT News, 19
December. Available at: https://news.mit.edu/1996/visualprocessing (Accessed: 4 February 2023). Munari, B. (2006) Design e Comunicação Visual: Contribuição para uma metodologia didática. 3a ed. São Paulo: Livraria Martins Fontes Editora, Ldta. Do Ó, J. R. and Paz, A. L. (2019) ‘DA UNIVERSIDADE QUINHENTISTA DE PARIS
PARA O MUNDO: CURRÍCULO E MÉTODO EM PETRUS RAMUS’, História da Educação, 23. doi: 10.1590/2236-3459/83768. Ramus, P. and Freig, J. (1576) Professio Regia: Hoc Est septem artes liberales, in Regia Cathedra Per Ipsum Parisijs Apodictico Docendi- genere Propositæ & Per. Basileia: Basileia: Sebastianum Henricpetri. Available at: https://books.google.pt/books?id=bG5EAAAAcAAJ&hl=pt- PT&pg=PP1#v=onepage&q&f=false Rato, J. (2010) ‘A evolução da comunicação visual no espaço público’, Convergências - Revista de Investigação e Ensino das Artes, III (5). Available at: http://convergencias.esart.ipcb.pt/?p=article&id=80 (Accessed: 23 December 2020)
Visual Thinking Through Diagrams 39
Sellberg, E. (2020) ‘Petrus Ramus’, in Zalta, E. N. (ed.) The Stanford Encyclopedia of Philosophy. Winter 202. Metaphysics Research Lab, Stanford University. Available at: https://plato.stanford.edu/archives/win2020/entries/ramus/ Silva, J. C. R. P. et al. (2012) ‘Identidade visual e sua relação com a linguagem não ver-
bal’, Convergências - Revista de Investigação e Ensino das Artes, V (9). Available at: http://convergencias.esart.ipcb.pt/?p=article&id=119 Tschimmel, K. (2022) ‘Creativity, Design and Design Thinking—A Human-Centred ménage à trois for Innovation’, in Raposo, D., Neves, J., and Silva, J. (eds) Perspe- ctives on Design II. Springer Series in Design and Innovation. Springer Nature, pp. 3–17. doi: 10.1007/978-3-030-79879-6_1/COVER. Tufte, E. R. (1997) ‘Visual Explanations: Images and Quantities, Evidence and
Narrative.pdf’. Graphics Press LLC. Tufte, E. R. (2001) The visual display of quantitative information. 2nd editio.
Graphics Press LLC. doi: 10.2307/530384. Yin, R. K. (1994) Case Study Research-Design and Methods. 2nd ed., Applied Social Research Methods Series - Volume 5. 2nd ed. SAGE Publications, Inc.
LISTED IN THE AHFE DIGITAL BOOKSTORE CATALOGUE
Explore the complete digital volume
Human Dynamics and Design for the Development of Contemporary Societies
Read this individual research paper free through the original publisher, or explore the full digital proceedings book.
ISBN 978-1-958651-57-5
Explore this ISBN in the AHFE Bookstore ↗Listed in the July 2026 bookstore catalogue; search by ISBN to confirm current availability · Digital book purchase optional