Ziling Feng, Peng Ji (2023). Cognitive friction measurement: Interaction assessment of interface information in complex information systems. In: Human Factors and Systems Interaction. AHFE Open Access, vol. 84, pp. 27–36. https://doi.org/10.54941/ahfe1003587
The level of Cognitive Load (CL), which is used to react to the level of cognitive friction, is typically utilized in the study of user cognitive friction. Complex Information System (CIS) interactions include both informational and operational interaction behaviors, and Information interaction is regarded as a critical aspect in defining the quality and efficacy of system functionality. TIn order to assess Cognitive Friction (CF) and inform ensuing interface design improvement, this paper integrates numerous CL assessment aspects. First, a conceptual framework for the method is built by examining measuring metric differences and integrating them through literature research, which is then combined with the user research process in design. Second, using this framework as a reference, a comparative experiment on user CF measurement was carried out by fusing eye tracking with the cause and assessment factors of CL. Ultimately, the user was provided with the CF index under the multidimensional dimension using the Fuzzy Comprehensive Evaluation (FCE). The findings demonstrate that the Multidimensional User Cognitive Friction Measuring (MUCFM) approach may more accurately capture the degree of CF in the information interaction of CIS interfaces. The viability of the comparative integration method is confirmed by eye tracking tests.
Information systems have evolved from a single function-oriented system to a Complex Information System (CIS) with multiple users, scenarios, and tasks, and digital interfaces have become a crucial component of Human- Computer Interaction (HCI) with the growth of the Internet industry and digital information intelligence technology (Zhou and Zheng, 2019). The user’s capacity to make judgments is impacted by how information elements are displayed in a digital interface (Xia, 2019). Because CIS involves seve- ral users, multiple scenarios, and multiple tasks, the emphasis of study in the field of HCI has evolved from traditional interface design to the com- prehension and assessment of user experience based on psychological traits (De Oliveira et al., 2012). According to Alan Cooper, it is a phenomena of
subpar HCI interface design brought on by information inflation as a result of developing information technology (Ehrensberger and O’Brien, 2015). Alan Cooper et al. conceived it as Cognitive Friction (CF) and applied it to the field of interaction design (Ehrensberger and O’Brien, 2015). Noneth- eless, in pertinent studies, the quantity of Cognitive Load (CL) is frequently utilized to describe the degree of CF. One of the fast evolving ideas inte- racting with HCI theory is Cognitive Load Theory (CLT), which is based on the representational or semantic complexity of interactive tasks (Sweller, 2011). The CL measures the amount of personal mental resources that can be applied to a task or problem at any given time (Sweller, 2011; Blessinger and Comeaux, 2020). In order to maximize instructional design, CLT is frequen- tly utilized as a guide (Paas and van Merrinboer,1994; Pollock et al.,2002; Renkl,2005; Kirschner et al., 2006). It has since been utilized in HCI resea- rch to examine the dependability and effectiveness of user interaction tasks in digital interfaces (Wright et al., 2016; Al Ghalayini et al., 2020). It is regarded as a control variable in testing circumstances (Minkley et al., 2018; Nehring et al., 2012).
The design component of the CIS’s digital interface is now still mostly separate from the usability evaluation component (Chen, 2022). The incor- poration of CL assessment into the design process is a new issue for designers of digital interfaces as CIS grow more multi-user, multi-scenario, and multi- tasking (Jonathan, 2022). A recent trend is also emerging in the choice and fusion of cognitive load research methodologies with current conceptual fra- meworks. In order to assess the success of digital interface interactions and direct further interface design optimization, this study suggests a Multidimen- sional User Cognitive Friction Measure (MUCFM), based on the integration of numerous CL measurement aspects and design processes. By compa- ring trials and eye movement assessments, the viability of the comparative integration method was confirmed.
METHOD
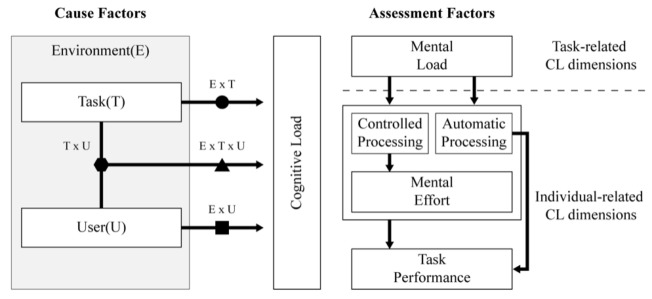
The Combination of CLT Frame and the Double Diamond The causal and assessment components of CL were separated in the CLT framework (Pass and van Merrinboer, 1994). User attributes (previous kno- wledge, cognitive capacity, motivation, and affect) and task environment are causal factors (task complexity and time pressure). The working task and the physical environment were segregated into the task environment dimension of the causal factors in a recent modification (Choi et al., 2014). Asses- sment factors were divided into task-related CL dimensions (mental load) and individual-related CL dimensions (mental effort and task performance) (Paas and van Merriënboer, 1994; Choi et al., 2014; Krell, 2017; Skuballa et al., 2019). The amount of cognitive resources needed to solve the problem is referred to as the mental load, while the actual cognitive resources used in the problem-solving process are referred to as the mental effort (Minkley et al., 2021). Figure 1 illustrates how the CLT framework has been adjusted appropriately for use in measuring CF.
Cognitive Friction Measurement: Interaction Assessment of Interface Information 29
Figure 1: CL as reflected by causal factors and assessment factors, including two- and three-way interactions between the causal factors (adapted for design thinking from Choi et al., 2014, p. 229).
In the phases of requirements formulation and interaction design of the product development process, the British Design Council suggested the stru- ctured design technique known as “The Double Diamond”(Jonathan, 2019). The Double Diamond combines CLT with the design process by enabling the breakdown of the thought process and making the design thinking process visible.
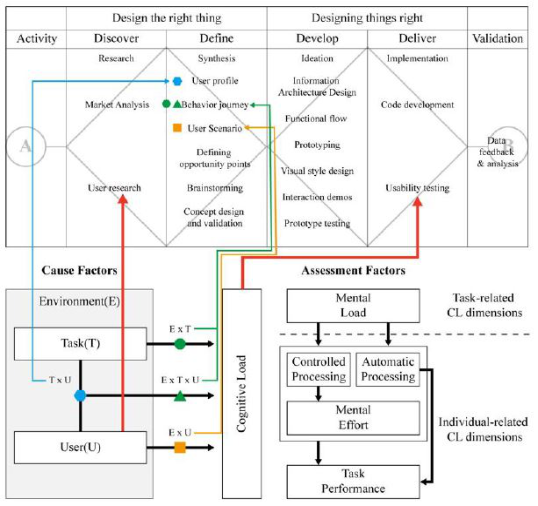
The dimensions and data related to the CL causative factors can be acces- sible and initially analyzed through the design process, as shown in Figure 2. Among the causal factors:
Figure 2: Post-integration framework, including a general flow of HCI using The Double Diamond and combined with the CLT framework (adapted from Figure 1).
30 Feng and Ji
(1) User research can be used to gather and evaluate user characteristics (U); (2) U x T: ability to assess the match between user characteristics and design solutions through the user profile; (3) E x T & E x T x U: observe user behavior journey during research to analyse the relationship between the physical environment, task and user, and to make a preliminary assessment of the user’s CL in the scenario; (4) E x U: matching user characteristics through the conception and creation of usage scenarios.
Therefore, doing a preliminary evaluation of the user’s CL before the design solution is implemented is theoretically possible.
Methods for Measuring CL in HCI The existing methods for measuring CL could be roughly classified along two dimensions: objective vs. subjective measures and direct vs. indirect measures (Jiang and Kalyuga, 2020). In the first dimension, it is determined “whether the methods use subjective, self-reported data or objective observations of behavior, physiological conditions, or performance,” and in the second, it is determined “methods based on the type of relation of the phenomenon observed by the measure and the actual attribute of interest” (Bru¨nken et al., 2003). The measures are screened by combining direct and indirect, subjective and objective factors. Studies have also demonstrated that the effectiveness
Table 1. Statistics on CL measures.
Table available in the original PDF paper.
Objective Subjective Direct refer to the methods that can objectively measure user characteristics that are directly related to CL when it is happening. Dual-task technique (Skulmowski and Rey, 2017), eye tracking (Harada and Ohyama, 2021), fNIRS (Curtin and Ayaz, 2017) etc.
including learners’ rating of the experienced difficulty of the materi- als or exerted mental effort (Kalyuga et al., 1999) NASA-TLX (Yan et al., 2021), DALI (Braun et al., 2019), Pass Mental Effort Scales (Hwang et al., 2019), Digital Reading Cognitive Load Scale (Huang et al., 2020), PAD Affective Scales (Wang et al., 2022) etc. Indirect depends on objective indicators
rely on users’ ratings of subjective experiences (Bru¨nken et al., 2003). Self-reported stress levels (Bru¨nken et al., 2003)
that track processes that are thought to be influenced by CL (Bru¨nken et al., 2003). Galvanic Skin Response (GSR) (Morra et al., 2019), EEG (Emami and Chau, 2020), task performance etc.
Cognitive Friction Measurement: Interaction Assessment of Interface Information 31
of the direct and indirect measures (such as the ECG) in the table are compa- rable and follow the same similar trend (Korbach et al., 2018; Minkley et al., 2021). In order to prevent too complex user research and other factors, ease of operation was included to the selection criterion in order to better inte- grate the design process. Due to the necessity for more effective integration of cognitive friction evaluation aspects into the design process, the MUCFM is proposed in Figure 2 by combining many dimensions of measurement.
Lastly, Table 2 displays the chosen measurement factors and methods along with the related dimensions.
Table 2. MUCFM framework.
Table available in the original PDF paper.
Specifics Methods Academic Self-Concept of Ability (ASCA)
Causal factors
Questionnaire
ASCA Scales, modification of the DISC-Grid (Minkley et al., 2014) Self-reporter stress levels Visual Analogue Scale (Luria, 1975) User characteristics (demographics, interests, etc.)
Assessment factors
Mental load and mental effort The StuMMBE-Q instrument (Krell, 2015; Krell, 2017) and Dual-task technique (Skulmowski and Rey, 2017) Task performance Recording times and calculating correct rates Statistical analysis of scale scores, Scale Reliability Testing and Cognitive Friction Index Mean & Standard Deviation, Cronbach’s α, Fuzzy Comprehensive Evaluation (FCE)
Quantification methods
Two applications exist for MUCFM:
1. Design without previous programmes: evaluation of CF levels for design solutions through study of measurement data obtained during the design phase; The degree of usability (the amount of cognitive friction, which also reflects the behavioral gap between the user and the design solu- tion (e.g., system or interface)) will be temporally grasped by the design process, reducing CF from asymmetries in the mental model; 2. Design with optimising and updating: based on the excesses in the mea- sured indicators of MUCFM, evaluates the CF level and then adjusts it for design optimization by extrapolating back to design variables along Figure 2.
EXPERIMENT AND DISCUSSION Experiment Method
Eye tracking is a direct, objective measurement that has little effect on the experimental procedure, hence it was chosen for the comparative experiment
32 Feng and Ji
(Harada and Ohyama, 2021). Through the application of a specific case study, the results of the MUCFM and eye-tracking tests were compared.
The experimental material is derived from a project on multi-information monitoring for high-speed trains. The project focused on the design and optimization of the web side of a multi-messaging platform for high-speed trains.
The application of the MUCFM approach in the current investigation belongs to the before described second category. Therefore, by taking CF measurements on existing programs, it was possible to compare whether the method is able to measure user CF levels more precisely in a realistic CIS.
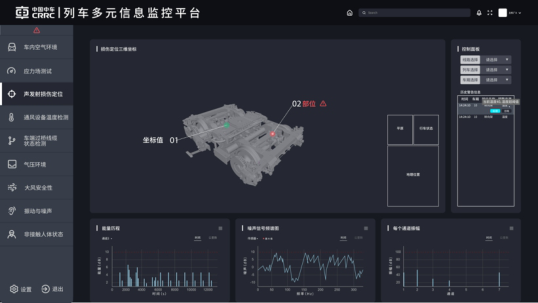
One of the digital interface for the platform is displayed, as shown in Figure 3.
Subjects Ten participants—five men and five women—mostly university students and researchers, ranged in age from 20 to 26 years old, weren’t colorblind and had normal visual acuity (corrected vision). Because to the negative effects of tiredness on CL, potential volunteers who were sleep deprived and who reported feeling exhausted were disqualified from the testing.
Experiment Process The ergonomic digital multimedia lab at the college was selected for the stu- dies based on the typical setting in which CIS is actually used, where the total experimental setting is comparable to the setting in which CIS is usually ope- rated. An eye-tracking device, the Tobii Eye Tracker 5, was used to collect data for comparison purposes.
The test task was given to the participants after they had undergone oculo- motor calibration. Meanwhile, participants filled out a demographic survey (gender, age), which contained two scales for gauging ASCA and interest (Wilde et al., 2009; Minkley et al., 2014).
Participants completed a number of tasks that were all relevant to the sub- ject of the data analysis and had the same structure and substance (e.g.,
Figure 3: One of digital interfaces of CIS in experiments.
Cognitive Friction Measurement: Interaction Assessment of Interface Information 33
plurality of data in different forms, result-oriented judgments, etc.). The dual-task technique was used to set up a dual task during the experiment. In the ‘judgement task’, participants had to identify and select the correct name or true statement about the content and process of the described data analysis from several answer options (i.e., the single best answer format). In the ‘indicator/assessment task’, participants must judge and answer the question in a short written text (i.e., a constructed response format). The sort of representation used in these tasks also varies (half of them use pure symbolic representations, the other half use symbolic-textual representations) (Minkley et al., 2018).
After completing the task, subjects filled out the StuMMBE-Q instrument (Krell, 2015; Krell, 2017) and selected their perceived stress on a visual ana- logue scale (Luria, 1975). The area of visual attention, duration, and reaction time were continually measured using an eye-tracking equipment (tobii eye tacker5).
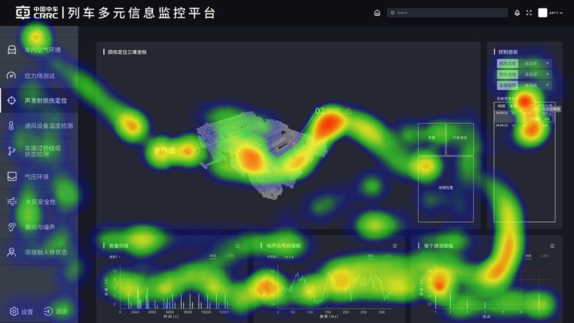
Result and Analysis The area of visual focus, duration and reaction time were obtained by eye tracking. A high level of cognitive load can be thought of when the area of visual focus is larger, the gaze duration is longer, paired with the slower reaction time during task execution (Korbach et al., 2018). After removing incoherent trajectories, the figure illustrates how the prevalence of green and red focus points corresponds to an increase in reaction time. It follows that the relevant elements raise the CL of the interface. Considering all of the heat map data, the CIS system as a whole has a medium CF.
The MUCFM scales and other data were assessed for reliability, and the Cronbach’s alpha coefficients for all of them were above 0.7, allowing for their usage. The set of factors for FCE are scores of the self-report stress levels, ASCA, and user characteristics. The evaluation set for FCE is composed of scores for mental load, mental effort, and task performance. The factors’ weights were determined to be A = {0.25, 0.2, 0.25, 0.3}. The resultant
Figure 4: One of illustration of eye movement thermogram in experiments.
34 Feng and Ji
Equation reproduced from the original PDF.
1∗m (1) We set the scores for excellent, good, fair, poor, and extremely poor levels of cognitive load to 100, 75, 50, 25, and 0, respectively. In the present experi- ment, we obtained S = {100, 75, 50, 25, 0}. The CF score for this CIS system has been calculated to be 71.5. The score of 71.5 is generally close to good in the evaluation, echoing the moderate level obtained for eye tracking, which indirectly validates the feasibility of the measure.
CONCLUSION AND FUTURE WORK MUCFM was designed by integrating multiple CL measurement dimensions with the design process. Based on eye-tracking, the approach’s viability is shown, and a fixed score is provided for CF, which makes it simpler to assess the extent of the situation. When the scores of CF is high, it is possible to determine the root cause from the data since the measuring method contains a design thinking framework, allowing for focused changes and reducing the expense of subjective judgment and repeated trial and error. A complete design loop is formed from design to test, thus empowering designers and building a platform for smooth communication between people and systems. Due to time constraints, the design validation has not yet been conducted, so further research will be conducted on the design validation of MUCFM in the next step.
ACKNOWLEDGEMENT
The authors would like to acknowledge the financial support from the Natu- ral Science Foundation of Hunan Province (Grant number 2022JJ40064).
REFERENCES
Al Ghalayini, M., Antoun, J., and Moacdieh, N. M. (2020). Too much or too little?
Investigating the usability of high and low data displays of the same electronic medical record. Health informatics journal, 26(1), pp. 88–103. Blessinger, K., and Comeaux, D. (2020). User experience with a new public interface for an integrated library system. Information Technology and Libraries, 39(1). Braun, M., Broy, N., Pfleging, B., et al. (2019). Visualizing natural language
interaction for conversational in-vehicle information systems to minimize driver distraction [J]. Journal on Multimodal User Interfaces, 13(2), pp. 71–88. Bru¨nken, R., Plass, J., and Leutner, D. (2003). Direct measurement of cognitive load in multimedia learning. Educational Psychologist, 38, pp. 53–61. Chen, H. L. (2022). Research progress, hot spots and trends in the application of
cognitive load in interface design. Design, 01, pp. 44–47. Curtin, A., and Ayaz, H. (2017). Cognitive considerations in auditory user interfaces: Neuroergonomic evaluation of synthetic speech comprehension[C]//Harris D. Engineering Psychology and Cognitive Ergonomics: Performance, Emotion and Situation Awareness. German: Springer, Cham, pp. 106–116.
Cognitive Friction Measurement: Interaction Assessment of Interface Information 35
De Oliveira, R., Cherubini, M., and Oliver, N. (2012). Influence of Usability on Customer Satisfaction: A Case Study on Mobile Phone Services. Law E L-C, Abrahão S, Vermeeren P. O. S, et al. International Workshop on the Interplay between User Experience (UX) Evaluation and System Development (I-UxSED 2012). Leicester : Audio Visual Services (AVS), University of Leicester, UK, 2012, pp. 14–19. Ehrensberger, D. M., and O’Brien, S. (2015). Ergonomics of the translation work-
place: Potential for cognitive friction. Transl. Spaces, 4, pp. 98–118. Emani, Z., and Chau, T. (2020). The effects of visual distractors on cognitive load in a motor imagery brain-computer interface. Behavioural brain research, 378, pp. 112240. Harada, Y., and Ohyama J. (2021). Quantitative evaluation of visual guidance effects
for 360-degree directions. Virtual Reality, pp. 1–12. Huang, C. L., Luo, Y. F., Yang, S. C., et al. (2020). Influence of students’ learning style, sense of presence, and cognitive load on learning outcomes in an immersive virtual reality learning environment. Journal of Educational Computing Research, 58(3), pp. 596–615. Hwang, G. J., Hsu, T. C., and Hsieh Y. H. (2019). Impacts of different smartphone
caption/subtitle mechanisms on English listening performance and perceptions of students with different learning styles. International Journal of Human–Computer Interaction, 35(4-5), pp. 333–344. Jiang, D., and Kalyuga, S. (2020). Confirmatory factor analysis of cognitive load ratings supports a two-factor model. The Quantitative Methods for Psychology, 16(3), pp. 216–225. Jonathan, B. (2019). The Double Diamond: A universally accepted depiction of the
design process. The Design Council Website: https://www.designcouncil.org.uk/o urwork/news-opinion/double-diamond-universally-accepted-depiction-design-p rocess/. Jonathan, E. (2022). Reimagining the Role of Friction in Experience Design. Journal of User Experience, 16(2), pp. 131–139. Kalyuga, S., Chandler, P., and Sweller, J. (1999). Managing split-attention and redun-
dancy in multimedia instruction. Applied Cognitive Psychology, 13, pp. 351–371. Kirschner, P. A., Sweller, J., and Clark, R. E. (2006). Why minimal guidance during instruction does not work: an analysis of the failure of constructivist, disco- very, problem-based, experiential, and inquiry-based teaching. Educ. Psychol. 41, pp. 75–86. Korbach, A., Bru¨nken, R., and Park, B. (2018). Differentiating Different Types of
Cognitive Load: a Comparison of Different Measures. Educ Psychol Rev, 30, pp. 503–529. Krell, M. (2015). Evaluating an instrument to measure mental load and mental effort using item response theory. Sci. Educ. Rev. Lett. Res. Lett. 2015, pp. 1–6. Krell, M. (2017). Evaluating an instrument to measure mental load and mental effort
considering different sources of validity evidence. Cogent Educ. 4, pp. 1280256. Luria, R. E. (1975). The validity and reliability of the visual analogue mood scale. J.
Psychiatr. Res. 12 (1), pp. 51–57. Minkley, N., Ka¨rner, T., Jojart, A., Nobbe, L., and Krell, M. (2018). Students’ mental load, stress, and performance when working with symbolic or symbolic-textual molecular representations. J. Res. Sci. Teach. 55, pp. 1162–1187. Minkley, N., Westerholt, D. M., and Kirchner, W. H. (2014). Academic self- concept
of ability and cortisol reactivity. Anxiety Stress Coping 27, pp. 303–316.
36 Feng and Ji
Minkley, N., Xu, K. M., and Krell, M. (2021). Analyzing Relationships Between Causal and Assessment Factors of Cognitive Load: Associations Between Objective and Subjective Measures of Cognitive Load, Stress, Interest, and Self-Concept. Front. Educ. 6:632907. Morra, L., Lamberti, F., Pratticóf, G., et al. (2019). Building trust in autonomous veh-
icles: Role of virtual reality driving simulators in HMI design. IEEE Transactions on Vehicular Technology, 68(10), pp. 9438–9450. Nehring, A., Nowak, K., Upmeier zu Belzen, A., and Tiemann, R. (2012). Doing inquiry in chemistry and biology: the context’s influence on the students’ cognitive load. La Chimica nella Scuola IV, pp. 253–258. Paas, F. G. W. C., and Van Merrie¨nboer, J. J. G. (1994). Instructional control of
cognitive load in the training of complex cognitive tasks. Educ. Psychol. Rev. 6 (4), pp. 351–371. Pollock, E., Chandler, P., and Sweller, J. (2002). Assimilating complex information [J]. Learning and instruction, 12(1), pp. 61–86. Renkl, A. (2005). The Worked-Out Examples Principle in Multimedia Learning. The
Cambridge handbook of multimedia learning, pp. 229–245. Skulmowski A., and Rey G. D. (2017). Measuring Cognitive Load in Embodied Learning Settings. Front. Psychol. 8, pp. 1191. Sweller, J. (2011). Cognitive load theory. Psychology of learning and motivation, 55,
pp. 37–76. Wang, W. W., Ning, J., and Wui, T. (2022). Emotional Evaluation Method of User Perceptual Experience Based on the Perspective of Cognitive Load. Packaging Engineering. 43(04), pp. 147–155. Wilde, M., Bätz, K., Kovaleva, A., and Urhahne, U. (2009). U¨berpru¨fung einer Kurz-
skala intrinsischer Motivation (KIM). Z. fu¨r Didaktik der Naturwissenschaften 15, pp. 31–45. Wright M. C., Dunbar, S., and Macpherson, B. C., et al. (2016). Toward designing information display to support critical care. Applied clinical informatics, 7(04), pp. 912–929. Xia, X. (2019). A study of visual display design methods for uncertain meta-
information in digital interfaces of complex information systems. Industry Design, 152(03), pp. 74–75. Yan, K., Shao, J., Zhu, Z., et al. (2021). Display interface design for rollers based on cognitive load of operator. Journal of the Society for Information Display, 29(8), pp. 659–672. Zhou, J., and Zheng, J. J. (2019). Design thinking based interface design for complex
information systems. Industry Design, 156(07), pp. 148–149.
LISTED IN THE AHFE DIGITAL BOOKSTORE CATALOGUE
Explore the complete digital volume
Human Factors and Systems Interaction
Read this individual research paper free through the original publisher, or explore the full digital proceedings book.
ISBN 978-1-958651-60-5
Explore this ISBN in the AHFE Bookstore ↗Listed in the July 2026 bookstore catalogue; search by ISBN to confirm current availability · Digital book purchase optional