Amirreza Bagherzadeh, Farnaz Tehranchi (2023). The analysis of effect of visual cues in a binary decision making environment. In: Human Factors in Virtual Environments and Game Design. AHFE Open Access, vol. 96, pp. 123–132. https://doi.org/10.54941/ahfe1003874
In this study, we plan to answer the fundamental question of what factors affect the human utility function and decision-making strategy. Utility function is an internally assigned value to each state to reflect the satisfaction of moving to that state. Decision Time (i.e., Reaction Time) is the time required for a user to make a decision after observing the current state. The assessment of human decision-making and Decision time has been frequently discussed in the fields such as psychology, neuroscience, and ergonomics.One of the most commonly used experiments to analyze the decision-making process is the choice task, where a set of choices are presented to users, and they need to select one of these choices. For the purpose of this study, we consider only two choices and assign a probabilistic reward to each choice. The task is named “Bias Coin Flip Game”, a web-based coin flip game where one side of the coin is more likely to appear. In another word, the coin is biased. Users are not aware of this bias and are asked to win as much as they can in the course of 250 tries. Probability Learning studies have indicated that after a sufficient number of tries, people are capable of learning the bias. However, the number of tries needed to learn the bias, the time spent between each try (e.g., Decision Time), and the strategy (e.g., matching and maximizing) users would choose to follow are highly susceptible to the visual cues represented to users. We consider multiple factors such as (a) the hidden/unhidden Win rate, (b) showing four last recent coin results, and (c) the order of visual cues. We analyze the effect of these cues on decision-making strategy and decision-making time on different genders and age groups using Factorial ANOVA (i.e., a statistical experimental design to analyze the significance of each cue). Results indicate how each visual cue affects the decision-making strategy chosen by users to design an environment that optimizes the chance of the optimality of the decisions made by the user, avoids convergence to suboptimal strategies, and controls reflection on the utility function. Finally, we suggest the relationship between the complexity of the utility function and the decision time for each environment with different sets of visual cues.
Decision-making is a process that often involves uncertainty because the feed- back of some alternatives depends on factors that are unknown at the time of decision-making. Feedback, as defined by (Doherty & Balzer, 1988), is the information returned by the environment that enables individuals to compare their current strategy with an ideal one. This information can help individuals improve their judgments and reduce their commitment to incorrect decisions (Hogarth & Makridakis, 1981).
Incorporating uncertainty into decision-making involves weighing the values of each possible outcome based on their probability of occurrence. The expected value of a given alternative can be obtained by summing the weighted-probability values of each outcome. While the exact probability of an event is rarely known, it can be estimated in certain domains such as weather forecasting (Raftery, Gneiting, Balabdaoui, & Polakowski, 2005).
Studies have shown that human decision-making under uncertainty is often deficient compared to normative rational choice models. The relati- onship between feedback and utility is important in decision-making, but people often violate the axioms of utility theory, assess probabilities incor- rectly, and respond to probabilities nonlinearly (Baron, 2000; LeBoeuf & Shafir, 2005). Understanding the relationship between feedback and utility is essential for predicting and modeling decision-making (Wickens, Helton, Hollands, & Banbury, 2021). Human decision-making processes in a pro- babilistic environment are often studied using binary-choice tasks. In these tasks, subjects are given a decision-making scenario where only two options are presented and they must choose the option with the highest probability of success. The success probability of each option is determined using a Ber- noulli distribution, meaning that at each trial only one option is correct and has a success probability of “P.”Binary-choice tasks are favored for their sim- plicity and ease of minimizing unwanted variability, making them a popular approach for studying elementary decision processes (Erev & Barron, 2005). Therefore, in our work, we design a binary choice task. In binary-choice experiments, individuals are asked to predict the outcome of an event such as a coin flip, with the outcome biased towards one of the choices but not disclosed to the participants. Previous studies have investigated the impact of unknown bias on decision-making and prediction in binary-choice prediction tasks (Altmann & Burns, 2005; Bilda, Gero, & Sun, 2006). These studies found that participants tend to adapt their behavior to the relative reward rather than maximizing the expected reward, meaning they try to “match” rather than “maximize.” The effects of age on decision-making strategy after learning the bias have been the subject of conflicting findings in different probability learning studies. For instance, Derks and Paclisanu (1967)found that the ratio of children demonstrating a matching strategy is similar to the ratio of adults using the matching strategy. Meanwhile, Plate, Fulvio, Shutts, Green, and Pollak (2018) reported a higher maximizing rate in younger chil- dren (3-5 years old) compared to older children. However, Moran III and McCullers (1979) found that adults maximize rewards more effectively than children. Plate et al. (2018) conducted a comprehensive study comparing
The Analysis of the Effect of Visual Cues in a Binary Decision-Making Environment 125
adults and children to four decision-making models, with most adults and children matching the Combination model. Therefore in our work, we look into both Matching and Maximizing strategies.
Furthermore, the relationship between decision time and decision-making in binary-choice tasks has been limitedly studied. Krinchik (1974) found an inverse correlation between bias and decision time, suggesting as bias increases, decision time decreases. Simon and Craft (1989) also found that decision time improves as subjects identify and adopt the optimal strategy. Also, Miller (1998) found that responses in tasks with unequally probable stimuli and responses were faster and more accurate in high-probability trials compared to low-probability trials. In this work, we bridge the gap between analyzing the role of decision-making strategy and decision-making time in binary-choice tasks.
The impact of outcome feedback (OFB) on the accuracy and realism of forecasts has been studied to improve decision-making in uncertain situati- ons (Niu & Harvey, 2022), but providing more OFB did not lead to greater improvements and additional feedback was not necessary.
Multiple-cue probability learning (MCPL) refers to the process of learning to predict an outcome based on multiple cues in probabilistic situations. To make accurate judgments, three components must be learned: (a) the functi- onal relation between each cue and the outcome, (b) the optimal relative weighting of different cues, and (c) the best way to integrate them. Studies have found that when feedback is limited, for example, if only outcome feed- back is provided, improvements are only seen when the environment is simple and when feedback is combined with a long series of trials (Brehmer, Haga- fors, & Johansson, 1980). In this study, we aim to investigate the impact of visual cues on probability learning and decision-making strategies. We use 6 −2 factorial design and focus on the analysis of the effects of physical factors and visual clues to investigate decision-making improvement. Our study’s design includes experimentation with different visual cues (a) imme- diate feedback, (b) the last five occurrences, and (c) the overall performance of the participants in the task. We conducted a study using an existing task envi- ronment (Bagherzadeh & Tehranchi, 2022) and similar methods to (Shanks, Tunney, & McCarthy, 2002) which examined the effect of showing partici- pants their overall performance in a binary choice environment. Our study contributes to incorporating uncertainty into decision-making, binary-choice experiments design, and MCPL because we consider a wider range of visual cues and demographic attributes of the participants and also investigate the decision time.
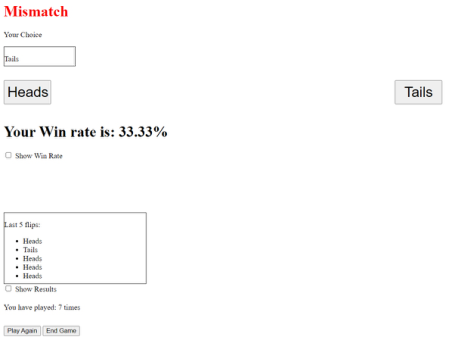
EXPERIMENT DESIGN In the biased coin flip game in Figure 1, the coin is not fair and heads have a higher probability of appearing than tails. Participants were asked to choose between heads or tails and aim to maximize the number of winning trials.
In the pilot study, we asked participants to play the game for 250 tries and recorded their actions (mouse movements), choices, and eye movements of 15 participants. Based on the eye gaze heat map and the performance of
126 Bagherzadeh and Tehranchi
Figure 1: The design of the biased coin flip game includes (a) visual feedback, (b) the user’s last choice text box, (c) two buttons for Heads and Tails, and (d) the win rate (e) a text area for the last previous coin flip results.
the participants, we identified the visual cues that participants utilized to make a decision. Then, we identified the immediate feedback and, results of the last 5 coin flip to be impactful. Also, Shanks et al. (2002) reported that overall a win rate indicator has a significant effect on the decision-making strategy. Therefore, these new findings in the pilot study help us design a new environment and define visual cues.
The game environment is redesigned using the Python library “Flask” and a preparation (welcome script) and demo of the environment are added. In the demo phase, participants are asked to navigate a page where they played the game with predetermined results, to ensure that no information about the bias is learned and they are just getting familiar with how to play the game. After completing the demo, participants played the game for 150 trials. Data on mouse movements, clicks, and choices were collected and analyzed.
We also observed in our pilot study that participants who spam click instead of thinking about what their next decision should be, maximize more and their decision time becomes significantly small. Therefore, we redesign the environment so that every time users choose either of the options, the cursor moves to the middle of the screen. This causes the users to think about what they want to play and their decision is not affected by the ease of just clicking rather than using the mouse and moving the cursor to the other option.
We focus on examining the impact of different types of feedback (cues) on the decision-making strategies of participants. Additionally, we also aimed to investigate the effect of participants’ demographic attributes such as edu- cation and gender, and specifically, how these attributes may interact with the different types of feedback being studied. As suggested by the litera- ture, it is hypothesized that education and gender may influence participants’ preferences for certain types of visual feedback.
Our study aimed to evaluate the effect of three visual cues, including (a) immediate feedback, (b) the outcome of the last five coin flips, (c) the overall
The Analysis of the Effect of Visual Cues in a Binary Decision-Making Environment 127
win rate, on the decision-making strategies, and decision time of participants, along with their demographic characteristics of participants such as gender and education.
2K-P Factorial Design A factorial design is a type of experimental design that is used to study the effects of multiple factors on a specific outcome. In this study, six different factors are analyzed, each with two levels. This resulted in a two-level facto- rial design. In order to conduct a non-replicated full factorial design, 26
participants (64 participants) would be required. However, we started with a fractional factorial design and only 16 participants participated in our study, and their data is used in our analysis. This is a common approach in expe- rimental design that aims to reduce the number of participants needed while still gathering meaningful results.
To analyze if any of these factors have a significant effect on either decision- making or decision time, an ANOVA test is performed. The factors and their levels are analyzed are summarized in Table 1. However, using a fractio- nal factorial design results in confounded effects. For example, factors (E) and (F) are confounded with the interactions of the (A, B, C) and (B, C, D), respectively (for the ease of notation, we rewrite the interactions as the com- bination of letters. For example (B, C, D) will be represented by “BCD”). Thus, the effects of the confounded factors are not separable and cannot be distinguished from each other. If a significant effect is observed in the data, the experimenter can then conduct an additional 16 participants to decou- ple the effects and find the importance of the factors. If no significant effects were observed from the confounded effects, the study can stop and find the importance of the factors by performing the ANOVA test. The fractional desi- gns are recognized based on their generators. And, the generators determine which effects are confounded with each other. Our design’s generators are (E = ABC and F = BCD). With this set of generators, the confounded effects of two-factor interactions are as follows: AB=CE AC=BE AD=EF AE=BC=DF AF=DE BD=CF BF=CD To evaluate the impact of the factors and their interactions, we use Daniel’s test (as described by (Daniel, 1959)) using R programming and the FrF2 library, which specializes in two-level fractional factorial designs. Daniel’s test highlights the significant effects with a 95% confidence level.
Table 1. The main factors that are considered in biased coin flip experimental design.
Table available in the original PDF paper.
Factor ID Level 1 (-1) Level 2 (1) Gender A Male Female Education B Undergraduate Graduate Win rate indicator C Unshown Shown Initial 20 trials discrepancy of the results D Unbalanced Balanced The last results indicator E Unshown Shown Bias value F 0.6 0.68
128 Bagherzadeh and Tehranchi
The participants are undergraduate, and graduate students from the Pennsylvania State University, with ages ranging from 18 to 32. Participants played the biased coin flip game for 150 trials and were compensated with a fixed amount of $5 for their participation. It was ensured that the number of trials was not significant enough for financial incentives to affect the par- ticipants’ decision-making strategy, as previously reported in the literature (Shanks et al., 2002).
RESULTS
The results of the study demonstrated a significant improvement compa- red to the pilot study without instruction and demo (t-test (15) = 3.3039, p < 0.005). The approach of including the preparation and demo phase had a positive impact on the outcome and helped participants navigate the task environment.
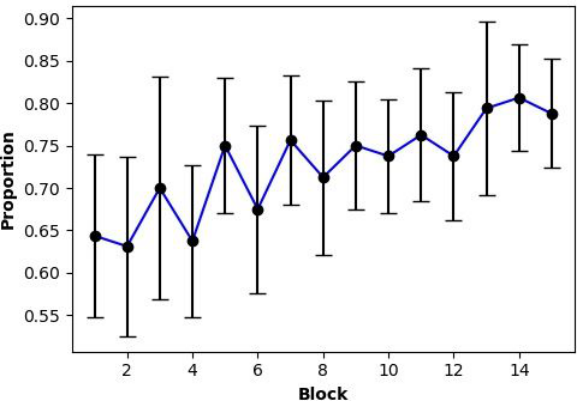
Figure 2 demonstrates the proportion of heads chosen by participants in each block of 10 trials. The heads proportion increased as they progres- sed through the game, indicating that participants were able to learn the bias (F(1,14) = 4.87, p < 0.05). The graph displays the average ratio across participants, along with a 95% confidence interval.
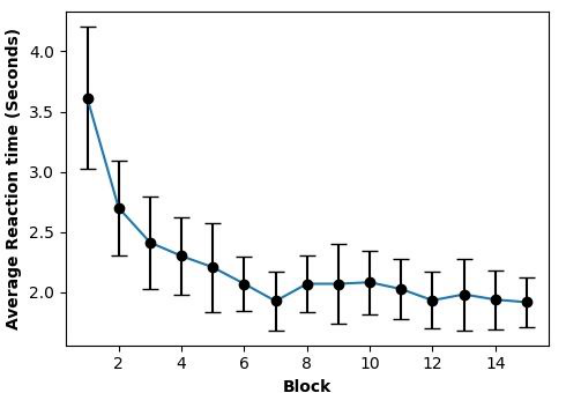
Figure 3 provides insights regarding the decision times of the participants, which shows a decreasing trend over the course of the game (F(1,14) = 5.04, p<.05). We considered only the last 30 trials as almost all the participants’ time became stable and did not deviate significantly. This result suggests that participants spent less time making a decision and therefore became more comfortable and confident in their decision-making strategy as they progressed through the game.
Figure 2: Proportion of heads played for each block of 10 trials with a 95% confidence interval.
The Analysis of the Effect of Visual Cues in a Binary Decision-Making Environment 129
Figure 3: Average decision times for each block of 10 trials with a 95% confidence interval.
Proportion of Heads The results of the Daniels’ test for the proportion of Heads show that the main factor C and the interaction of factors ACF have significant effects on the outcome. Further analysis using ANOVA (F(7, 8) = 7.622, p<0.006) con- firms that factors A, C, and the interaction of factors CF and ACF has a significant impact. To further explore the relationship between the factors and the outcome, a regression model was fitted to the data based on these effects. The adjusted R-squared for the model is 0.77. The result of the regres- sion model is summarized in Table 2. Among the aliases, we only considered the interaction with at least one factor with a significant effect.
The results of the Daniels’ test for reaction time indicate that the main factor A and the interaction between BF or CD had a significant impact on the data. The ANOVA test (F(4, 11) = 5.537, p < 0.02) confirms that factors A and BF or CD has a significant impact. Then, a regression model was fitted. The details of the model are presented in Table 3.
Table 2. The significant factors in the proportion of heads played in the last 30 trials.
Table available in the original PDF paper.
Factors Coefficient Values P-values C -0.07 0.001 A -0.037 0.0515 CF -0.07 0.051
Table 3. The significant effects on decision-making time in the last 30 trials.
Table available in the original PDF paper.
Factors Coefficient Values P-value A 0.25 0.02 BF or CD -0.32 0.006
130 Bagherzadeh and Tehranchi
ANALYSIS Proportion of Heads
In the binary choice task, any strategy which resembles maximizing more clo- sely is considered a better strategy. Because the closer the proportion of Heads chosen by participants to maximizing, the better their strategies as it becomes more similar to maximizing. This is the expected win rate strictly increases as the proportion of heads chosen increases. The interaction BF and its alias CD appeared to have a significant impact on the proportion of heads. Although further analysis is required to distinguish which interaction is responsible for the effect, the significance of the main effect suggested that CD was likely to be the source of the impact. To obtain a clearer understanding, further runs are necessary.
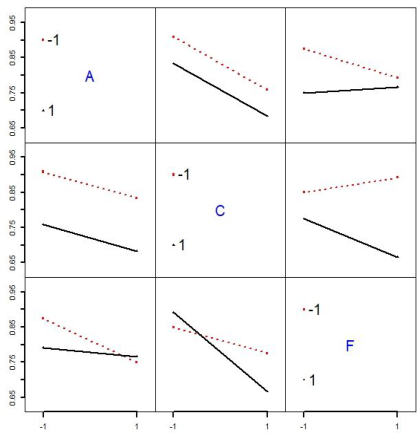
The results indicated that gender had a substantial role in developing a decision-making strategy. On average, male participants chose heads 2.1 times more in the last 30 trials (0.074 * 30) which indicated a better strategy because of the higher expected win rate. Gender also affected the standard deviation of the proportion, with the female proportion being more deviated compared to male data. Surprisingly, the win rate had the greatest negative effect on the proportion of trials in which heads were chosen. On average, participants with a shown win rate indicator played heads 4.2 times less (- 0.14 * 30) than their counterparts, potentially due to overthinking about a decrease in win rate and incorrect decision-making. The p value suggested that the interaction between the win rate indicator and the bias value has a significant effect on the proportion of heads being chosen (see Table 2). To further analyze the impact, interaction plots were generated (see Figure 4).
The plot demonstrates that when there is no win rate indicator and a more evident bias, the proportion of heads chosen by the user increases. The win
Figure 4: The interaction of gender (A), win rate (C), and bias value (F).
The Analysis of the Effect of Visual Cues in a Binary Decision-Making Environment 131
rate indicator decreases the proportion of heads played in the last 30 trials, with the effect being more significant when the bias is higher (bias values are presented in Table 1).
Decision Time The analysis of the decision time revealed that the average reaction time for the last 30 trials was 1.94 seconds. There were relatively fewer factors affe- cting decision time compared to the proportion of heads played. Nonetheless, gender still had a significant impact on the decision time, with male partici- pants having an average decision time that was 0.5 seconds faster than female participants. The effect of BF and its alias CD on decision time is not clear and requires further investigation. Additional runs are necessary to determine which of these factors is primarily responsible for the conflicting interaction effects on the decision time.
CONCLUSION AND FUTURE WORKS This study addresses a problem that covers several domains including uncer- tainty in decision-making, binary-choice experiments design, and MCPL. We considered a wider range of visual cues and demographic attributes of the par- ticipants in comparison to previous works and also investigated the decision time.
In summary, the results of our study show that both demographic attribu- tes and cognitive factors have a significant effect on the decision-making and decision time of participants. Upon our limited observation, Gender seems statistically effect both decision-making and decision time, with male partici- pants responding faster and choosing heads more often compared to female participants. The win rate indicator was also found to have a negative effect on the proportion of heads chosen and learning bias. However, the intera- ction of the win rate and the bias value was found to be significant. The results indicated that even though the win rate indicator overall has a negative effect, with a higher bias, this effect becomes significantly more evident. In order to obtain a more definitive outcome, additional data must be collected.
Additionally, our results suggest that less information and cognitive load lead to better decision-making. The decision time was found to be influe- nced by either the interaction of participants’ education and bias value or the interaction of the win rate and result of the last five coin flips. Further analy- sis is needed to determine the main significant factors and disentangle these confounded effects. This study highlights the importance of understanding the factors that influence decision-making and decision time and provides a foundation for further research in this area.
REFERENCES
Altmann, E. M., & Burns, B. D. (2005). Streak biases in decision making: Data and a memory model. Cognitive Systems Research, 6(1), 5–16.
132 Bagherzadeh and Tehranchi
Bagherzadeh, A., & Tehranchi, F. (2022). Comparing Cognitive, Cognitive Instance- Based, and Reinforcement Learning Models in an Interactive Task. Paper presen- ted at the Proceedings of ICCM-2022-20th International Conference on Cognitive Modeling. Baron, J. (2000). Thinking and deciding: Cambridge University Press. Bilda, Z., Gero, J. S., & Sun, R. (2006). Proceedings of the Annual Meeting of the
Cognitive Science Society. Brehmer, B., Hagafors, R., & Johansson, R. (1980). Cognitive skills in judgment: Subjects’ ability to use information about weights, function forms, and organizing principles. Organizational Behavior and Human Performance, 26(3), 373–385. Daniel, C. (1959). Use of half-normal plots in interpreting factorial two-level
experiments. Technometrics, 1(4), 311–341. Derks, P. L., & Paclisanu, M. I. (1967). Simple strategies in binary prediction by children and adults. Journal of Experimental Psychology, 73(2), 278. Doherty, M. E., & Balzer, W. K. (1988). Cognitive feedback. In Advances in
psychology Vol. 54, pp. 163–197: Elsevier. Erev, I., & Barron, G. (2005). On adaptation, maximization, and reinforcement learning among cognitive strategies. Psychological Review, 112(4), 912. Hogarth, R. M., & Makridakis, S. (1981). The value of decision making in a complex
environment: An experimental approach. Management Science, 27(1), 93–107. Krinchik, E. (1974). Probability effects in choice reaction time tasks. Perception & Psychophysics, 15, 131–144. LeBoeuf, R. A., & Shafir, E. B. (2005). Decision Making: Cambridge University Press. Miller, J. D. (1998). The measurement of civic scientific literacy. Public understanding
of science, 7(3), 203. Moran III, J. D., & McCullers, J. C. (1979). Reward and number of choices in children’s probability learning: An attempt to reconcile conflicting findings. Journal of Experimental Child Psychology, 27(3), 527–532. Niu, X., & Harvey, N. (2022). Outcome feedback reduces over-forecasting of infla-
tion and overconfidence in forecasts. Judgment and Decision Making, 17(1), 124–163. Plate, R. C., Fulvio, J. M., Shutts, K., Green, C. S., & Pollak, S. D. (2018). Probability learning: Changes in behavior across time and development. Child development, 89(1), 205–218. Raftery, A. E., Gneiting, T., Balabdaoui, F., & Polakowski, M. (2005). Using Bayesian
model averaging to calibrate forecast ensembles. Monthly weather review, 133(5), 1155–1174. Shanks, D. R., Tunney, R. J., & McCarthy, J. D. (2002). A re-examination of probability matching and rational choice. Journal of Behavioral Decision Making, 15(3), 233–250. Simon, J. R., & Craft, J. L. (1989). The effect of prediction accuracy on choice
reaction time. Memory & Cognition, 17, 503–508. Wickens, C. D., Helton, W. S., Hollands, J. G., & Banbury, S. (2021). Engineering psychology and human performance: Routledge.
LISTED IN THE AHFE DIGITAL BOOKSTORE CATALOGUE
Explore the complete digital volume
Human Factors in Virtual Environments and Game Design
Read this individual research paper free through the original publisher, or explore the full digital proceedings book.
ISBN 978-1-958651-72-8
Explore this ISBN in the AHFE Bookstore ↗Listed in the July 2026 bookstore catalogue; search by ISBN to confirm current availability · Digital book purchase optional