Ritson Delpish, Steven Jiang (2026). Applying Brunswik’s Lens Model to Investigate Decision-Making in Food Bank Operations. In: The Human Side of Service Engineering. AHFE Open Access, vol. 221, pp. 143–148. https://doi.org/10.54941/ahfe1007718
Despite the power of data analytics, the human decision making cannot be overlooked in the food bank operations. To better integrate humans with intelligent systems, judgement policies of food bank operations managers need to be investigated. This study explored the impact and relative importance of cues on agency status decision making using Brunswik’s Lens model. Cues were identified by communicating with senior members of a local food bank Partner Services. Judgment information was drawn from a table combining data from agency monthly reports and account aging summary, while criterion responses were found using a rule-based selection according to food bank documentation. The findings of this study could shed light on integrating humans with intelligent systems.
Food insecurity is defined by the U.S. Department of Agriculture (USDA) as “a household-level economic and social condition of limited or uncertain access to adequate food” (USDA Economic Research Service, 2024). These households lack consistent access to enough food for an active, healthy life (Campbell, 1991; Coleman-Jensen, Gregory, & Singh, 2013). Contrary to the common belief that food insecurity is solely a problem for developing countries, it remains a significant and persistent issue in the United States. In 2024, 13.7 percent of U.S. households—an estimated 18.3 million households—experienced food insecurity, a rate statistically unchanged from 2023 (Rabbitt et al., 2025). Within this group, severe hardship persisted: 5.4 percent of all U.S. households experienced very low food security, a condition involving reduced food intake and disrupted eating patterns. Perhaps most concerning, an estimated 14.1 million children lived in food- insecure households throughout the year.
The food insecurity rate in North Carolina is consistently higher than the national average and remains a significant challenge. According to the 2025 “Map the Meal Gap” report released by Feeding America—the nation’s largest hunger-relief organization—approximately 1 in 7 people (14.3%) in North Carolina experience food insecurity (Feeding America, 2025).
144 Delpish and Jiang The situation is even more severe among children, with 1 in 5 facing food insecurity across the state.
Given its prevalence and persistence, food insecurity is an issue that simply cannot be overlooked. Addressing this challenge requires a multifaceted approach. In addition to federal nutrition programs—such as The Emergency Food Assistance Program (TEFAP) and the Special Supplemental Nutrition Program (SNAP) for Women, Infants, and Children (WIC)—humanitarian relief organizations, particularly food banks, play an indispensable role. As non-profit entities, food banks acquire, sort, and distribute food through extensive networks of partner agencies and direct distribution programs. Their operations are highly complex, requiring critical, data-driven decisions to effectively serve their communities.
In this study, we collaborated with a local food bank that serves 34 counties in North Carolina through a network of over 700 partner agencies. To maintain “Active” status and retain shopping privileges, partner agencies must meet several conditions outlined in the Agency Partnership Agreement. This agreement specifies all requirements related to the food bank’s policies, procedures, and record-keeping standards. Compliance is overseen by the Partner Services and Public Policy Department, which deploys a team of Outreach Coordinators stationed at each branch. These coordinators conduct routine site visits to monitor food safety, food storage practices, and record-keeping. Depending on the severity of the violation and the agency’s compliance history, nonconforming agencies may be placed on probation, suspension, or face termination. Shopping refers to any receipt of products from the food bank, including items obtained through warehouse shopping, the rural delivery program, Mobile Food Pantry, direct distribution, TEFAP, SNAP, the purchase program, and the Retail Donation Program, among others. During shopping appointments, agencies may receive both complimentary and purchased products. Certain repackaged or processed items carry per-pound shared maintenance fees. All transactions are recorded in the agency’s financial account with the food bank. Agencies are required to pay invoices within 30 days of shopping. Occasionally, agencies carry past-due balances of 30 days or more. After 60 days, the finance department may suspend an agency. An agency that remains suspended for six months or maintains a balance beyond 180 days is subject to termination.
Despite the power of data analytics, the human decision making cannot be overlooked in the food bank operations. Given the complexity of the operation, determining an agency’s status is not a simple task and can present challenges, particularly for new employees. This research aims to study the judgment policies employed by food bank staff and identify the key cues that inform their decisions.
UNDERSTANDING THE DECISION PROCESS In reviewing both the agency agreement document with the aging report for account balances against the monthly report data, several agencies’ status was not as expected. Many agencies were listed as active even though the
Applying Brunswik’s Lens Model to Investigate Decision-Making in Food Bank Operations 145 reports showed clear violations of the timely reporting rule (due first day of the month and late after the 5th), zero service report rule, or outstanding balance over 60 days rule. A virtual meeting with senior members of the Partner Services team was convened to understand some of the nuances of decision-making in agency judgment can be found when comparing the judgment model to the criterion. This comparison also identifies what cues played a significant part in the judgment.
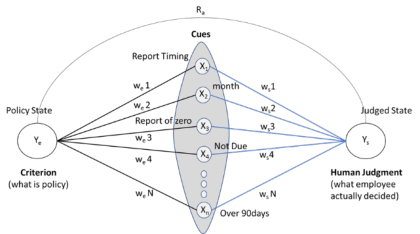
BRUNSWIK’S LENS MODEL In this study, we applied the Brunswik’s Lens Model to investigate the judgement policy of the decision makers. This model is a well-established general theory for analysis of the accuracy and variability of judgments made in environments where perceivable cues are probabilistically related to the criterion state of the world (Brunswik, 1952). The Lens model is based on three main components: judgment, proximal cues, and criterion. Proximal cues (Xn) are the independent variables in the model. In decisions, actors assign weights (rs) to available cues according to their perception of its strength to the response (Ys). In decision-making, cues are perceived based on a probability assigned by the human judge (Ys) representing the judgment made). The criterion (Ye) is the dependent variable and represents the true decision. The lens model equation accounts for accuracy based on the relative weight of different cues perceived by the judge, the relative weight of cues predicting the ecological criterion, and the judge’s consistency (Hammond, Hursch, & Todd, 1964; Stewart, 1988; Tucker, 1964). Table 1 shows the study variables.
Over_90days Independent continuous The criterion values were found using a simple formulation which summarized the conditions and status responses found in the Agency manual. The judgment represents the status decisions made by employees and stored in the monthly reporting. The independent variable month is a number representing the month of the reporting period. Report timing is a count of
146 Delpish and Jiang the number of days in which the report was submitted from the 5th day past the due date. Report of zero is a number representing the reported count of people served by the agency. If multiple numbers are reported for a month, this variable reports the largest value. Variables Not Due, 0 to 30days – Over 90days are figures reflecting account balance for the associated time periods in 30-day increments. The lens model with eight cues and two dependent variables for the study is shown in Figure 1.
Figure 1: Lens model of agency judgement.
RESULTS
Cue validities, wsN, and ecological validities, weN, were computed with a function using Kendall rank correlation coefficient, or Kendall’s tau coefficient, with cues and criterion as arguments. The tau statistic measures association between ordinal measures. The Tau-b statistic was used because it adjusts for ties when testing for concordant pairs of measures (Agresti, 2010). The statistics suggest that the cues were not particularly influential in the judgments to change agency status as none of them were higher than 0.5. Intercue correlations were computed using a correlation analysis on the cues. The table shows very little correlation between cues except for 0 to 30 day and 61 to 90 days cues being moderate. After splitting the data into training and test datasets, the general linear model was built. A program was built in R to generate all the lens model parameters. Running the R script produced four sets of files: a set of fit statistics for Ys, Ye, and Ra, the correspondence between the criterion and the judgment; ROC curves for Ys, Ye, and Ra, regressing the criterion on the judgment; the cue and ecological validities for each cue; and the correlation between each pair of cues.
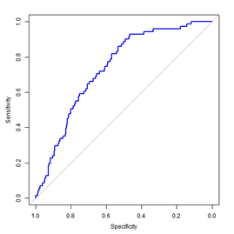
Results of the judgement model indicated that Report_Timing, (p-value < 0.001) was the most significant of the cues, followed by month, 31 to 60 days, and over_90 days (p < 0.05). Table 2 shows the parameter estimates and associated p values for each cue. ROC curve of the results can be seen in Figure 2.
Over_90days 2.13 0.0332* *Cues are significant at 0.05 level of significance
Figure 2: ROC curve of the judgement model results.
On the criterion model fit, month and Report_Timing were the only significant cues (p-value < 0.001). As the month gets smaller, Report_ Timing would naturally increase. Regressing the judgment on the criterion gives the achievement, a measure of how well judgment can predict criterion. The Ra value found was 0.5328, suggesting that the judgment model would not be sufficiently good at predicting status change according to policy.
DISCUSSION AND CONCLUSION This study explored the impact and relative importance of cues on agency status decision-making using Brunswik’s Lens Model. Cues were identified through consultations with senior members of the Partner Services department at a local food bank. Judgment information was drawn from a dataset combining agency monthly reports and account aging summaries, while criterion responses were derived using a rule-based selection process aligned with food bank documentation. A lens model analysis was conducted to understand the factors influencing decisions to change an agency’s status. Early indications suggested that the identified cues were not highly influential in shaping judgments, as reflected in the cue validities. Based on a criterion that simulated the rule structure of food bank policy, the ecological validities indicated that a single cue—Report Timing—had a positive influence on
148 Delpish and Jiang the likelihood of a status change. Model fitting confirmed that most cues provided very little information scent to the judge. One possible explanation for this finding lies in the data itself. The food bank reported that during the data collection period, they were unlikely to place any agency on suspension for late reporting, zero reports, or failure to submit a report. As a result, enforcement policies were relaxed and did not reflect the formal criteria outlined in the agency manual.
In future work, this study could be extended by analyzing data from a period when policies were strictly followed. Another direction for future research is to examine decision-making at the level of individual judges. Finally, a clinical study of the judge side of the lens model may yield improved results by offering greater control over cue identification and cue weighting.
REFERENCES
Agresti, A. (2010). Analysis of ordinal categorical data (2nd ed.). New York, NY: John Wiley & Sons. Brunswik, E. (1952). The conceptual framework of psychology, International
Encyclopedia of Unified Science, Vol. 1, No. 10, University of Chicago. Campbell, C.C., (1991). Food insecurity: A nutritional outcome or a predictor variable? The Journal of Nutrition, 121(3), 408–415. Coleman-Jensen, A., Gregory, C., Singh, A. (2013) Household food security in the
United States in 2013. USDA-ERS Economic Research Report (256). Feeding America (2025), Map the Meal Gap 2025, https://www.feedingamerica.org/ sites/default/files/202505/Map%20the%20Meal%20Gap%202025%20Report. pdf, last accessed on February 16, 2026 Rabbitt, M. P., Reed-Jones, M., Hales, L. J., Suttles, S., & Burke, M. P. (2025).
Household food security in the United States in 2024. U.S. Department of Agriculture, Economic Research Service. USDA Economic Research Service (2024), Definitions of food security, https://www.
ers.usda.gov/topics/food-nutrition-assistance/food-security-in-the-us/definitions- of-food-security/, last accessed on January 16, 2026.
LISTED IN THE AHFE DIGITAL BOOKSTORE CATALOGUE
Explore the complete digital volume
The Human Side of Service Engineering
Read this individual research paper free through the original publisher, or explore the full digital proceedings book.
ISBN 978-1-964867-97-7
Explore this ISBN in the AHFE Bookstore ↗Listed in the July 2026 bookstore catalogue; search by ISBN to confirm current availability · Digital book purchase optional