Enoch Bonsu, Steven Jiang, Benjamin Morrow, Lauren Davis (2025). Understanding Neighbor Food Needs and Preferences through an Interactive Dashboard. In: The Human Side of Service Engineering. AHFE Open Access, vol. 182, pp. 203–207. https://doi.org/10.54941/ahfe1006420
Food insecurity is a social and economic condition where an individual or household have difficulty to obtain safe and nutritious food. Food insecurity in America is a serious issue given that more than 30 million people in America are food insecure. The complex nature of the problem cannot be address by federal nutrition assistance programs alone. Non-profit hunger relief organizations also play a significant role. Feeding America is the nation’s largest hunger relief organization and has over 200 affiliated food banks. Those food banks used to focus on providing emergency food assistance, more and more are paying more attention to the needs and preferences of the people they serve and provide culturally relevant food and food that meets the dietary and other health considerations. Working with a local food bank and its affiliated partner agencies, neighbor preference data were collected. An interactive dashboard was developed to allow decision-makers of the food bank to make evidence-based informed decisions in complex hunger relief operations such as food procurement and distribution.
The United Nations (UN) has established 17 Sustainable Development Goals (SDGs), which are critical to global progress. Among these, eradicating poverty is a cornerstone of sustainable development (United Nations, 2015). However, food insecurity—a social and economic condition characterized by limited or uncertain access to safe and nutritious food (Coleman-Jensen et al., 2020)—remains a pressing global challenge. According to the UN’s State of Food Security and Nutrition in the World (SOFI) report, between 691 and 783 million people faced hunger in 2022, reflecting an increase of 122 million since 2019, prior to the COVID-19 pandemic (FAO, 2023). The report highlights a dire situation: approximately 29.6 percent of the global population, or 2.4 billion people, experienced moderate or severe food insecurity, lacking consistent access to adequate food. Of these, around 900 million individuals faced severe food insecurity, underscoring the urgent need for action.
Despite being a developed nation, the United States faces significant challenges with food insecurity. According to a report by the USDA Economic Research Service (Rabbitt, 2024), in 2023, 18.0 million U.S. households— approximately 13.5% of all households—experienced food insecurity. There were 47.4 million people in food insecure households. These include 17.9 percent of households with children. 12.2 million adults experienced very low food insecurity. In North Carolina, there are 1,493,870 people including 448,460 children that is 1 in 7 people including 1 in 5 children face hunger (Feeding America, 2024).
In the United States, the federal government provides various food assistance programs, such as the Supplemental Nutrition Assistance Program (SNAP) and the Special Supplemental Nutrition Program for Women, Infants, and Children (WIC), to support low-income families. Despite these efforts, food insecurity remains a significant challenge, underscoring the vital role of hunger relief organizations. Feeding America, the nation’s largest hunger relief network, operates approximately 200 affiliated food banks across the country. While food banks have historically focused on the quantity of food distributed, many are now shifting toward providing more appropriate and culturally relevant food options to better serve their communities. A notable trend is the increasing use of terms like “neighbor” instead of “client”to describe those they serve, reflecting a more inclusive and respectful approach. To effectively meet the needs of these neighbors, food banks must better understand their food preferences and requirements. In this study, we collected food preference data using a preference instrument and developed interactive dashboards to assist food bank operations managers in making evidence-based decisions.
DEVELOPING INTERACTIVE DASHBOARDS BASED ON PREFERENCE DATA In this study, we collected food preference data using a survey instrument and developed interactive dashboards to support decision-making. Research has demonstrated that interactive dashboards can assist food bank operations managers in making evidence-based decisions (Desai et al., 2017; Delpish et al., 2019; Hamilton et al., 2023).
Preference Survey Instrument The survey instrument is divided into three sections, comprising a total of 22 questions. Section 1 collects information about the partner agency being visited and the demographic details of the respondent. Section 2 employs a five-point Likert scale to capture respondents’ opinions on specific food categories, such as kitchen staples, canned foods, dry foods, frozen foods, fresh foods, and snacks, as well as any health-related concerns. Section 3 seeks suggestions on the types of foods provided by the partner agency. A screenshot of the survey, as displayed on a mobile device, is shown in Figure 1.
Understanding Neighbor Food Needs and Preferences Through an Interactive Dashboard 205
Figure 1: An example of the survey displayed on a mobile device.
Figure available in the original PDF paper.
Data Collection In collaboration with a local food bank and its affiliated partner agencies, we distributed the survey instrument to individuals receiving food assistance (referred to as “neighbors”). A total of 181 responses were collected.
Interview With a Local Food Bank Operations Manager To ensure the interactive dashboards effectively meet the needs of food bank operations, it is essential to adopt a user-centered design approach. Before developing the dashboard, we interviewed the Vice President of Partnership and Impact at a local food bank to gain insights into their operational requirements and how the data would be used.
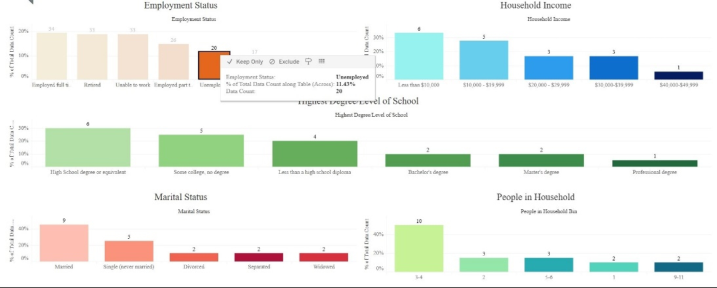
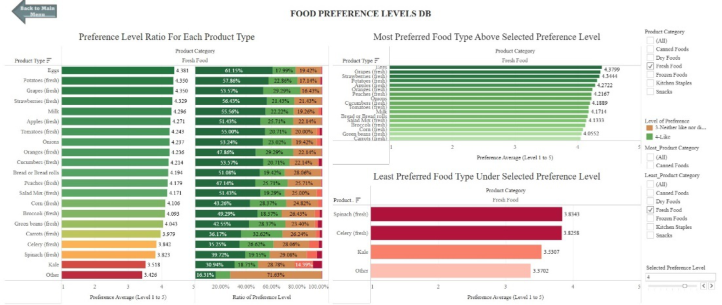
Development of the Interactive Dashboards We developed five interactive dashboards, each focusing on different aspects of the data: survey statistics, demographics, socio-economic status, food situation, and food preferences. The survey statistics dashboard displays the number of responses collected each quarter. The demographics dashboard features multiple interconnected visualizations, enabling users to interact with the data. For example, if a user selects a specific age group, the dashboard dynamically updates to display corresponding demographic details for that group. Similarly, the socio-economic dashboard allows users to focus on specific respondent groups, providing deeper insights into their socio-economic status, as illustrated in Figure 2. The food situation dashboard summarizes preferences for healthy food options (e.g., low sugar, low sodium) and tracks the frequency of skipped meals due to food shortages. The food preference dashboard summarizes the most and least preferred foods, along with the preference level ratio for each food type. Users can select specific food categories and filter results based on preference levels. An example screenshot is provided in Figure 3.
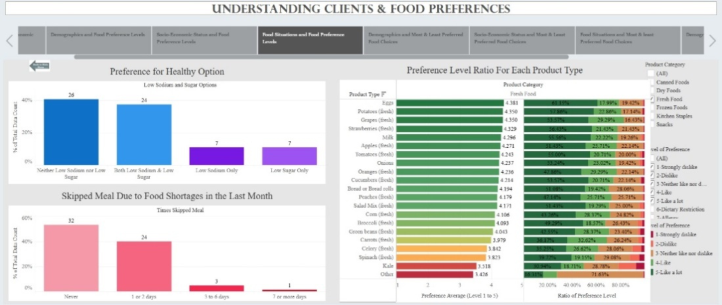
To support food bank operations managers in decision-making, we also developed a story dashboard. This dashboard enables users to explore different scenarios and provides evidence-based decision support. An example of the story dashboard is shown in Figure 4.
Figure 2: An example of the socio economics dashboard.Figure 3: An example of the food preference dashboard.Figure 4: An example of the story dashboard.
CONCLUSION
Hunger relief organizations play a critical role in addressing food insecurity. While these organizations traditionally focused on the quantity of food
Understanding Neighbor Food Needs and Preferences Through an Interactive Dashboard 207
distributed (measured by poundage), many food banks are now shifting their focus toward providing culturally appropriate and relevant food options to their neighbors, who come from diverse ethnic and cultural backgrounds. In this study, we collaborated with a local food bank to collect food preference data from the individuals they serve using a survey instrument. Based on this data, we developed interactive dashboards designed to provide evidence-based decision support, enabling food banks to better serve their communities.
ACKNOWLEDGMENT
This study is partially funded by NSF EiR: Human Centered Visual Analytics for Evidence Based Decision Making in Humanitarian Relief (Award #: CNS 2100855).
REFERENCES
Coleman-Jensen, Alisha, Rabbitt, Matthew P., Gregory, Christian A. and Singh, Anita, 2020, “Household Food Security in the United States in 2019, Agricultural Economic Reports 305691,” United States Department of Agriculture, Economic Research Service. Delpish R., Jiang S., Davis L., Odubela K. (2019) A Visual Analytics Approach to
Combat Confirmation Bias for a Local Food Bank. In: Boring R. (eds) Advances in Human Error, Reliability, Resilience, and Performance. AHFE 2018. Advances in Intelligent Systems and Computing, vol. 778. Springer, Cham. Desai, Y., Jiang, S. & Davis, L. (2017). Development of a Dashboard for a Local Foodbank. American Journal of Engineering and Applied Sciences, 10(1), 218–228. FAO (2023). The State of Food Security and Nutrition in the World 2023. Food and
Agriculture Organization of the United Nations. Feeding America (2025), Hunger in America, https://www.feedingamerica.org/ hunger-in-america/north-carolina, last retrieved on February 27th, 2025. Hamilton, M., Jiang, S., Davis, L. (2023). Understanding the Dietary Need of a
Local Food Bank’s Population Using Visual Analytics. In: Jay Kalra (eds) Health Informatics and Biomedical Engineering Applications. AHFE (2023) International Conference. AHFE Open Access, vol. 78. AHFE International, USA. https:// doi.org/10.54941/ahfe1003452 Rabbitt, M. P., Reed-Jones, M., Hales, L. J., & Burke, M. P. (2024). Household food security in the United States in 2023 (Report No. ERR-337). U.S. Department of Agriculture, Economic Research Service. https://doi.org/10.32747/ 2024.8583175.ers United Nations Educational, Scientific and Cultural Organization, 2015, “Education
for All 2000–2015: Achievements and Challenges: EFA Monitoring Report 2015.” Paris.
LISTED IN THE AHFE DIGITAL BOOKSTORE CATALOGUE
Explore the complete digital volume
The Human Side of Service Engineering
Read this individual research paper free through the original publisher, or explore the full digital proceedings book.
ISBN 978-1-964867-58-8
Explore this ISBN in the AHFE Bookstore ↗Listed in the July 2026 bookstore catalogue; search by ISBN to confirm current availability · Digital book purchase optional