Johannes Stübinger, Fabio Metz, Julian Knoll (2025). Trading on Sentiment: Leveraging Generative Artificial Intelligence for Financial Market Predictions. In: The Human Side of Service Engineering. AHFE Open Access, vol. 182, pp. 11–18. https://doi.org/10.54941/ahfe1006401
The advent of Generative Artificial Intelligence (AI) has revolutionized the field of financial analysis, offering new methodologies for deriving actionable insights from vast and unstructured datasets. This study explores the application of Generative AI to sentiment analysis within the S&P 500, with the goal of identifying profitable trading opportunities. First, our model analyzes news articles to extract sentiment related to publicly traded companies. Second, the sentiment data is integrated into a trading algorithm by determining buy and sell signals for various stocks. Finally, we evaluate the effectiveness of the trading strategy through backtesting. Key performance metrics, e.g., average return per trade of 11.50%, demonstrate the profitability and risk profile of the strategy.
In recent years, the rapid user growth of platforms like ChatGPT or Google Gemini has brought “Generative Artificial Intelligence” (Generative AI) to the forefront as a transformative force in various sectors (Baidoo-Anu & Ansah, 2023; Banh & Strobel, 2023; Dwivedi et al., 2023; Gemini Team, 2024; Teubner et al., 2023; Wessel et al., 2023). Unlike traditional data- driven AI tasks such as predictions, classifications, or recommendations, Generative AI excels in creating unique, realistic, and creative content – ranging from text and images to music – that is often indistinguishable from human-generated work.
In the realm of finance, Generative AI offers novel avenues for process optimization and decision-making. For instance, it can enhance predictive analytics by analyzing vast amounts of historical and real-time data to identify patterns and forecast market movements, thereby improving trading strategies and risk management (Syndell, 2024). Additionally, AI-driven trading systems have the potential to increase market efficiency and liquidity, although they may also introduce challenges such as heightened volatility during periods of market stress (Che et al., 2024; International Monetary Fund, 2024).
This paper investigates the power of Generative AI in the stock market, aiming to identify profitable trading opportunities. First, our model processes news articles to extract sentiment related to all publicly traded S&P 500 companies from January 2024 to February 2025. Next, the sentiment data is incorporated into a trading algorithm to generate buy and sell signals for the corresponding stocks. Finally, we assess the algorithm’s effectiveness through backtesting.
The remainder of this paper is organized as follows: Section 2 situates Generative AI within the broader landscape of AI. Section 3 describes the data and software used in this study. Section 4 outlines the methodology for transforming newspaper content into a trading algorithm. Section 5 presents the results and their analysis. Finally, Section 6 provides conclusions and insights for future developments.
GENERATIVE ARTIFICIAL INTELLIGENCE
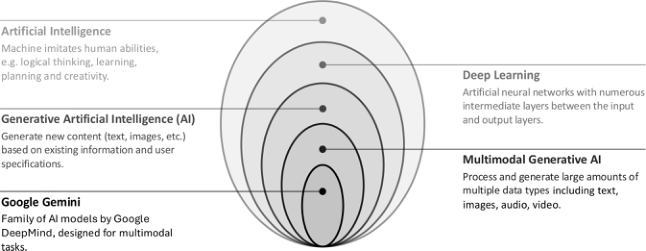
Figure 1 illustrates the hierarchical positioning of Generative Artificial Intelligence (AI) within the broader AI landscape. Building upon the frameworks proposed by Banh and Strobel (2023) and Stübinger (2024), we observe that AI serves as the overarching category, encompassing systems designed to emulate human cognitive functions such as reasoning, learning, planning, and creativity, thereby enabling machines to perform tasks traditionally requiring human intelligence. Within this expansive field, Machine Learning emerges as a pivotal subset, focusing on algorithms that enable machines to learn from data and improve their performance over time without explicit programming. A more specialized branch is Deep Learning, which utilizes Artificial Neural Networks with multiple hidden layers to discern intricate patterns within vast datasets. Generative AI, a subset of Deep Learning, is distinguished by its capability to produce novel content – be it text, images, or music – by leveraging existing data and adhering to user-defined parameters. A prominent advancement within Generative AI is the development of Multimodal Generative AI. Following Gemini Team (2024), multimodal models can process a wide variety of inputs, including text, images, and audio, as prompts and convert those prompts into various outputs, not just the source type. At the forefront of this class is Gemini, an AI chatbot developed by Google. Gemini replies to your prompt with a response using the information that it already knows or fetches from other sources, such as other Google services. This paper harnesses this capability by converting newspaper content about stock market companies into actionable trading signals.
DATA & SOFTWARE For our empirical study, we utilize two datasets: one featuring daily top headlines from Google Search and the other containing daily stock prices of all S&P 500 index constituents. The first part of our dataset originates from Google Search, which dominates the global search engine market with a share exceeding 90%, far outpacing competitors like Bing (Impression
Trading on Sentiment: Leveraging Generative Artificial Intelligence 13
Figure 1: Overview of terms in the context of Generative AI.
Digital Limited, 2025). Specifically, we collect the top 10 daily headlines from worldwide Google News, e.g., “$500 billion in investments: Trump announces AI project” (2025-01-21). Technically, we leverage Gemini’s Grounded Search functionality, which dynamically integrates real-time information from the web. Our approach utilizes this technology to retrieve the latest news and systematically prepare it for further analysis.
The second part of our dataset consists of daily stock prices for all stocks of the S&P 500 index constituents, spanning from January 2024 to February 2025. The S&P 500 tracks the 500 largest publicly traded companies in the U.S. by market capitalization (S&P 500, 2025) and represents approximately 80% of the total U.S. stock market value. As a result, it serves as a key benchmark for investors and economists. The stock prices are adjusted for corporate actions such as stock splits, dividends, and other relevant factors.
The entire methodology in this paper and all relevant evaluations have been implemented in Google Cloud Platform, a suite of cloud computing services that provides infrastructure as a service, platform as a service, and serverless computing environments (Google, 2025). The programming language is Python, which is an interpreted, object-oriented, high-level programming language with dynamic semantics, known for its simple and readable syntax (Python, 2025). To extract news headlines, we utilize the API to Gemini-1.0-Pro by Google, employing prompt-engineered retrieval techniques. Gemini-1.0-Pro is a multimodal Transformer model with an estimated parameter count in the hundreds of billions and a context window of 32,000 tokens. Trained on diverse multilingual and multimodal datasets using advanced optimization techniques, it is designed to enhance long-context processing capabilities (DeepMind, 2024). Sentiment analysis of the extracted headlines is conducted using Gemini-2.0-Flash-Lite by Google. This model introduces a more efficient architecture, featuring an estimated tens of billions of parameters and an extended context window of 1 million tokens. Optimized through knowledge distillation and reinforcement learning, it enables significantly faster and more cost-effective inference while maintaining robust performance (DeepMind, 2024). Stock price time series data is obtained and processed using yfinance, developed by Ran Aroussi (2025).
METHODOLOGY
Our methodology follows a three-step procedure. Namely, we 1) analyze the impact of daily news headlines, 2) transform news impact into trading signals, and 3) execute trades based on signals.
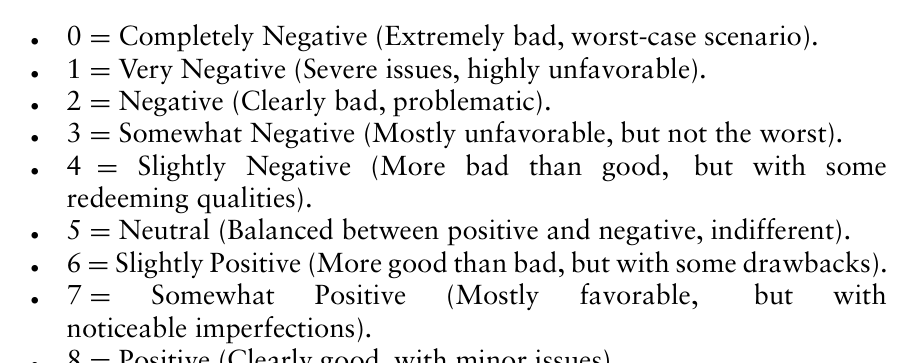
First, we assess the potential impact of daily news headlines on S&P 500 companies. For this purpose, we use Gemini to analyze the sentiment of each day’s headlines to the companies ranging from 0 (completely negative) to 10 (completely positive). Specifically, we define the following sentiment scores:
Equation reproduced from the original PDF.Equation reproduced from the original PDF.
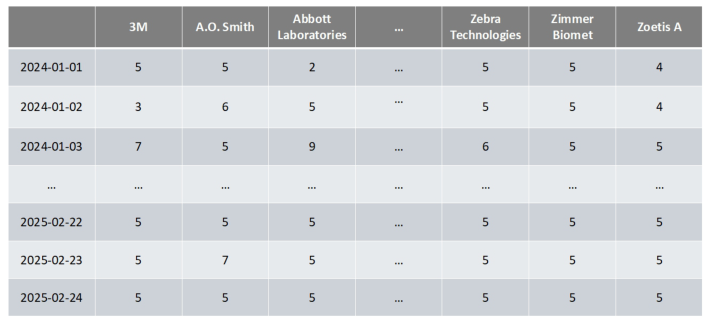
Our methodology is built on a structured prompt engineering approach, ensuring precise model interpretation and consistent, transparent classification. A key advantage of this approach is its dynamic structure, which enables every news item to be evaluated for all companies in the portfolio. This not only allows for the direct assessment of company- specific events but also helps identify indirect effects from industry-wide or macroeconomic developments. Figure 2 illustrates the output of this step, where each row represents a daily assessment of the news impact on individual companies.
Second, we convert the assessed impact into actionable trading signals using the following rules:
If the sentiment score is less than four, we buy the stock, anticipating a future price increase.
If the sentiment score is more than six, we sell the stock, anticipating a future price decrease.
If the sentiment score is between four and six, we do not execute any trade.
Since we can only hold one active trade per company at a time, we ignore additional buy (sell) signals until the previously purchased (sold) stock is sold (bought). Weekend days are neglected in our study. If a trade is open at the last day of our time period, we close the trade.
Third, we use the trading signals to buy and sell stocks. If our assumption holds – namely, that the relationship between news sentiment and future
Trading on Sentiment: Leveraging Generative Artificial Intelligence 15
Figure 2: Future impact of news headlines per day (rows) on S&P 500 companies.
stock returns is captured accurately by the model – we can effectively identify market inefficiencies.
RESULTS
Table 1 reports return characteristics and corresponding risk metrics per trade for the analyzed dataset. The average return per trade is 0.1150, with a Newey-West (NW) standard error of 0.0251 and a corresponding t-statistic of 4.5807. The return distribution exhibits right skewness (2.3029) and strong kurtosis (15.0402), a characteristic desirable for investors, as suggested by Cont (2001). The dispersion of returns, measured by the standard deviation, stands at 0.2570. Considering risk measures, we follow Mina and Xiao (2001) in reporting historical Value at Risk (VaR). The 1% historical VaR is –0.4067, and the 5% historical VaR is –0.2147. Additionally, the conditional Value at Risk (CVaR) measures highlight the severity of losses in extreme cases, with a 1% CVaR of –0.4770 and a 5% CVaR of –0.3184. These risk metrics provide an insight into tail risk and potential downside exposure. From an economic perspective, the return characteristics remain stable. The median return of 0.0682, along with the first and third quartiles (–0.0156 and 0.2261, respectively), indicates a relatively balanced distribution. The maximum observed return reaches 2.6304, while the minimum recorded return is –0.6220. Notably, the share of non-negative returns stands at 71.68%, suggesting a favorable return distribution.
Summarizing, the dataset achieves convincing return characteristics and risk metrics. While statistical significance is not strong based on the NW t-statistic, the overall shape of the return distribution, skewness, and risk-adjusted performance indicate a potentially robust investment strategy. Further examination of systematic risk factors is necessary to validate the sustainability of these results.
Table 1: Return characteristics and risk metrics for the trades from January 2024 until February 2025.
Table available in the original PDF paper.
Key Performance Indicator Value Mean 0.1150 Standard Error (NW) 0.0251 t-Statistic (NW) 4.5807 Minimum -0.6220 Quartile 1 -0.0156 Median 0.0682 Quartile 3 0.2261 Maximum 2.6304 Standard Deviation 0.2570 Skewness 2.3029 Kurtosis 15.0402 Historical VaR 1% -0.4067 Historical CVaR 1% -0.4770 Historical VaR 5% -0.2147 Historical CVaR 5% -0.3184 Share with return ≥0 0.7168
Table 2 presents summary statistics on trading frequency. The average number of trades per company stands at 2.73, with a standard deviation of 1.01, indicating moderate variation in trading activity across firms. The duration of trades highlights the importance of holding periods. On average, trades remain open for 158.37 days, underscoring the need to account for overnight effects and extended market exposure, as emphasized by Kappou et al. (2010). This aligns with findings in the literature, where longer trade durations can influence risk and return dynamics. Summarizing, the observed trading frequency and trade duration provide insights into the trading strategy’s structure. The variation in the number of trades per company suggests differences in execution, while the extended trade duration reinforces the need for risk management strategies to mitigate long-term exposure.
Table 2: Trading statistics from January 2024 until February 2025.
Table available in the original PDF paper.
Key Performance Indicator Value Average number of trades per company 2.73 Standard deviation of trades per company 1.01 Average time trades are open in days 158.37
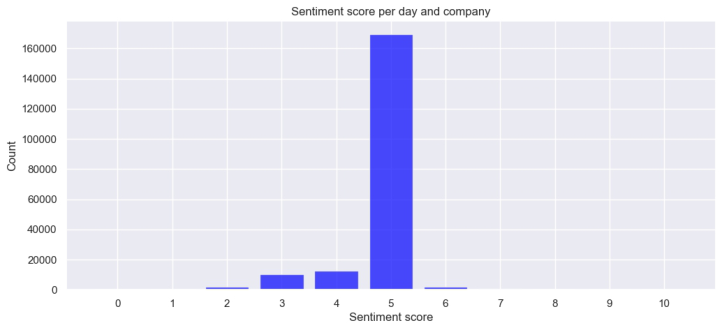
Figure 3 shows the distribution of the sentiment score per day and company. The vast majority of sentiment scores are concentrated around 5, suggesting a generally neutral sentiment. The average sentiment score appears to be around this range, with low sentiment volatility, indicating relatively stable sentiment over time. We observe an asymmetric distribution, where negative scores are more likely than positive ones. Extreme values of 0 or 10 are not existing.
Trading on Sentiment: Leveraging Generative Artificial Intelligence 17
Figure 3: Future impact of news headlines per day (rows) on S&P 500 companies.
CONCLUSION
This study explores the application of Generative AI for sentiment analysis in financial markets, particularly in predicting stock price movements based on news sentiment. The methodology involves analyzing financial news headlines, extracting sentiment scores, and integrating them into a trading strategy. Backtesting results indicate promising return characteristics, with a majority of trades yielding positive returns. However, the results also highlight the need for further refinement, as statistical significance remains weak, and market inefficiencies need further validation.
For next steps, future research should focus on enhancing the sentiment analysis model, incorporating alternative data sources such as social media and earnings call transcripts, and testing more advanced trading strategies, e.g., deep learning-based portfolio optimization. Additionally, risk management techniques should be refined to mitigate drawdowns and improve overall trading performance. Finally, conducting a comparative study against other AI-driven trading strategies could provide deeper insights into the strengths and limitations of Generative AI in financial market predictions.
REFERENCES
Aroussi, R. (2025). yfinance: Stock market data extraction and processing. GitHub Repository. Retrieved from https://github.com/ranaroussi/yfinance. Baidoo-Anu, D., Ansah, L. O. (2023). Education in the era of Generative Artificial
Intelligence (AI): Understanding the potential benefits of ChatGPT in promoting teaching and learning. Journal of AI, 7(1), 52–62. Banh, L., Strobel, G. (2023). Generative Artificial Intelligence Electronic Markets.
33(1), 1–17. Che, C., Huang, Z., Li, C., Zheng, H., & Tian, X. (2024). Integrating Generative AI into financial market prediction for improved decision making. arXiv preprint arXiv:2404.03523. Cont, R. (2001). Empirical properties of asset returns: Stylized facts and statistical
issues. Quantitative Finance 1 (2), 223–236.
DeepMind. (2024). Gemini: A family of highly capable multimodal models.
Retrieved from https://deepmind.google/technologies/gemini/. Dwivedi, Y. K., Kshetri, N., Hughes, L., Slade, E. L., Jeyaraj, A., Kar, A. K., Baabdullah, A. M., Koohang, A., Raghavan, V., Ahuja, M., Albanna, H., Albashrawi, M. A., Al-Busaidi, A. S., Balakrishnan, J., Barlette, Y., Basu, S., Bose, I., Brooks, L., Buhalis, D., Wright, R. (2023). “So what if ChatGPT wrote it?” Multidisciplinary perspectives on opportunities, challenges and implications of generative conversational AI for research, practice and policy. International Journal of Information Management, 71, 102642. Google Gemini (2024). Gemini: A family of highly capable multimodal models.
arXiv preprint arXiv:2312.11805. Google. (2025). Infrastructure, services, and serverless computing. Google Cloud Documentation. Retrieved from https://cloud.google.com/docs. Impression Digital Limited (2025). Bing vs Google: Search Engine Comparison 2025.
Retrieved from https://www.impressiondigital.com/blog/bing-differ-google/. International Monetary Fund (2024). Artificial Intelligence Can Make Markets More Efficient – and More Volatile. Retrieved from https://www.imf.org/en/Blogs/ Articles/2024/10/15/artificial-intelligence-can-make-markets-more-efficient-and- more-volatile. Kappou, K., Brooks, C., Ward, C. (2010). The S&P500 index effect reconsidered:
Evidence from overnight and intraday stock price performance and volume. Journal of Banking & Finance 34 (1), 116–126. Mina, J., Xiao, J. Y. (2001). Return to RiskMetrics: The evolution of a standard.
RiskMetrics Group. Python. (2025). Python programming language: Features and applications. Retrieved from https://docs.python.org/3/. S&P 500 (2025). S&P 500 Overview. Retrieved from https://www.spglobal.com/
spdji/en/indices/equity/sp-500/. Stübinger, J. (2024). Beyond traditional boundaries: The impact of Generative Artificial Intelligence on higher education. Health Informatics and Biomedical Engineering Applications, 160. Syndell. (2024). How generative AI in stock trading will transform market. Retrieved
from https://syndelltech.com/generative-ai-in-stock-trading/. Teubner, T., Flath, C. M., Weinhardt, C., van der Aalst, W., Hinz, O. (2023). Welcome to the era of ChatGPT et al.: The prospects of large language models. Business & Information Systems Engineering, 65, 95–101. Wessel, M., Adam, M., Benlian, A., Majchrzak, A., Thies, F. (2023). Call for papers to
the special issue: Generative AI and its transformative value for digital platforms. Journal of Management Information Systems.
LISTED IN THE AHFE DIGITAL BOOKSTORE CATALOGUE
Explore the complete digital volume
The Human Side of Service Engineering
Read this individual research paper free through the original publisher, or explore the full digital proceedings book.
ISBN 978-1-964867-58-8
Explore this ISBN in the AHFE Bookstore ↗Listed in the July 2026 bookstore catalogue; search by ISBN to confirm current availability · Digital book purchase optional